
- Moving the markets
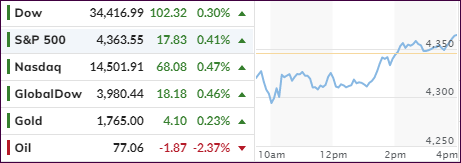
During the early part of today’s session, the market ping-pong continued, when the major indexes took a steep dive with the Dow down some 400 points and on pace to again wipe out the previous day’s gains.
However, a slow but steady rebound ensued with equities digging themselves out of a deep hole and scoring a green close, the second one in a row. This rebound was supported by optimism about a debt ceiling deal, causing traders to jump back into the much-neglected tech sector.
CNBC called it this way:
Stocks reversed course on news that Senate Minority Leader Mitch McConnell told a closed meeting of Republicans that he would offer a short-term debt ceiling extension later Wednesday. That would help relieve some pressure on Congress to avoid a U.S. default currently expected on Oct. 18.
As a result, the dip was bought, despite nagging concerns about risings interest rates, surging inflation, the state of reopening, and the debt limit being on everyone’s mind.
Bond yields spiked and then tumbled but closed higher with the 10-year ramping to almost 1.57%, before pulling back into the close and ending the day at 1.528%.
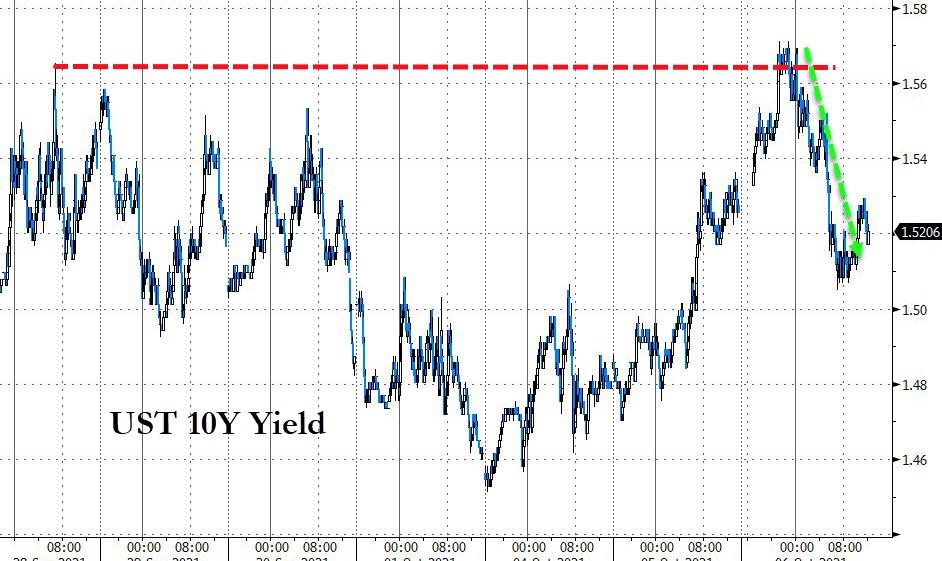
The US Dollar moved in similar fashion, first up and then down, but it also closed higher for the session.
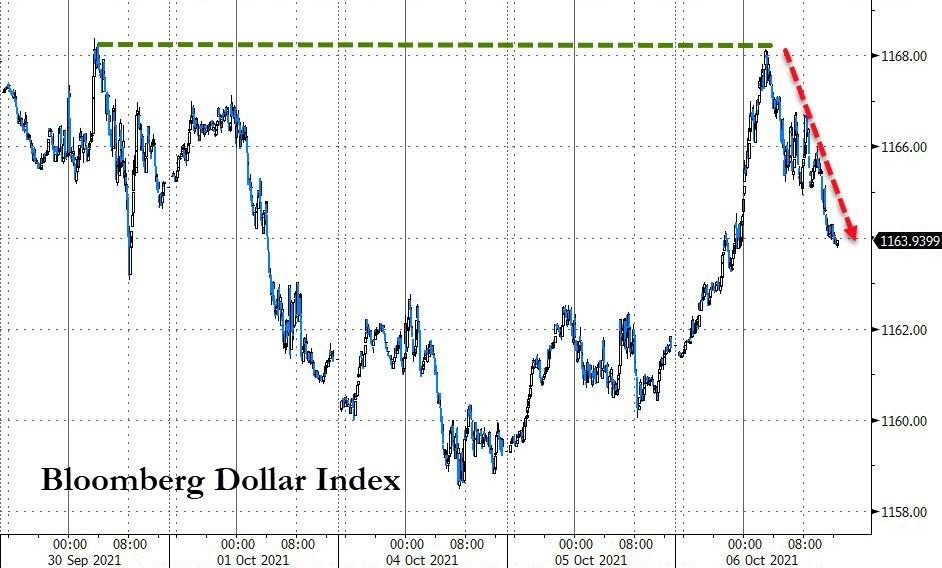
The roller coaster ride in both, bond yields and the dollar, aided Gold for the day with the precious metal bouncing moderately and scoring a gain of 0.23%.
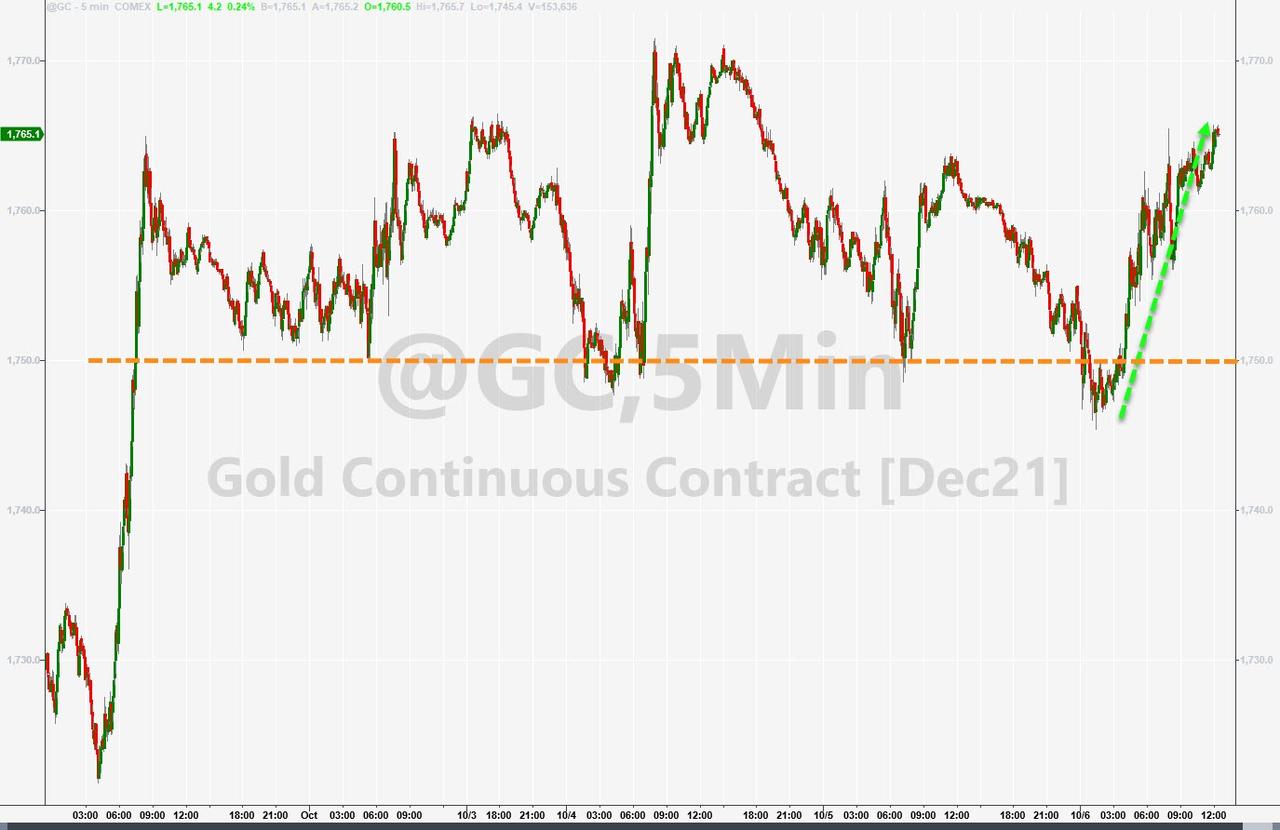
So far, the month of October has sure lived up to its reputation as the most volatile month of the year. And we’re only 6 days into it.
2. ETFs in the Spotlight
In case you missed the announcement and description of this section, you can read it here again.
It features some of the 10 broadly diversified domestic and sector ETFs from my HighVolume list as posted every Saturday. Furthermore, they are screened for the lowest MaxDD% number meaning they have been showing better resistance to temporary sell offs than all others over the past year.
The below table simply demonstrates the magnitude with which these ETFs are fluctuating above or below their respective individual trend lines (%+/-M/A). A break below, represented by a negative number, shows weakness, while a break above, represented by a positive percentage, shows strength.
For hundreds of ETF choices, be sure to reference Thursday’s StatSheet.
For this current domestic “Buy” cycle, here’s how some our candidates have fared:
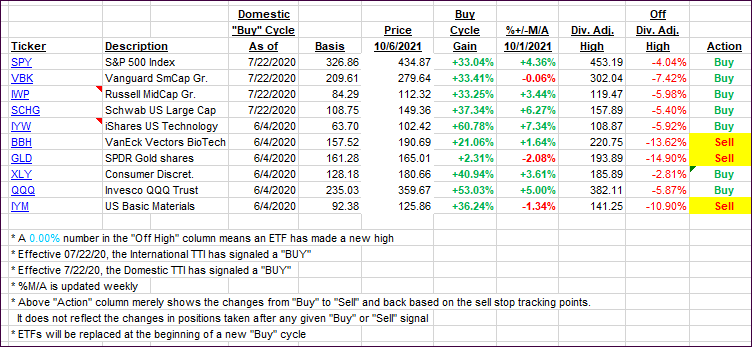
Click image to enlarge.
Again, the %+/-M/A column above shows the position of the various ETFs in relation to their respective long-term trend lines, while the trailing sell stops are being tracked in the “Off High” column. The “Action” column will signal a “Sell” once the -8% point has been taken out in the “Off High” column. For more volatile sector ETFs, the trigger point is -10%.
3. Trend Tracking Indexes (TTIs)
Our TTIs were mixed with the International one declining, while the Domestic one gained tad.
This is how we closed 10/06/2021:
Domestic TTI: +4.74% above its M/A (prior close +4.59%)—Buy signal effective 07/22/2020.
International TTI: +1.96% above its M/A (prior close +2.29%)—Buy signal effective 07/22/2020.
Disclosure: I am obliged to inform you that I, as well as my advisory clients, own some of the ETFs listed in the above table. Furthermore, they do not represent a specific investment recommendation for you, they merely show which ETFs from the universe I track are falling within the specified guidelines.
All linked charts above are courtesy of Bloomberg via ZeroHedge.
Contact Ulli