ETF Tracker Newsletter For September 30, 2022

Ulli ETF Tracker Contact

ETF Tracker StatSheet          

You can view the latest version here.

A BRUTAL MONTH ENDS WITH ANOTHER DIVE
[Chart courtesy of MarketWatch.com]

  1. Moving the markets

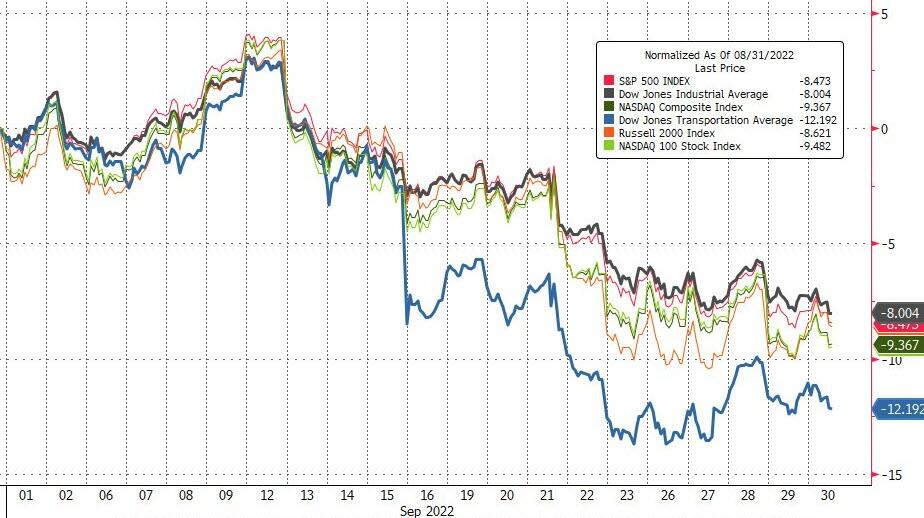
The jury is now out that this has been the worst September for stocks since 2008. That’s a big ouch for those still believing the farce of buying and holding forever by not recognizing when major trends have changed from bullish to bearish.

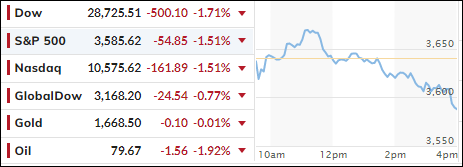
Despite an early hopeful bounce, the major indexes reversed and hit the skids today, as if to add more insult to injury during this last trading day of the month. The final numbers are simply daunting.

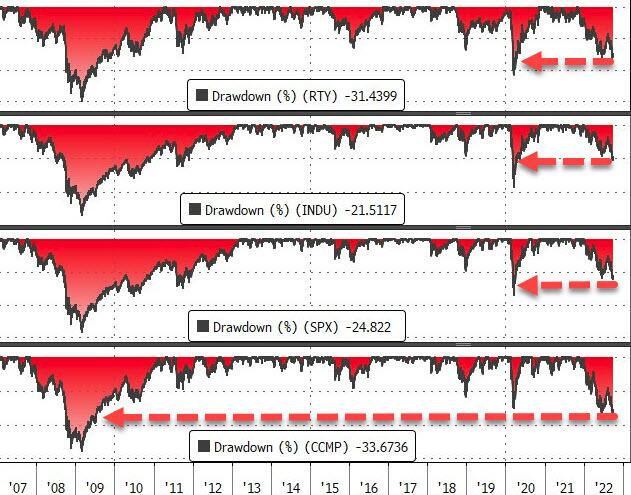
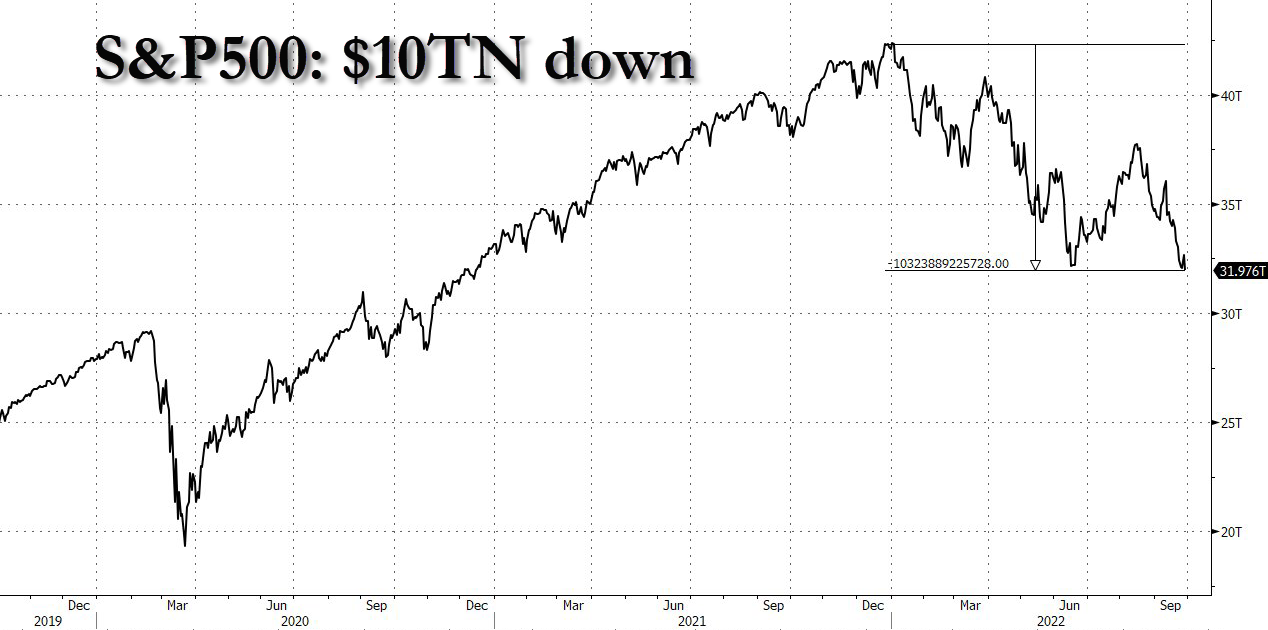
Looking at the widely held barometer, the S&P 500, the index simply got clobbered, no matter which time frame you look at. For the week it is down -2.9%, for the month it got hammered -9.3%, and for the quarter it lost -5.3%.

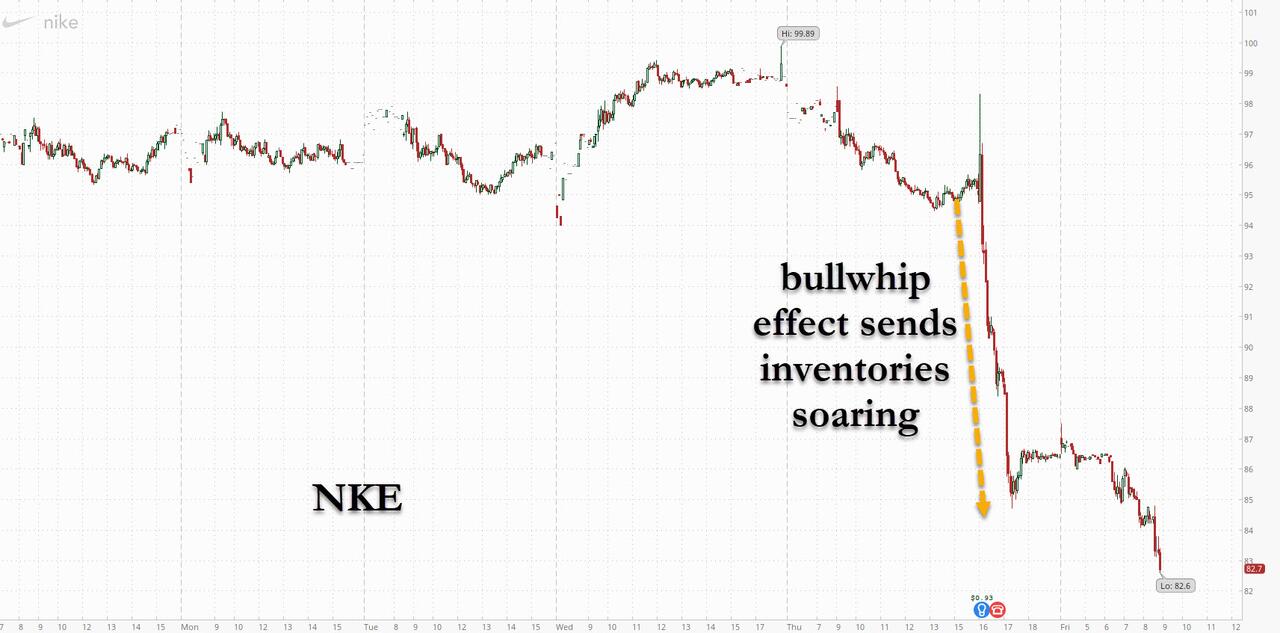
Individual stocks got spanked as well, with the latest victim being Nike, which “experienced” an unexpected inventory surge, that dropped its stock almost 13% on concerns of  consumers’ ability to continue spending as inflation worsens.

That became apparent, as the Fed’s favorite inflation indicator unexpectedly surged with personal spending jumping, which killed the idea that, despite the US economy sliding into a recession and global markets ‘turmoiling,’ inflation would finally relent, as ZeroHedge opined.

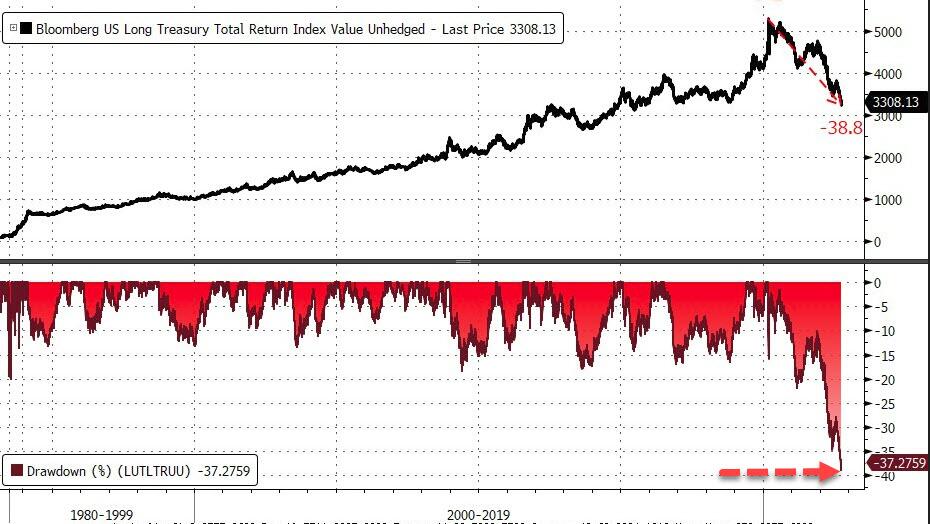
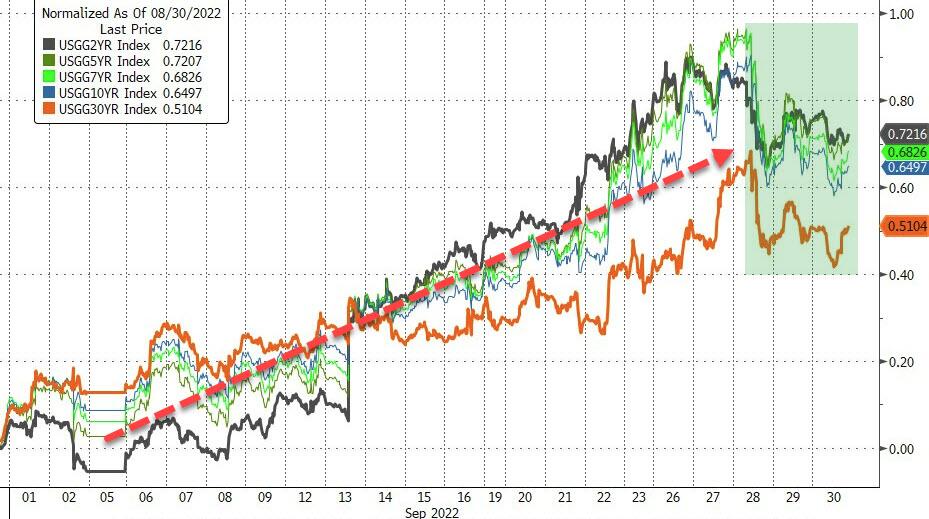
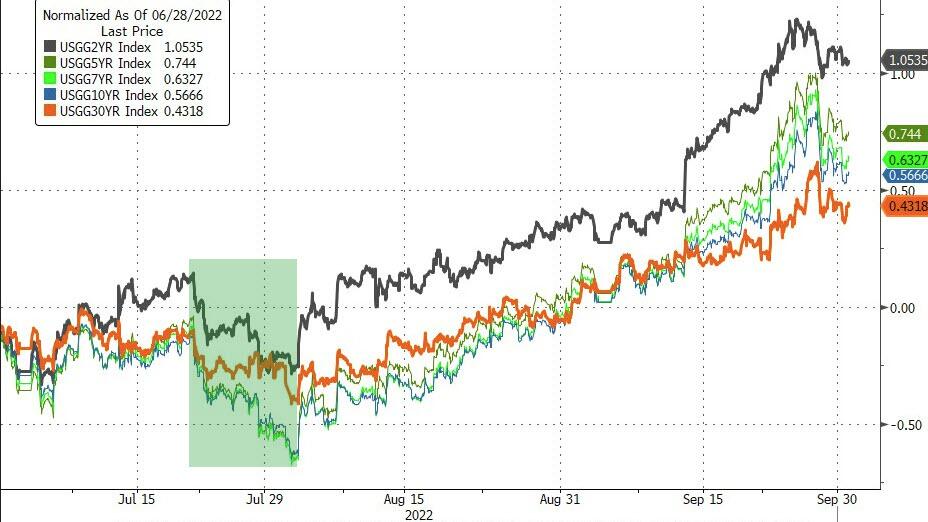
Global bond markets stumbled as well, as US bond yields continued to be the wrecking ball of equities; not just during September but also since the June lows, as the much hoped for Fed pivot turned out to be nothing but a pipe dream—so far.   

Added ZeroHedge:

Q3 is the 3rd quarter in a row during which a ‘balanced’ stock/bond portfolio lost money (if it wasn’t for July’s gains, this would have been the worst quarter ever for a stock/bond portfolio)

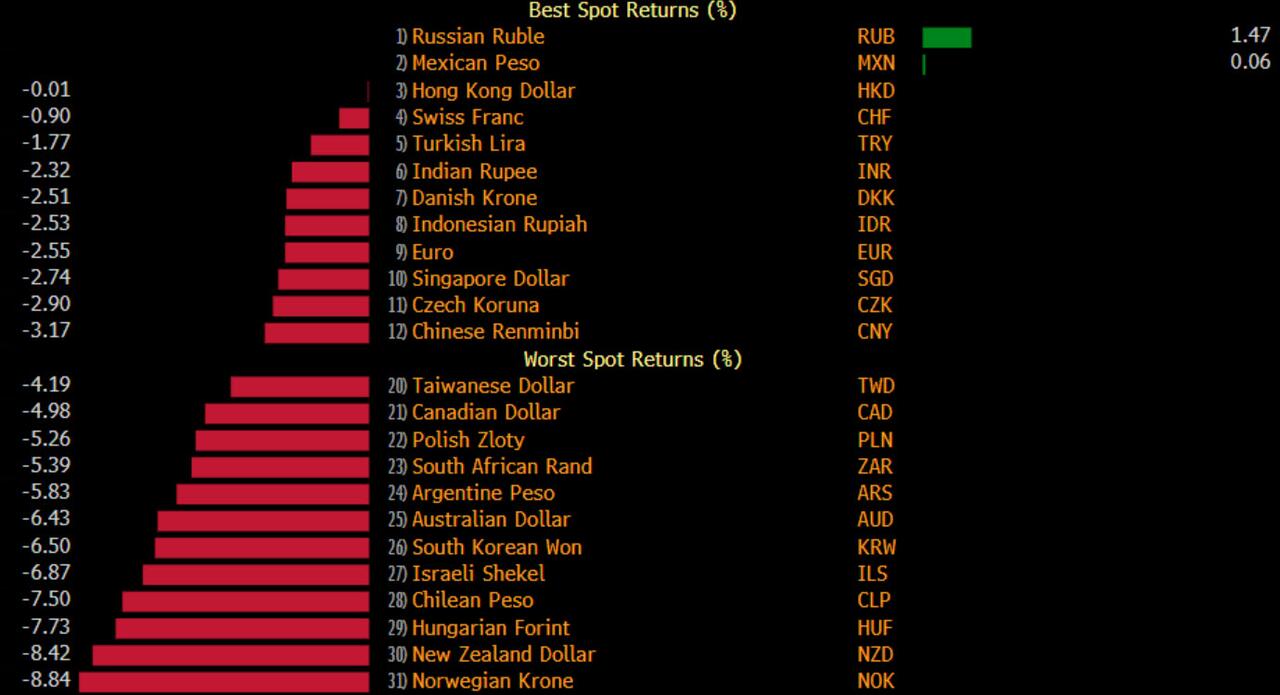
The US Dollar advanced for the 4th straight month, as most fiat currencies got clobbered with the exception of the Russian Ruble, which was the best performer.

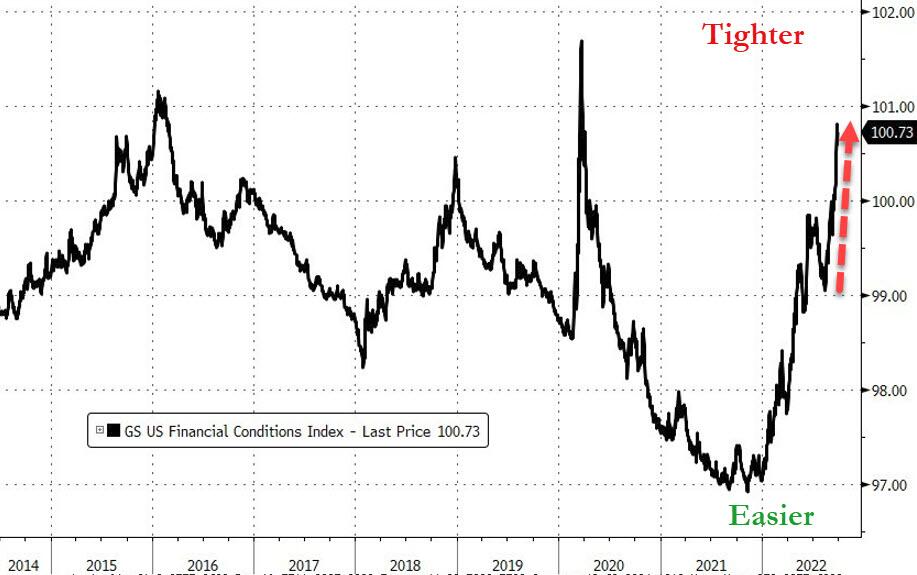
Financial conditions have tightened, and it looks to me that volatility and consequently lower equity prices will be with us a lot longer, unless the earnings season turns into a blowout event, or Fed head Powell indicates that a “pivot” could be in the cards.

What are the odds?

Read More
Weekly StatSheet For The ETF Tracker Newsletter – Updated Through 09/29/2022

Ulli ETF StatSheet Contact

ETF Data updated through Thursday, September 29, 2022

Methodology/Use of this StatSheet:

1. From the universe of over 1,800 ETFs, I have selected only those with a trading volume of over $5 million per day (HV ETFs), so that liquidity and a small bid/ask spread are assured.

2. Trend Tracking Indexes (TTIs)

Buy or Sell decisions for Domestic and International ETFs (section 1 and 2), are made based on the respective TTI and its position either above or below its long-term M/A (Moving Average). A crossing of the trend line from below accompanied by some staying power above constitutes a “Buy” signal. Conversely, a clear break below the line constitutes a “Sell” signal. Additionally, I use an 12% trailing stop loss on all positions in these categories to control downside risk.

3. All other investment arenas do not have a TTI and should be traded based on the position of the individual ETF relative to its own respective trend line (%M/A). That’s why those signals are referred to as a “Selective Buy.” In other words, if an ETF crosses its own trendline to the upside, a “Buy” signal is generated. Here too, I recommend trailing sell stop of 12%, or less, depending on your risk tolerance.

If you are unfamiliar with some of the terminology, please see Glossary of Terms and new subscriber information in section 9.     

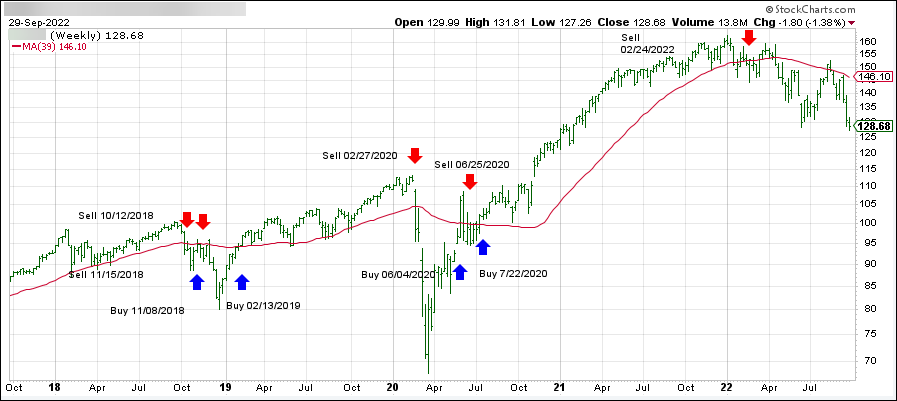
1. DOMESTIC EQUITY ETFs: SELL — since 02/24/2022

Click on chart to enlarge

Our main directional indicator, the Domestic Trend Tracking Index (TTI-green line in the above chart) has broken below its long-term trend line (red) by -12.41% and remains in “SELL” mode.  

Read More

Exuberance Returns As Bank Of England Intervenes

Ulli Market Commentary Contact

[Chart courtesy of MarketWatch.com]

  1. Moving the markets

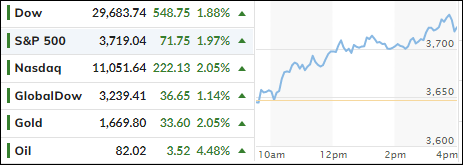
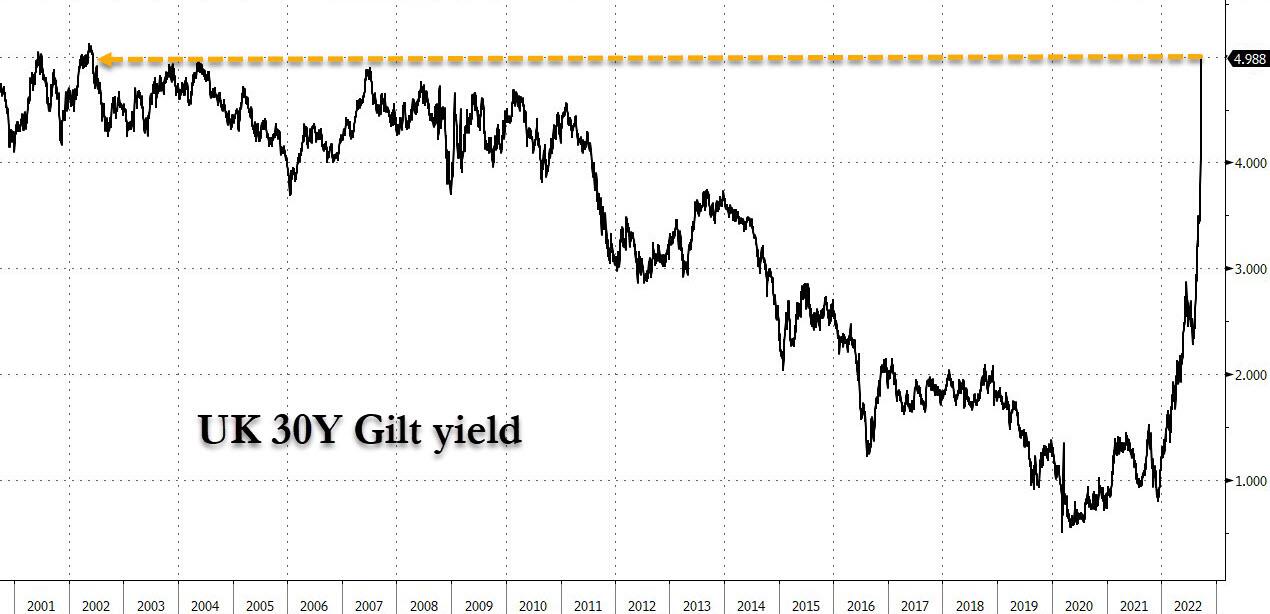
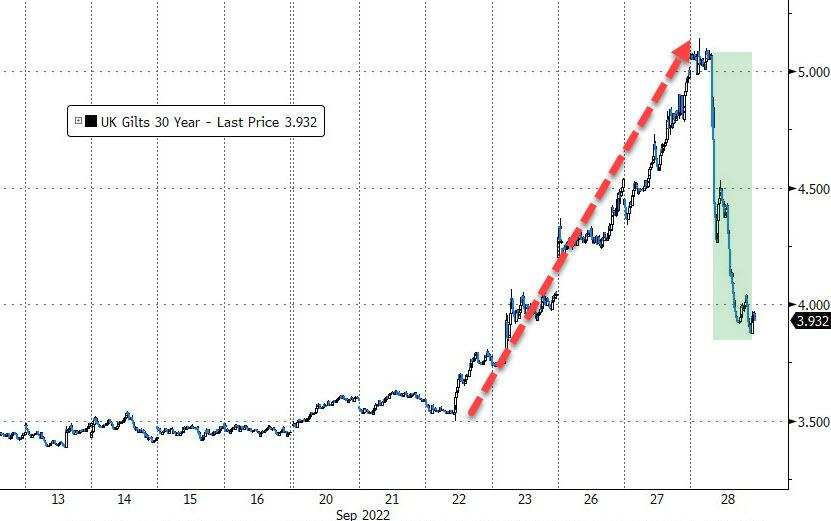
After yesterday’s breakdown in the UK Gilt (bond) market, during which the 30-year gilt rose above 5%, a level not seen since 2002, according to ZeroHedge, the Bank of England capitulated today and reversed course, AKA they pivoted from hawkish to dovish.

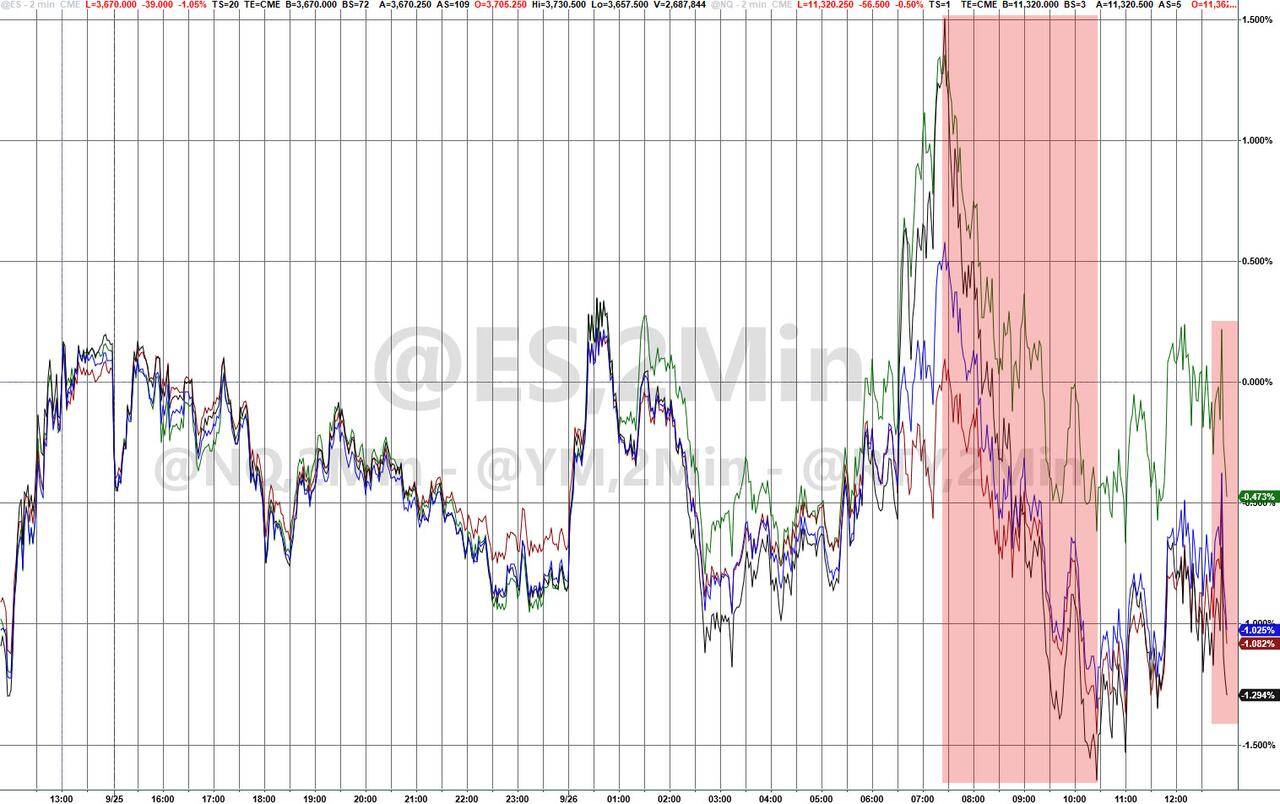
It recognized “significant dysfunction” in the bond market and “material risk” to financial stability by pivoting from QT (Quantitative Tightening) to QE (Quantitative Easing) by “carrying out temporary purchases of long-dated UK government bonds.” The result was interest rates coming off yesterday’s highs, a move that stimulated the bullish crowd and ramped up equities around the world.

While pondering what this all means, ZeroHedge summed it up succinctly:

Pivot means that central banks can’t take any more pain and will soon do QE and rate hikes at the same time everywhere, eventually ending hiking and starting to cut rates – the bottom line is that this is the beginning of the end for the fiat system which now faces a terminal dilemma: fight inflation and suffer market collapse and economic depression with millions laid off, or push to stabilize social order and employment with higher asset prices, runaway (hyper)inflation be damned.

The assumption now is, despite Fed evidence to the contrary, that all Central Banks will “fold and follow,” thereby ending the much-despised act of hiking rates and bringing back the main equity driver in form of rate reductions. That’s what Wall Street had been hoping for all along, but it remains to be seen if or when the Fed follows suit, which is the big unknown. If they fold now, their reputation will take another hit, as a surge in hyper-inflation will be the unavoidable result.

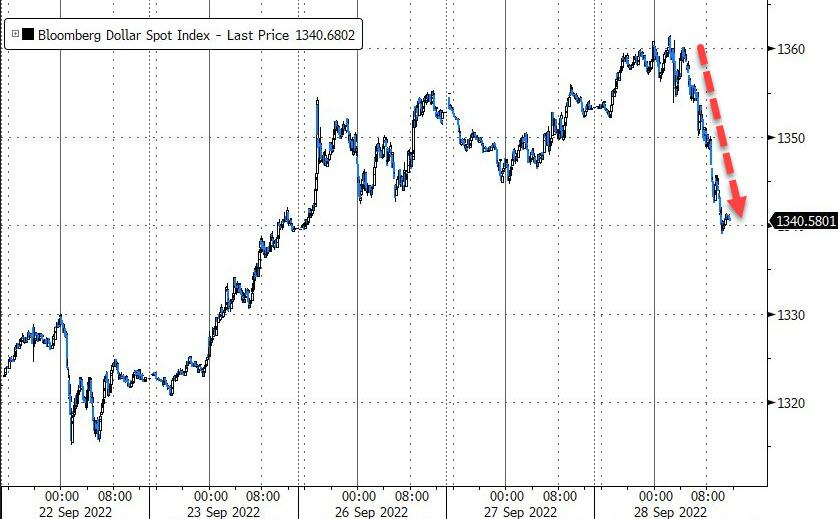
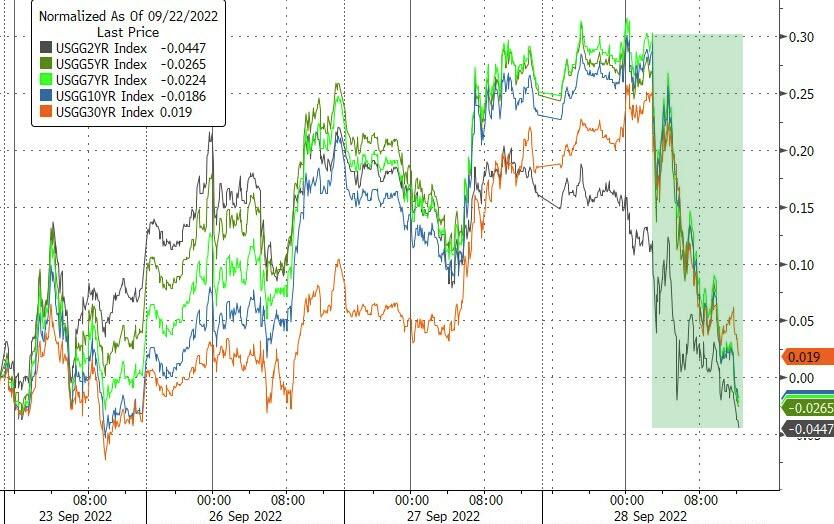
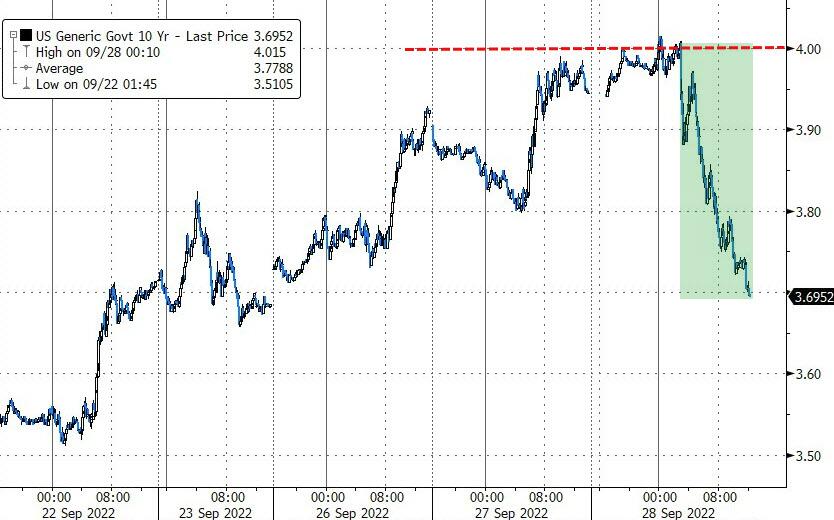
Helping today’s rebound was a sharp sell-off in the US Dollar, which helped gold to gain some 2%. Then Bond yields cratered, with the 10-year dropping almost 22 bps to close at 3.73%, after conquering the 4% level intra-day, which gave a much needed assist to equities. This was the biggest daily drop in 10-year yields since 2009, as ZeroHedge reported.

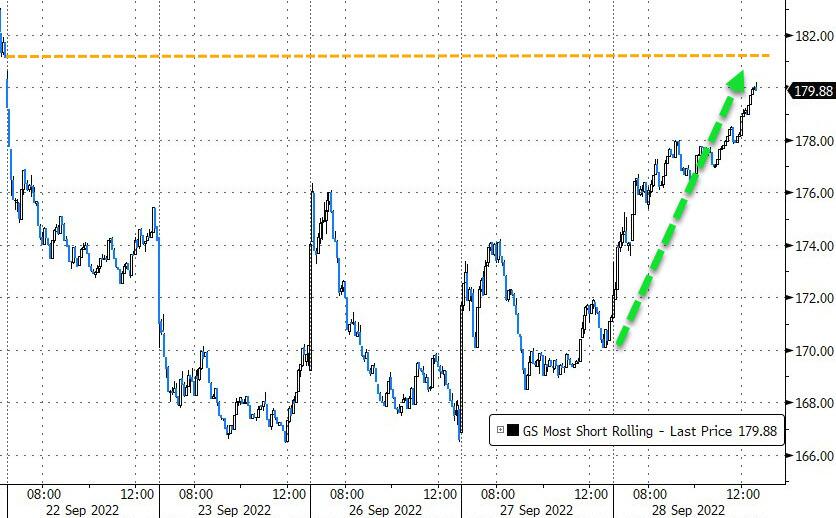
And, of course, no rally is worth mentioning, unless it’s accompanied by a short squeeze, and today we saw a massive one. The bulls were happy, although in terms of leaving bear market territory behind, we a have a long way to go (section 3).

Read More

Homing In On The June Lows

Ulli Market Commentary Contact

[Chart courtesy of MarketWatch.com]

  1. Moving the markets

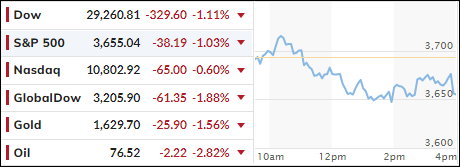
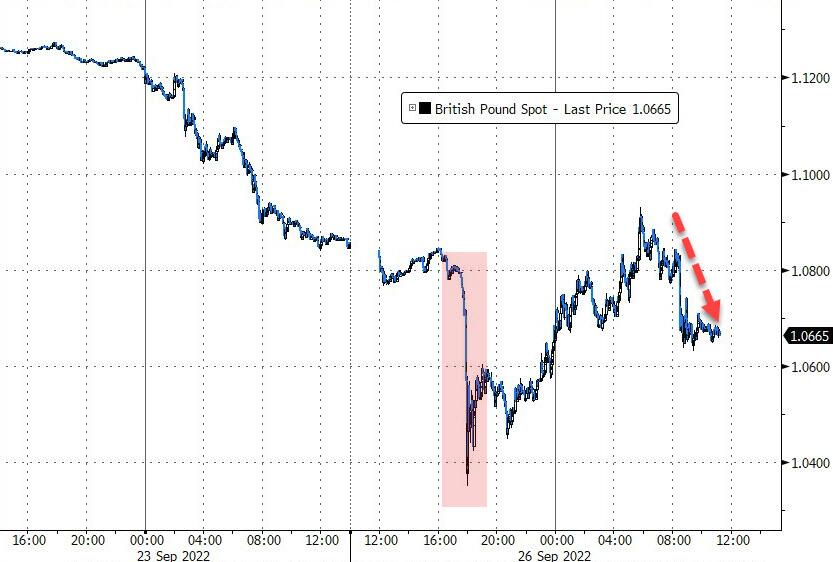
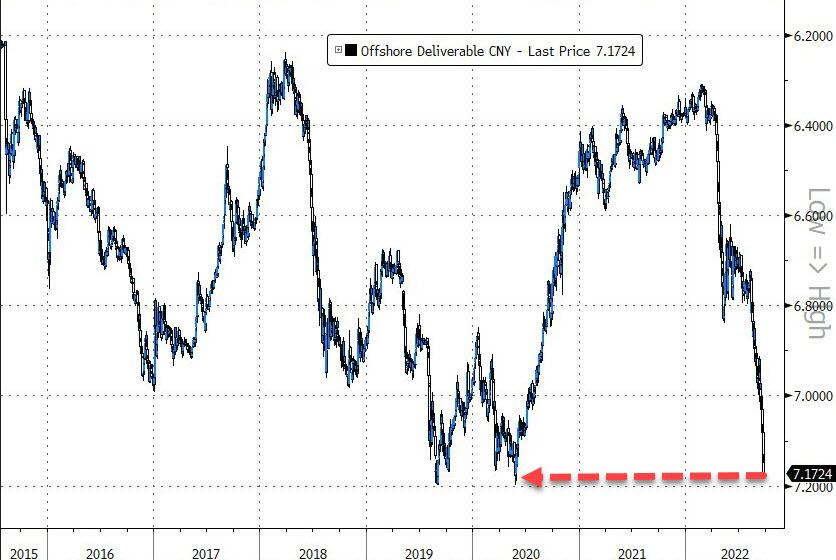
Equities took in on the chin again with the major indexes notching another loss, as interest rates rose among unrest in a variety of global currencies. The British Pound (BP) had at one point fallen 4% against the Dollar but came off its lows on rumors of the Bank of England having to raise more aggressively to battle inflation. Amazingly, the BP is now within striking distance of parity with the dollar, while the Yuan is heading towards all-time lows.

As the Fed has continued its aggressive hiking campaign, the US Dollar’s surge has ravaged many other currencies, most notably the Euro, which has now hit a low not seen since 2002.

The S&P is homing in on the June lows and at one point briefly fell below that low point of the year, but the index closed slightly above it. Sometimes, those lows can serve as a support level for a rebound but, given the current economic and financial environment, I believe the odds of a breakthrough to lower prices are greater than a recovery.

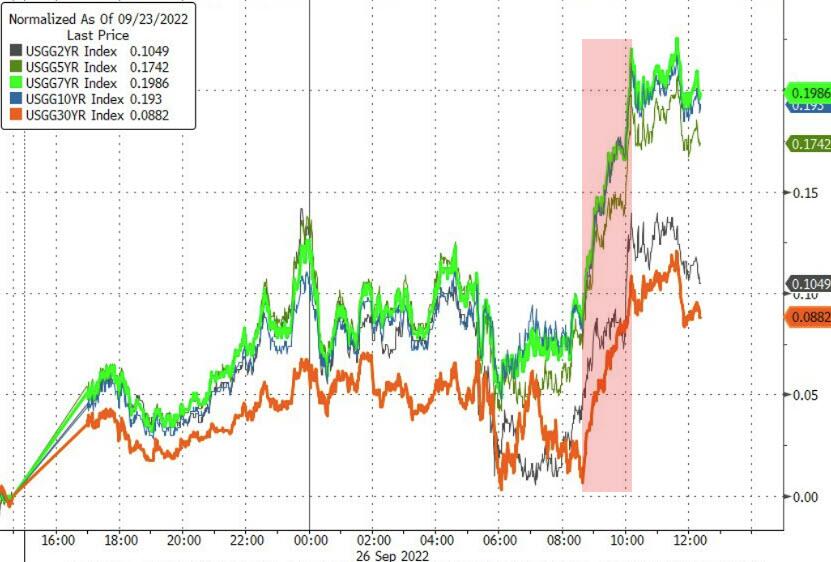
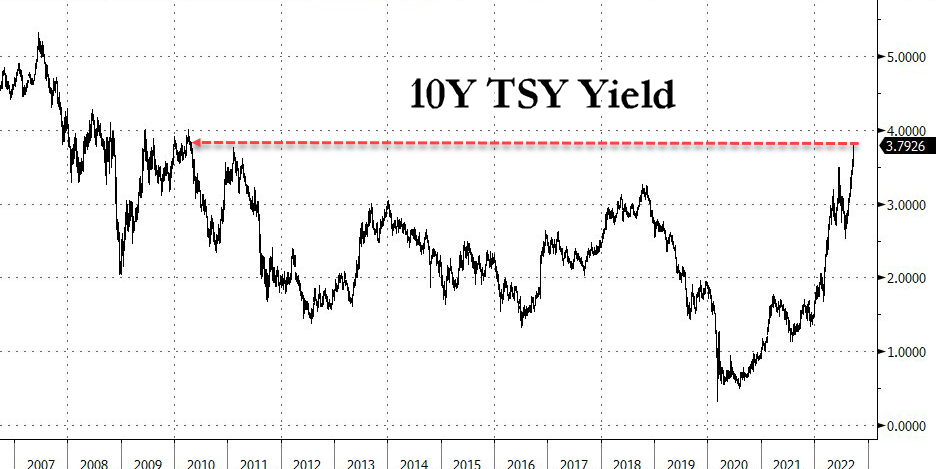
Supporting my view is the action in the bond markets where yields spiked with the 10-year topping 3.9% at one point during the session, which was its highest level since 2010. The 2-year yield, which is more aligned with Fed policy, surpassed 4.3%, as MarketWatch noted, the highest level since 2007.

After last week’s brutal spanking, the downward trend continues with stocks and bonds seemingly getting clobbered in sync, while Gold is being pushed down to invalidate it as an alternative investment, a condition that will not last forever. Even Crude Oil was not exempt from bearish forces and was pulled below the $80 level.

I will be out tomorrow to be able to fully “engage” with my scheduled colonoscopy (humor attempt), but I will return Wednesday for the market report.

Read More

ETFs On The Cutline – Updated Through 09/23/2022

Ulli ETFs on the Cutline Contact

Below, please find the latest High-Volume ETF Cutline report, which shows how far above or below their respective long-term trend lines (39-week SMA) my currently tracked ETFs are positioned.

This report covers the HV ETF Master List from Thursday’s StatSheet and includes 312 High Volume ETFs, defined as those with an average daily volume of more than $5 million, of which currently 14 (last week 25) are hovering in bullish territory. The yellow line separates those ETFs that are positioned above their trend line (%M/A) from those that have dropped below it.

Take a look:                                                                   

The HV ETF Master Cutline Report

In case you are not familiar with some of the terminology used in the reports, please read the Glossary of Terms. If you missed the original post about the Cutline approach, you can read it here.      

ETF Tracker Newsletter For September 23, 2022

Ulli ETF Tracker Contact

ETF Tracker StatSheet          

You can view the latest version here.

GETTING SLAMMED

[Chart courtesy of MarketWatch.com]

  1. Moving the markets

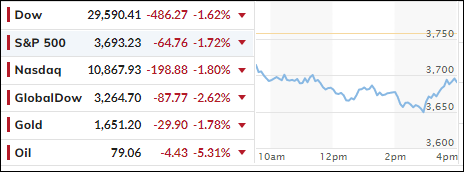
Thanks to a last hour comeback, the markets were able to avoid a far worse outcome, as the Dow was down over 800 points, which was its low for the session.

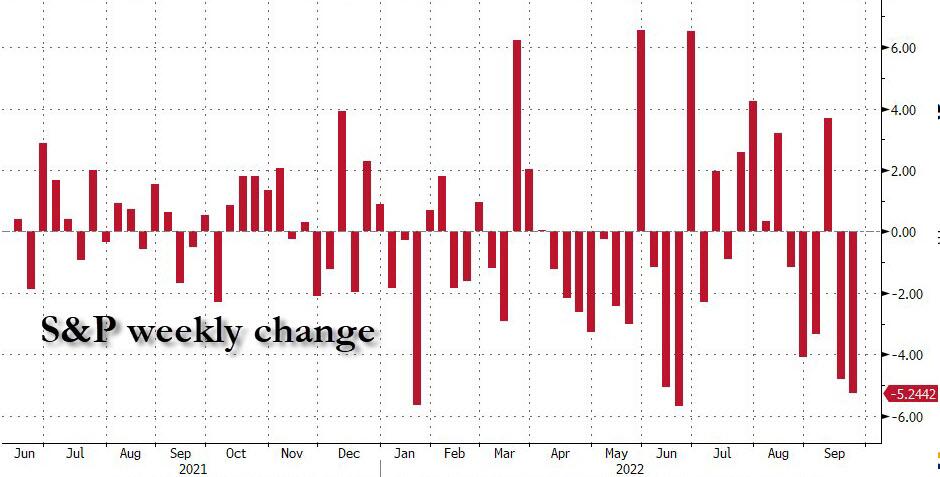
Still, the major indexes, and the broad market, got hammered again, with the Dow closing below its 30k level for the first time since June 17 and scored their 5th negative week out of six, as the S&P 500 tumbled 5.2%.

It was a brutal five trading days, as surging rates and foreign currency upheaval left their marks and confirmed that a global recession is indeed a real possibility. It appears that the markets have now transitioned from the meme of inflation concerns to worries about an aggressive Fed trying to slay the former at the cost of a sharp economic slowdown.

Carnage best describes the market action of today, this week, this month, and this year, as ZeroHedge correctly called it. After all, with the S&P 500 having lost 10% of its value in just the past two weeks, simply goes to show how fast things can change when reckless monetary policy comes to an end, and all bubbles, real estate, bonds, and stocks, begin to burst.

Bond yields surged this week with the 10-year getting close to touching its highest point since April 2010. The US Dollar rose causing the British Pound to dive to its lowest point since February 1985. Ouch!

If you have not learned by now that there are times to be out of the market and on the sidelines, you should not read this blog. After all, I have been pounding on that theme for decades, namely that all good things, like artificially low interest rates, as well as Quantitative Easing (QE) programs, will have eventual consequences like inflation and subsequently surging interest rates, which is what we are seeing right now.

What could change the current scenario?

If the recession/depression gets so bad that the Fed will be forced to pivot and reverse its strategy from hawkish to dovish, that would pump some life not only into equities but will also worsen inflation. Right now, there is no good outcome other than avoiding further portfolio damage by being on the sidelines, so you can avoid participating in a scenario that gets worse, before it gets much worse.

There is a ‘lost generation’ of money managers out there, who have never seen a bear market and have only, throughout most of their careers, lived by the mantra that the Fed will bail them out via easy monetary policy, should markets decline by some 20%. That time is over, with ZeroHedge quoting the following:

Back in February 2020, the former Dallas Fed chief offered some more thoughts about Wall Street’s ‘lost generation’.

“The Fed has created this dependency and there’s an entire generation of money-managers who weren’t around in ’74, ’87, the end of the ’90s, and even 2007-2009… and have only seen a one-way street… of course they’re nervous.”

“The question is – do you want to feed that hunger? Keep applying that opioid of cheap and abundant money?”

Simply put, investors must be weaned off their dependency on a Fed put and accept the reality that the ‘wealth’ they thought they had was paper profits and not real.

Read More