
- Moving the markets
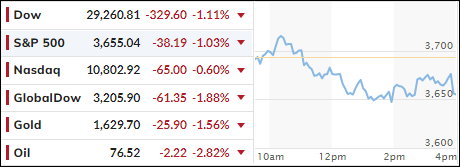
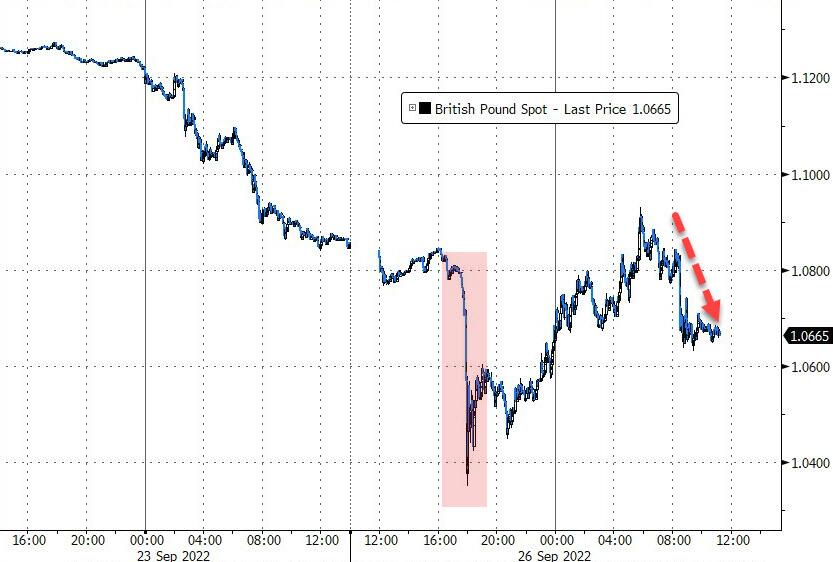
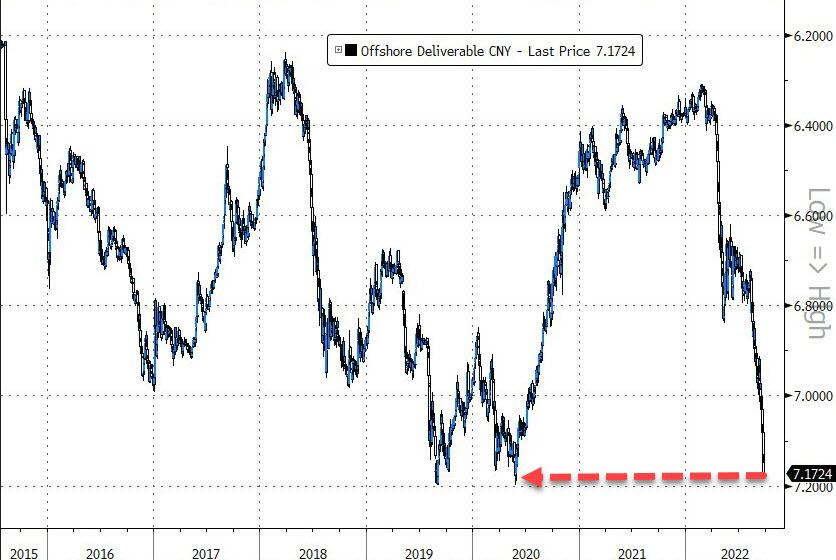
Equities took in on the chin again with the major indexes notching another loss, as interest rates rose among unrest in a variety of global currencies. The British Pound (BP) had at one point fallen 4% against the Dollar but came off its lows on rumors of the Bank of England having to raise more aggressively to battle inflation. Amazingly, the BP is now within striking distance of parity with the dollar, while the Yuan is heading towards all-time lows.
As the Fed has continued its aggressive hiking campaign, the US Dollar’s surge has ravaged many other currencies, most notably the Euro, which has now hit a low not seen since 2002.
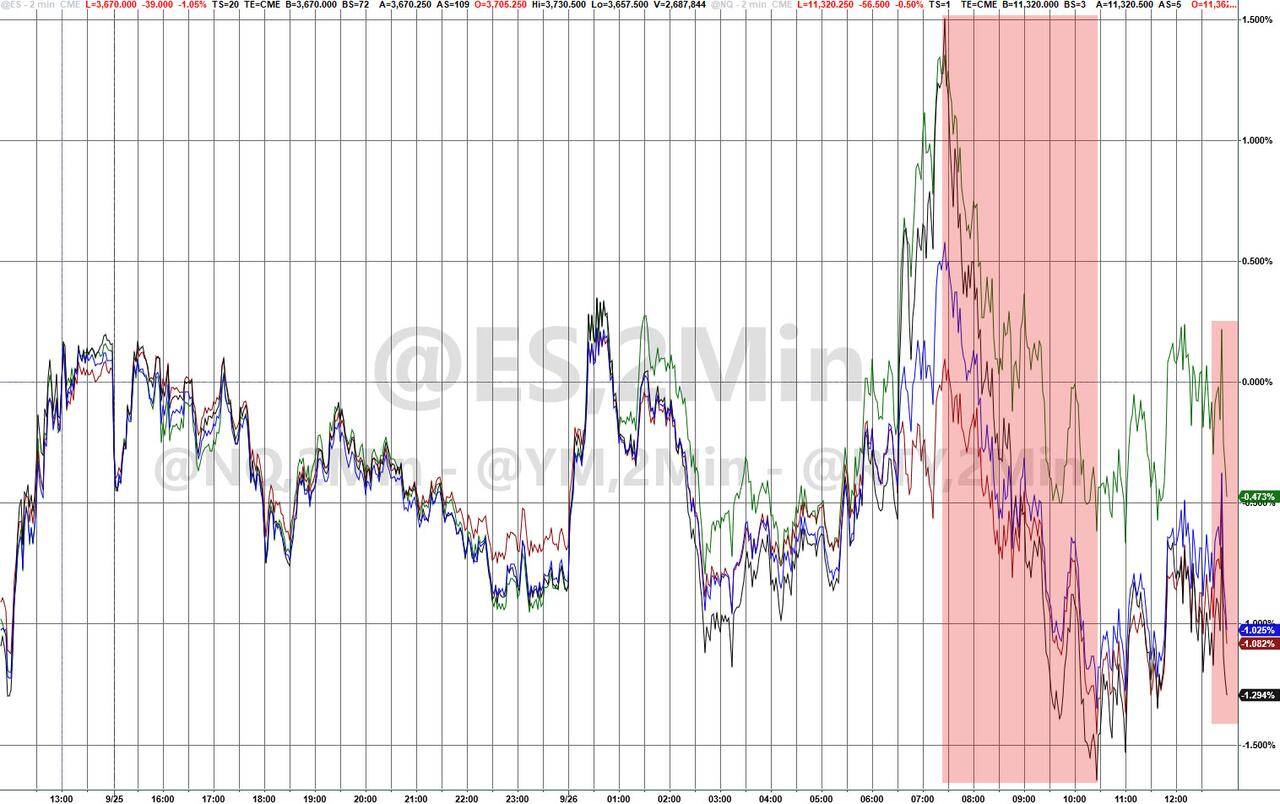
The S&P is homing in on the June lows and at one point briefly fell below that low point of the year, but the index closed slightly above it. Sometimes, those lows can serve as a support level for a rebound but, given the current economic and financial environment, I believe the odds of a breakthrough to lower prices are greater than a recovery.
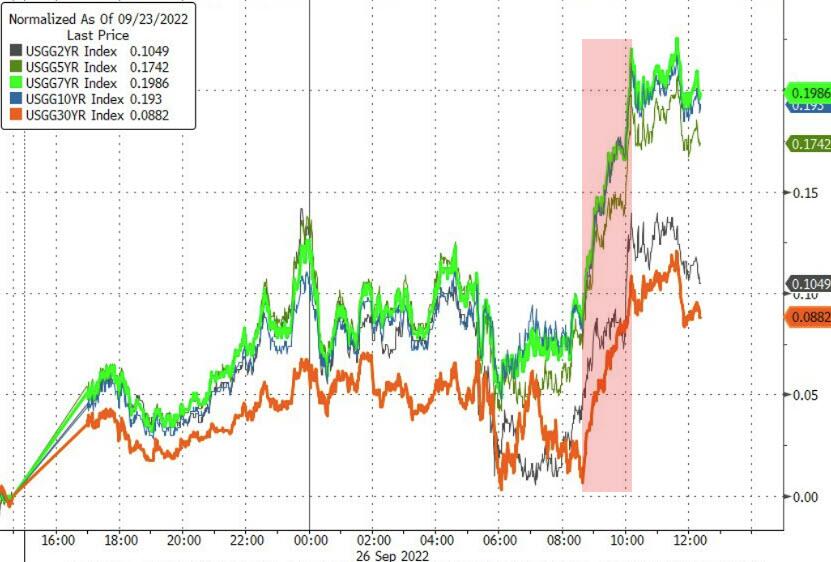
Supporting my view is the action in the bond markets where yields spiked with the 10-year topping 3.9% at one point during the session, which was its highest level since 2010. The 2-year yield, which is more aligned with Fed policy, surpassed 4.3%, as MarketWatch noted, the highest level since 2007.
After last week’s brutal spanking, the downward trend continues with stocks and bonds seemingly getting clobbered in sync, while Gold is being pushed down to invalidate it as an alternative investment, a condition that will not last forever. Even Crude Oil was not exempt from bearish forces and was pulled below the $80 level.
I will be out tomorrow to be able to fully “engage” with my scheduled colonoscopy (humor attempt), but I will return Wednesday for the market report.
2. ETFs in the Spotlight
In case you missed the announcement and description of this section, you can read it here again.
It features some of the 10 broadly diversified domestic and sector ETFs from my HighVolume list as posted every Saturday. Furthermore, they are screened for the lowest MaxDD% number meaning they have been showing better resistance to temporary sell offs than all others over the past year.
The below table simply demonstrates the magnitude with which these ETFs are fluctuating above or below their respective individual trend lines (%+/-M/A). A break below, represented by a negative number, shows weakness, while a break above, represented by a positive percentage, shows strength.
For hundreds of ETF choices, be sure to reference Thursday’s StatSheet.
For this closed-out domestic “Buy” cycle (2/24/2022), here’s how some of our candidates have fared. Keep in mind that our Domestic Trend Tracking Index (TTI) signaled a “Sell” on that date, which overrode the existing “Buys” shown for SPY and IYM:
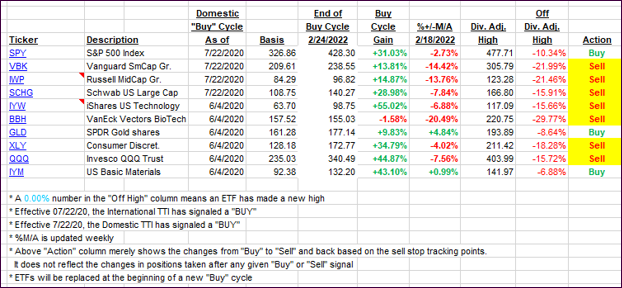
Click image to enlarge.
Again, the %+/-M/A column above shows the position of the various ETFs in relation to their respective long-term trend lines, while the trailing sell stops are being tracked in the “Off High” column. The “Action” column will signal a “Sell” once the -12% point has been taken out in the “Off High” column, which has replaced the prior -8% to -10% limits.
3. Trend Tracking Indexes (TTIs)
Our TTIs got spanked with the markets and are now deeply engrained in bear market territory.
This is how we closed 09/26/2022:
Domestic TTI: -12.47% below its M/A (prior close -11.18%)—Sell signal effective 02/24/2022.
International TTI: -16.30% below its M/A (prior close -14.77%)—Sell signal effective 03/08/2022.
Disclosure: I am obliged to inform you that I, as well as my advisory clients, own some of the ETFs listed in the above table. Furthermore, they do not represent a specific investment recommendation for you, they merely show which ETFs from the universe I track are falling within the specified guidelines.
All linked charts above are courtesy of Bloomberg via ZeroHedge.
Contact Ulli