
ETF Tracker StatSheet
You can view the latest version here.
A BRUTAL MONTH ENDS WITH ANOTHER DIVE
- Moving the markets
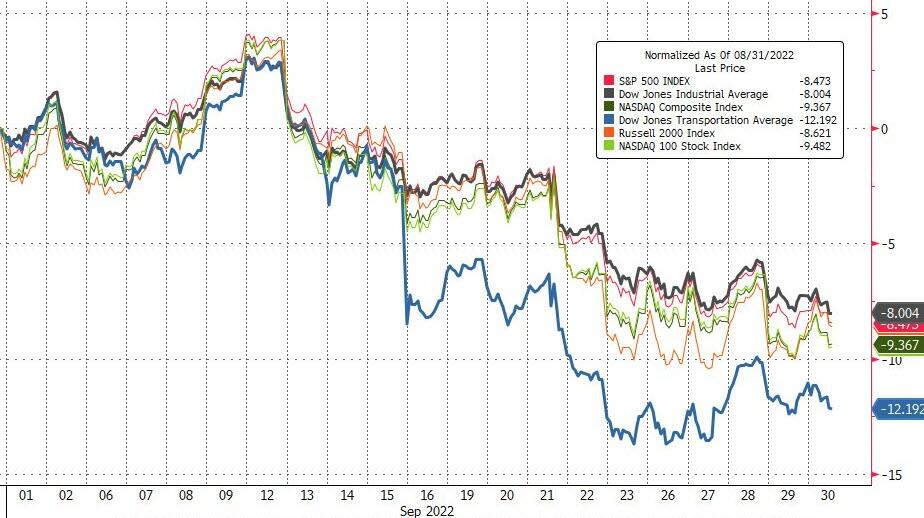
The jury is now out that this has been the worst September for stocks since 2008. That’s a big ouch for those still believing the farce of buying and holding forever by not recognizing when major trends have changed from bullish to bearish.
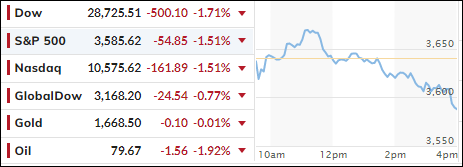
Despite an early hopeful bounce, the major indexes reversed and hit the skids today, as if to add more insult to injury during this last trading day of the month. The final numbers are simply daunting.
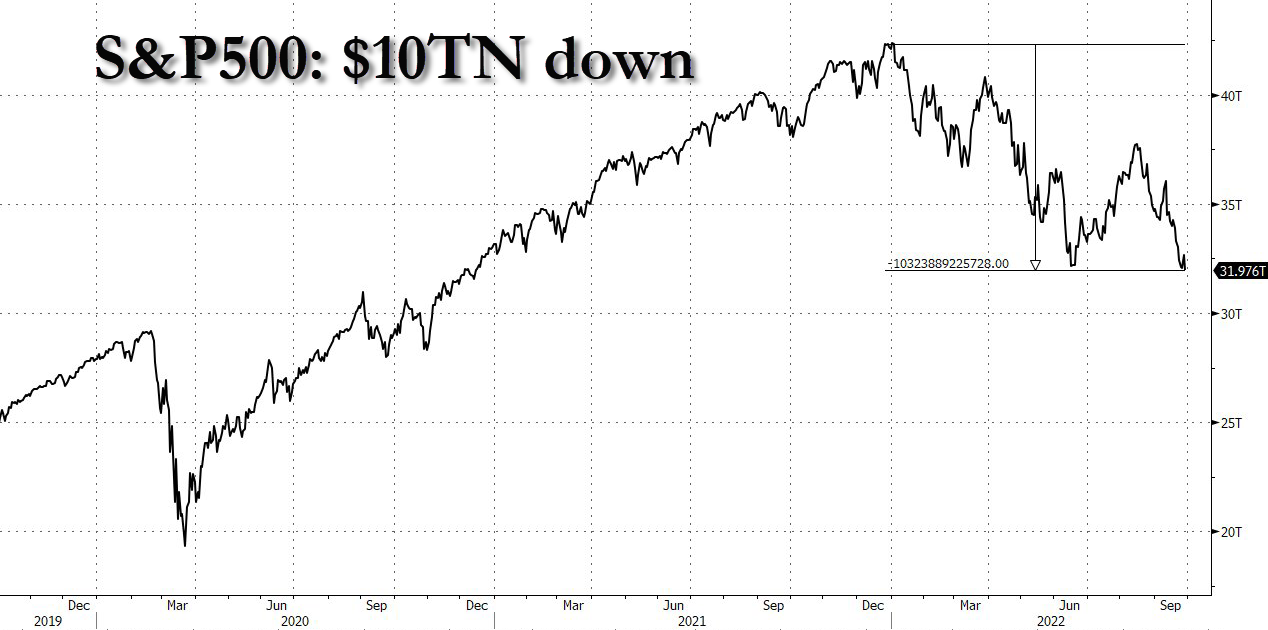
Looking at the widely held barometer, the S&P 500, the index simply got clobbered, no matter which time frame you look at. For the week it is down -2.9%, for the month it got hammered -9.3%, and for the quarter it lost -5.3%.
Individual stocks got spanked as well, with the latest victim being Nike, which “experienced” an unexpected inventory surge, that dropped its stock almost 13% on concerns of consumers’ ability to continue spending as inflation worsens.
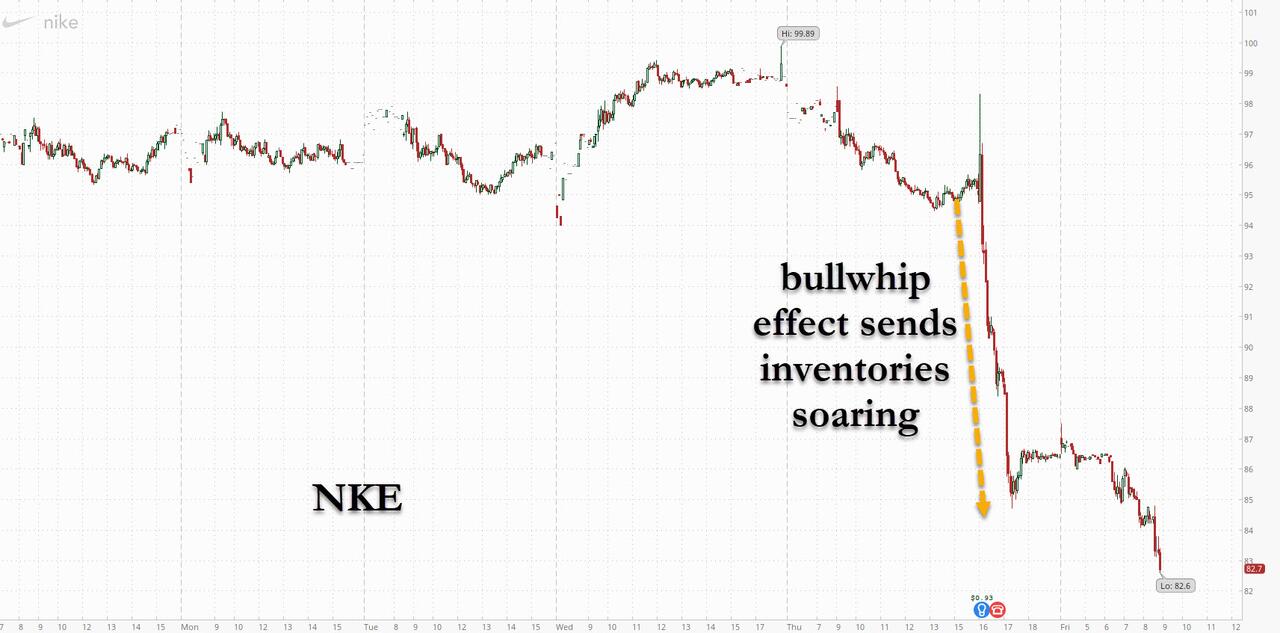
That became apparent, as the Fed’s favorite inflation indicator unexpectedly surged with personal spending jumping, which killed the idea that, despite the US economy sliding into a recession and global markets ‘turmoiling,’ inflation would finally relent, as ZeroHedge opined.
Global bond markets stumbled as well, as US bond yields continued to be the wrecking ball of equities; not just during September but also since the June lows, as the much hoped for Fed pivot turned out to be nothing but a pipe dream—so far.
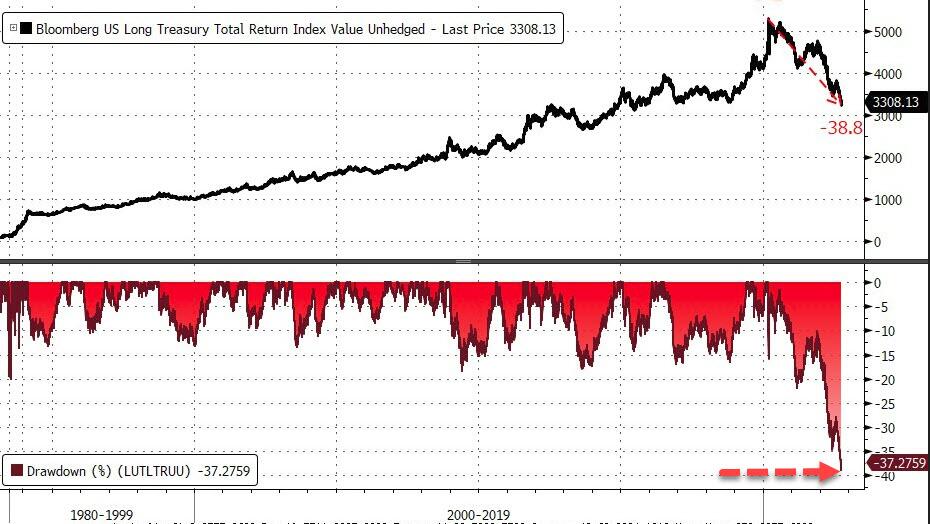
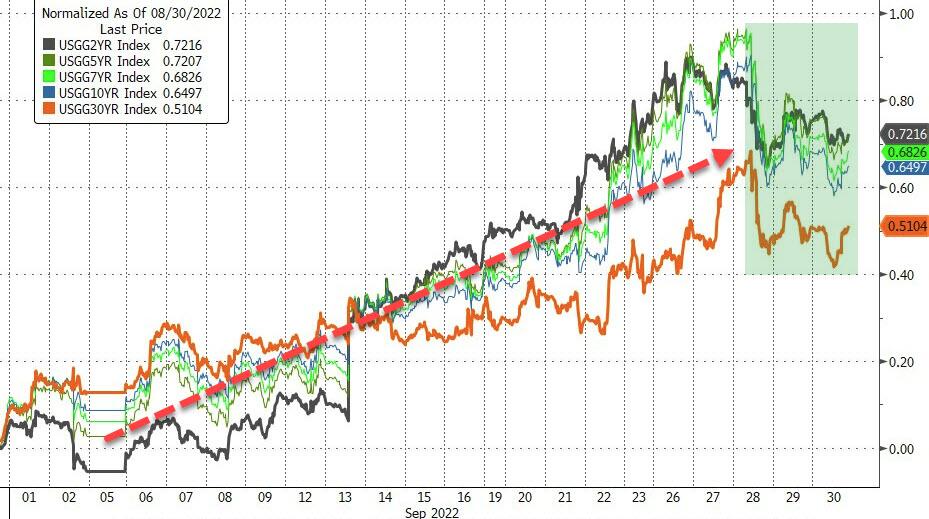
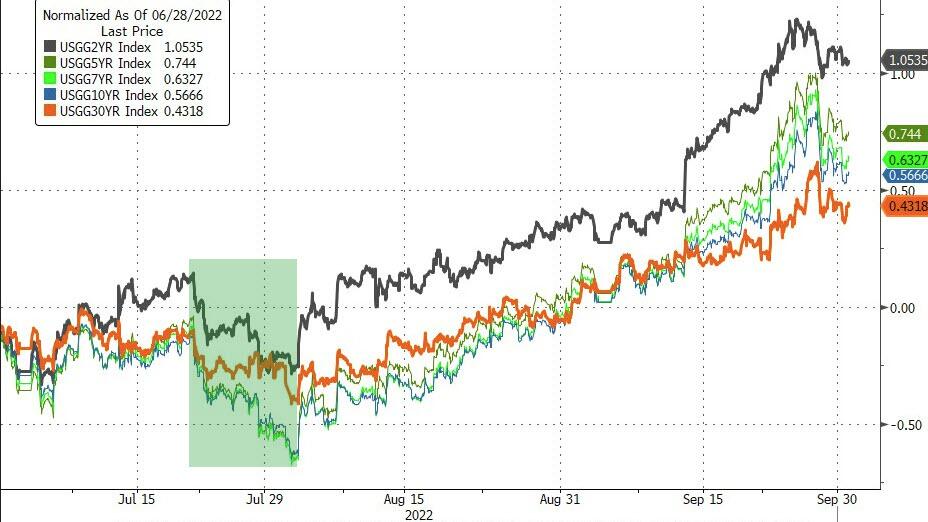
Added ZeroHedge:
Q3 is the 3rd quarter in a row during which a ‘balanced’ stock/bond portfolio lost money (if it wasn’t for July’s gains, this would have been the worst quarter ever for a stock/bond portfolio)
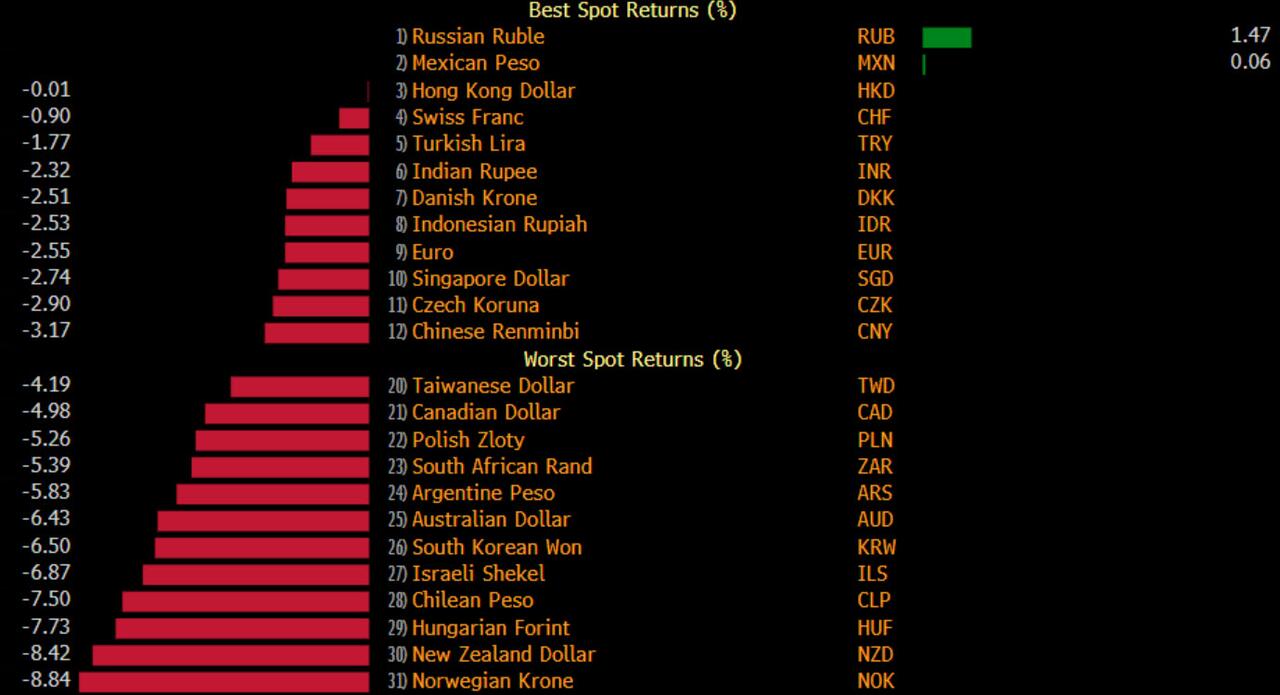
The US Dollar advanced for the 4th straight month, as most fiat currencies got clobbered with the exception of the Russian Ruble, which was the best performer.
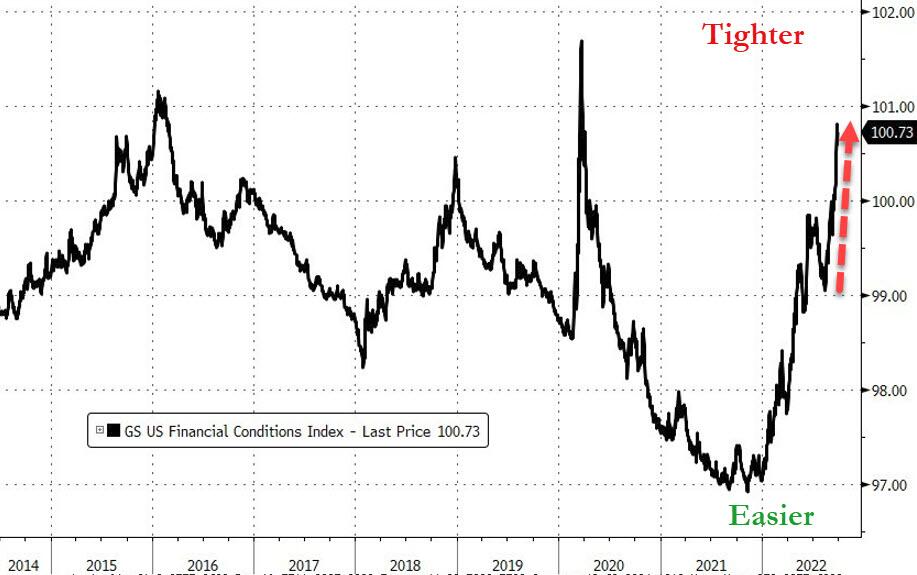
Financial conditions have tightened, and it looks to me that volatility and consequently lower equity prices will be with us a lot longer, unless the earnings season turns into a blowout event, or Fed head Powell indicates that a “pivot” could be in the cards.
What are the odds?
2. ETFs in the Spotlight
In case you missed the announcement and description of this section, you can read it here again.
It features some of the 10 broadly diversified domestic and sector ETFs from my HighVolume list as posted every Saturday. Furthermore, they are screened for the lowest MaxDD% number meaning they have been showing better resistance to temporary sell offs than all others over the past year.
The below table simply demonstrates the magnitude with which these ETFs are fluctuating above or below their respective individual trend lines (%+/-M/A). A break below, represented by a negative number, shows weakness, while a break above, represented by a positive percentage, shows strength.
For hundreds of ETF choices, be sure to reference Thursday’s StatSheet.
For this closed-out domestic “Buy” cycle (2/24/2022), here’s how some of our candidates have fared. Keep in mind that our Domestic Trend Tracking Index (TTI) signaled a “Sell” on that date, which overrode the existing “Buys” shown for SPY and IYM:
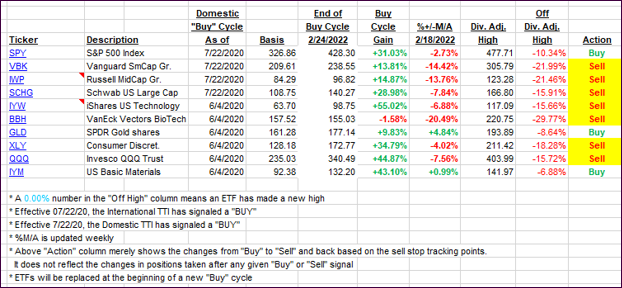
Click image to enlarge.
Again, the %+/-M/A column above shows the position of the various ETFs in relation to their respective long-term trend lines, while the trailing sell stops are being tracked in the “Off High” column. The “Action” column will signal a “Sell” once the -12% point has been taken out in the “Off High” column, which has replaced the prior -8% to -10% limits.
3. Trend Tracking Indexes (TTIs)
Our TTIs slipped again and are maintaining their deeply bearish position.
This is how we closed 09/30/2022:
Domestic TTI: -12.86% below its M/A (prior close -12.41%)—Sell signal effective 02/24/2022.
International TTI: -16.76% below its M/A (prior close -16.52%)—Sell signal effective 03/08/2022.
Disclosure: I am obliged to inform you that I, as well as my advisory clients, own some of the ETFs listed in the above table. Furthermore, they do not represent a specific investment recommendation for you, they merely show which ETFs from the universe I track are falling within the specified guidelines.
All linked charts above are courtesy of Bloomberg via ZeroHedge.
———————————————————-
WOULD YOU LIKE TO HAVE YOUR INVESTMENTS PROFESSIONALLY MANAGED?
Do you have the time to follow our investment plans yourself? If you are a busy professional who would like to have his portfolio managed using our methodology, please contact me directly to get more details.
Contact Ulli