
- Moving the markets
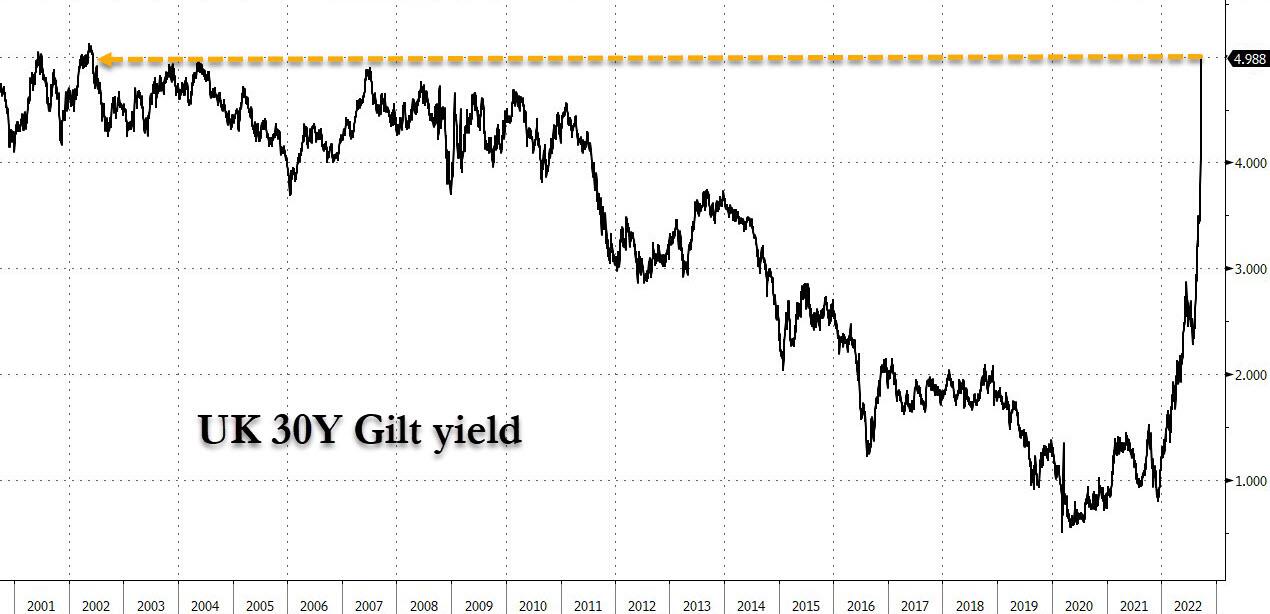
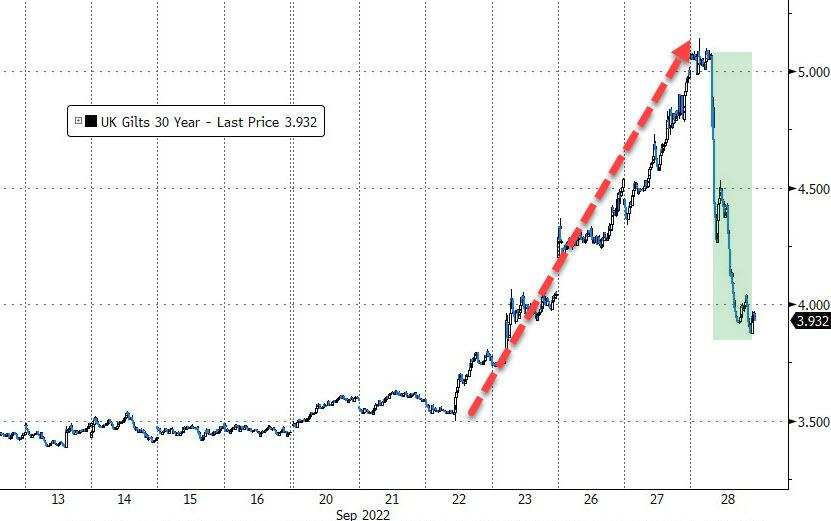
After yesterday’s breakdown in the UK Gilt (bond) market, during which the 30-year gilt rose above 5%, a level not seen since 2002, according to ZeroHedge, the Bank of England capitulated today and reversed course, AKA they pivoted from hawkish to dovish.
It recognized “significant dysfunction” in the bond market and “material risk” to financial stability by pivoting from QT (Quantitative Tightening) to QE (Quantitative Easing) by “carrying out temporary purchases of long-dated UK government bonds.” The result was interest rates coming off yesterday’s highs, a move that stimulated the bullish crowd and ramped up equities around the world.
While pondering what this all means, ZeroHedge summed it up succinctly:
Pivot means that central banks can’t take any more pain and will soon do QE and rate hikes at the same time everywhere, eventually ending hiking and starting to cut rates – the bottom line is that this is the beginning of the end for the fiat system which now faces a terminal dilemma: fight inflation and suffer market collapse and economic depression with millions laid off, or push to stabilize social order and employment with higher asset prices, runaway (hyper)inflation be damned.
The assumption now is, despite Fed evidence to the contrary, that all Central Banks will “fold and follow,” thereby ending the much-despised act of hiking rates and bringing back the main equity driver in form of rate reductions. That’s what Wall Street had been hoping for all along, but it remains to be seen if or when the Fed follows suit, which is the big unknown. If they fold now, their reputation will take another hit, as a surge in hyper-inflation will be the unavoidable result.
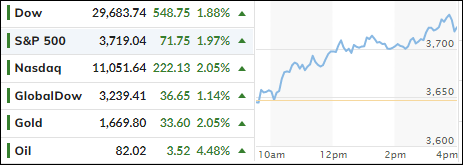
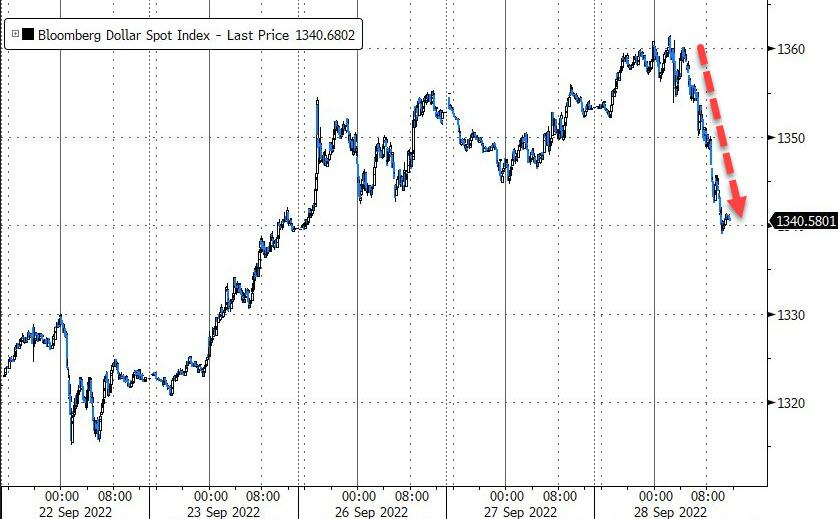
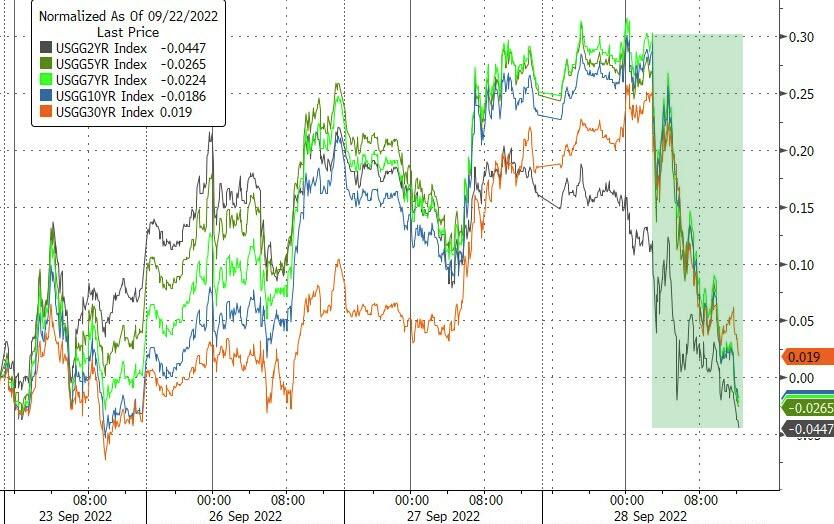
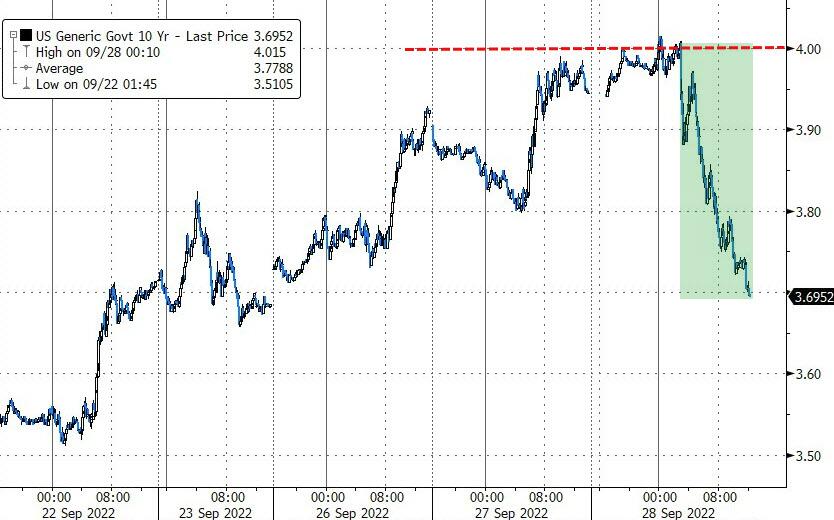
Helping today’s rebound was a sharp sell-off in the US Dollar, which helped gold to gain some 2%. Then Bond yields cratered, with the 10-year dropping almost 22 bps to close at 3.73%, after conquering the 4% level intra-day, which gave a much needed assist to equities. This was the biggest daily drop in 10-year yields since 2009, as ZeroHedge reported.
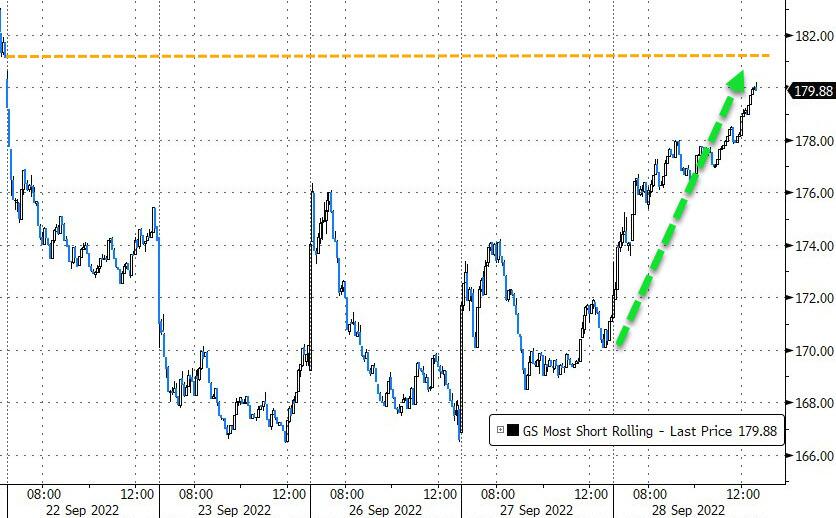
And, of course, no rally is worth mentioning, unless it’s accompanied by a short squeeze, and today we saw a massive one. The bulls were happy, although in terms of leaving bear market territory behind, we a have a long way to go (section 3).
2. ETFs in the Spotlight
In case you missed the announcement and description of this section, you can read it here again.
It features some of the 10 broadly diversified domestic and sector ETFs from my HighVolume list as posted every Saturday. Furthermore, they are screened for the lowest MaxDD% number meaning they have been showing better resistance to temporary sell offs than all others over the past year.
The below table simply demonstrates the magnitude with which these ETFs are fluctuating above or below their respective individual trend lines (%+/-M/A). A break below, represented by a negative number, shows weakness, while a break above, represented by a positive percentage, shows strength.
For hundreds of ETF choices, be sure to reference Thursday’s StatSheet.
For this closed-out domestic “Buy” cycle (2/24/2022), here’s how some of our candidates have fared. Keep in mind that our Domestic Trend Tracking Index (TTI) signaled a “Sell” on that date, which overrode the existing “Buys” shown for SPY and IYM:
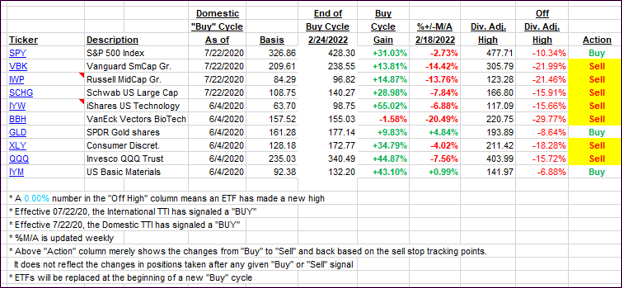
Click image to enlarge.
Again, the %+/-M/A column above shows the position of the various ETFs in relation to their respective long-term trend lines, while the trailing sell stops are being tracked in the “Off High” column. The “Action” column will signal a “Sell” once the -12% point has been taken out in the “Off High” column, which has replaced the prior -8% to -10% limits.
3. Trend Tracking Indexes (TTIs)
Our TTIs finally closed higher after having been hammered for weeks. Only time will tell if this was just another dead-cat bounce.
This is how we closed 09/28/2022:
Domestic TTI: -10.72% below its M/A (prior close -12.75%)—Sell signal effective 02/24/2022.
International TTI: -15.41% below its M/A (prior close -16.48%)—Sell signal effective 03/08/2022.
Disclosure: I am obliged to inform you that I, as well as my advisory clients, own some of the ETFs listed in the above table. Furthermore, they do not represent a specific investment recommendation for you, they merely show which ETFs from the universe I track are falling within the specified guidelines.
All linked charts above are courtesy of Bloomberg via ZeroHedge.
Contact Ulli