
- Moving the markets
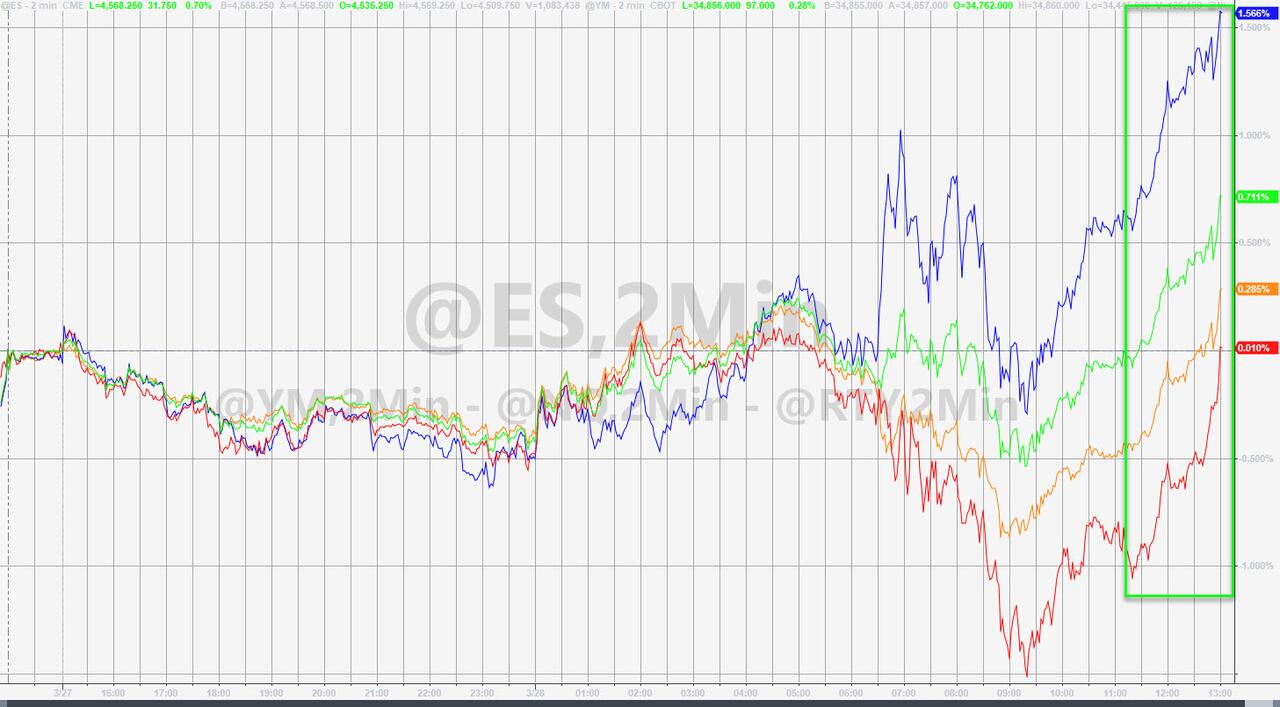
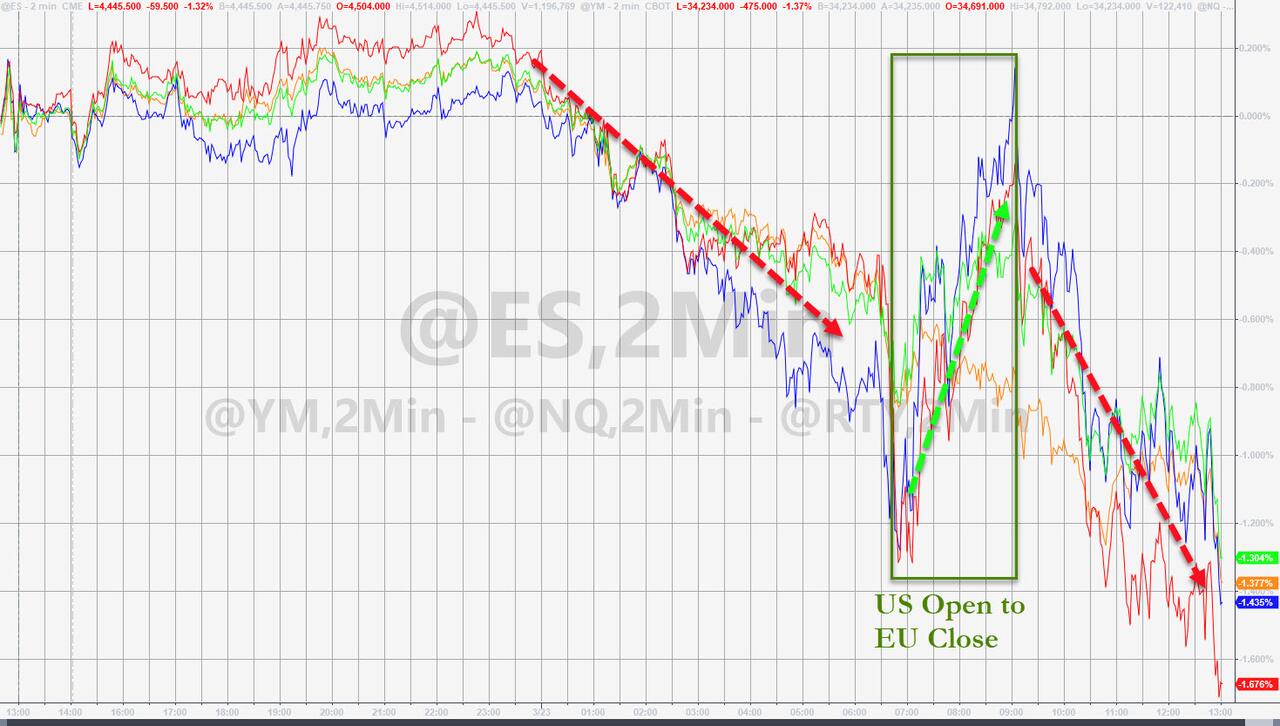
An early drop in the markets found a bottom and suddenly reversed after the Financial Times posted an article claiming this:
Russia is no longer requesting Ukraine be “denazified” and is prepared to let Kyiv join the European Union if it remains militarily non-aligned as part of ongoing ceasefire negotiations.
The draft ceasefire document does not contain any discussion of three of Russia’s initial core demands – “denazification”, “demilitarisation”, and legal protection for the Russian language in Ukraine.
Added ZH: And the market seems to be happy that the nazis can stay?
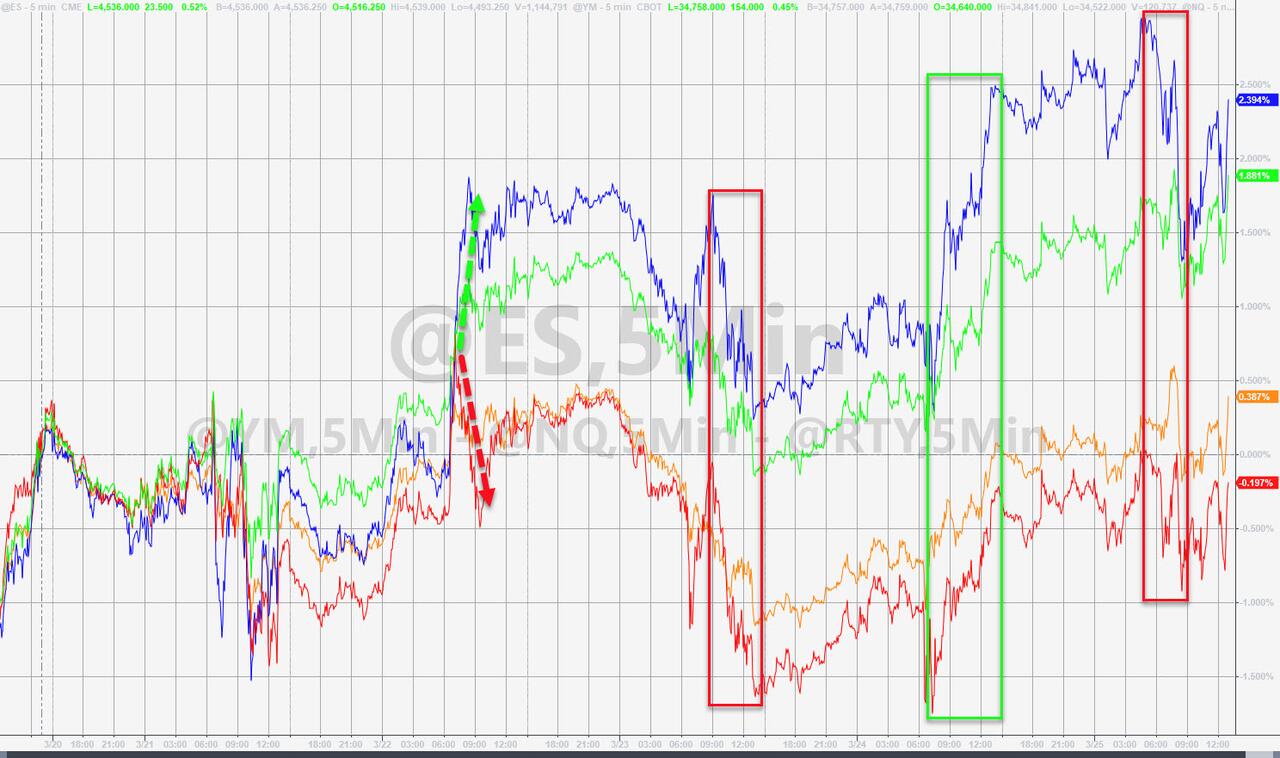
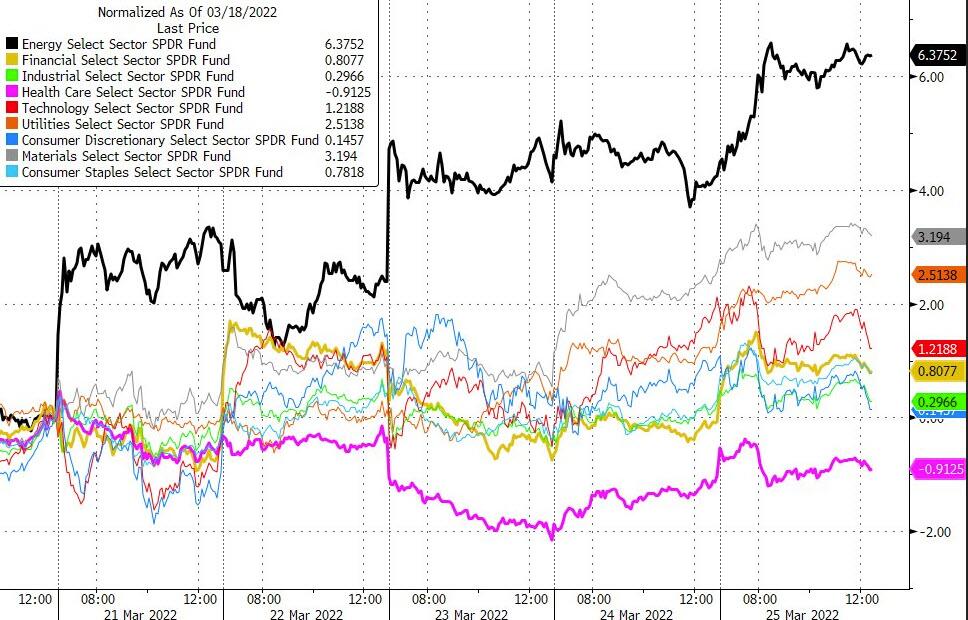
Whether this claim will hold up or not is immaterial, because the markets saw it as positive and the “digging out of a hole” process began with the major indexes closing in the green. The lead dog was the Nasdaq with +1.13%, as traders simply ignored recession fears, while the other two showed only modest gains.
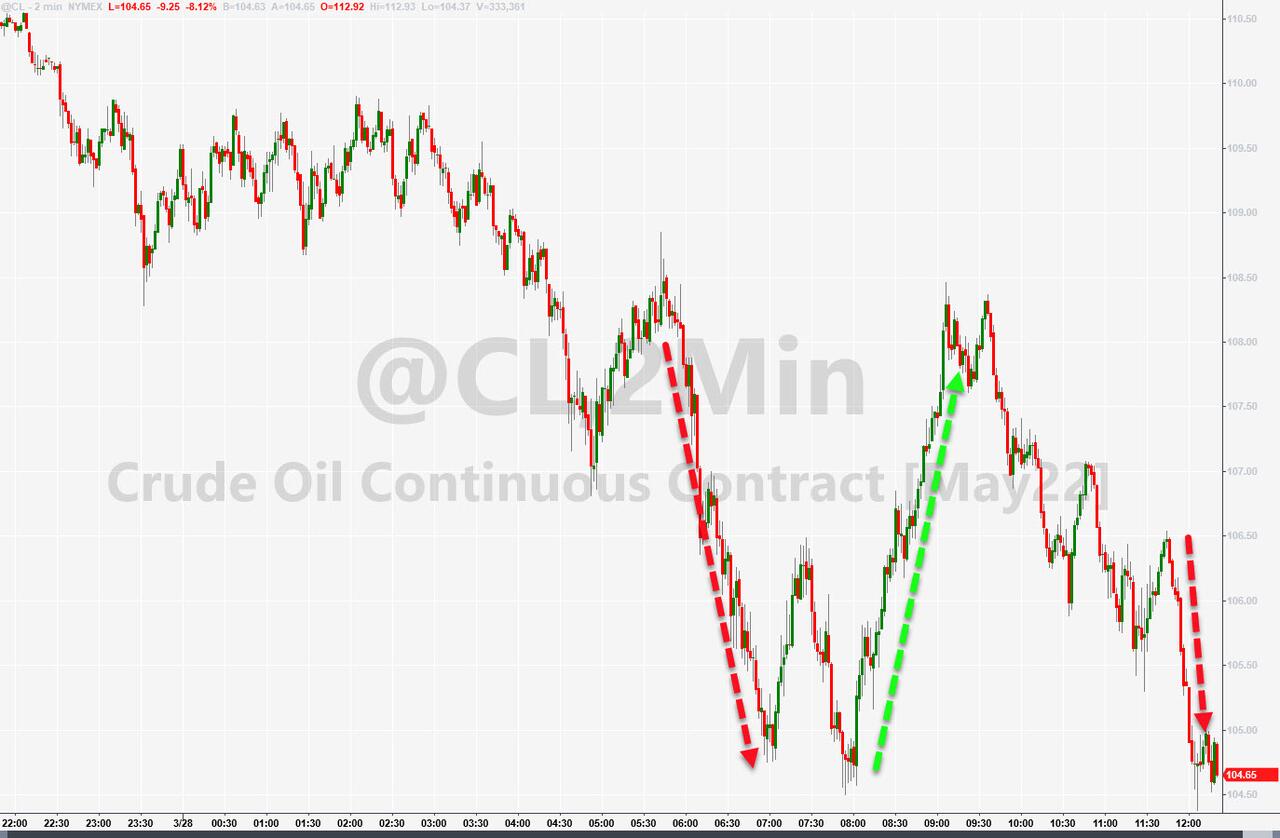
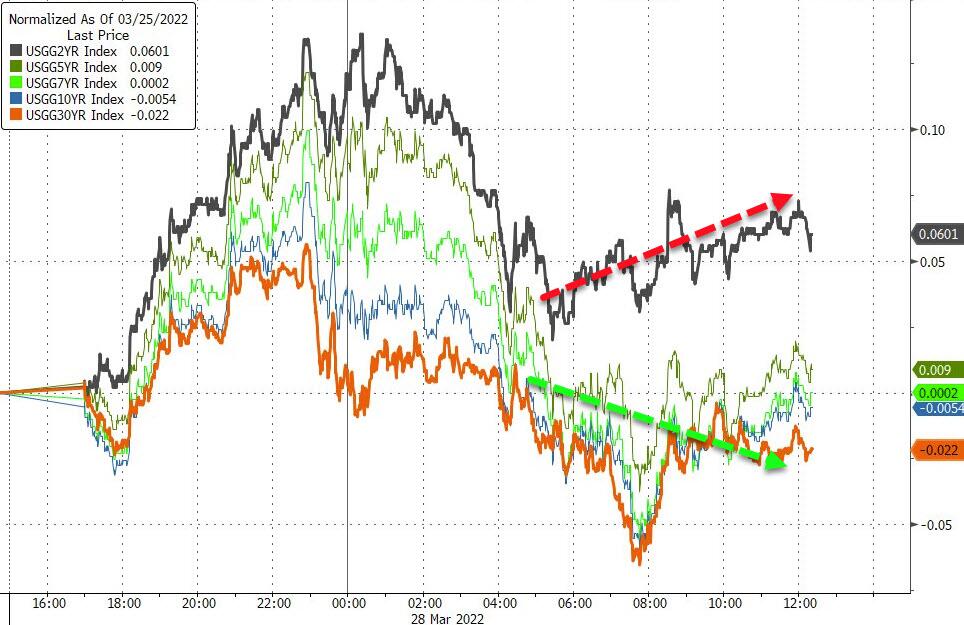
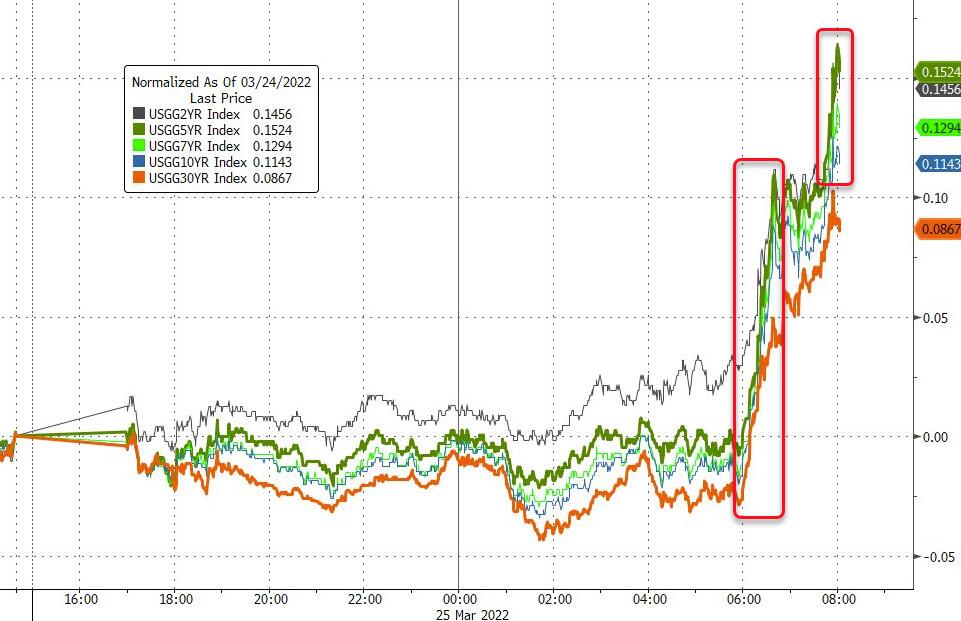
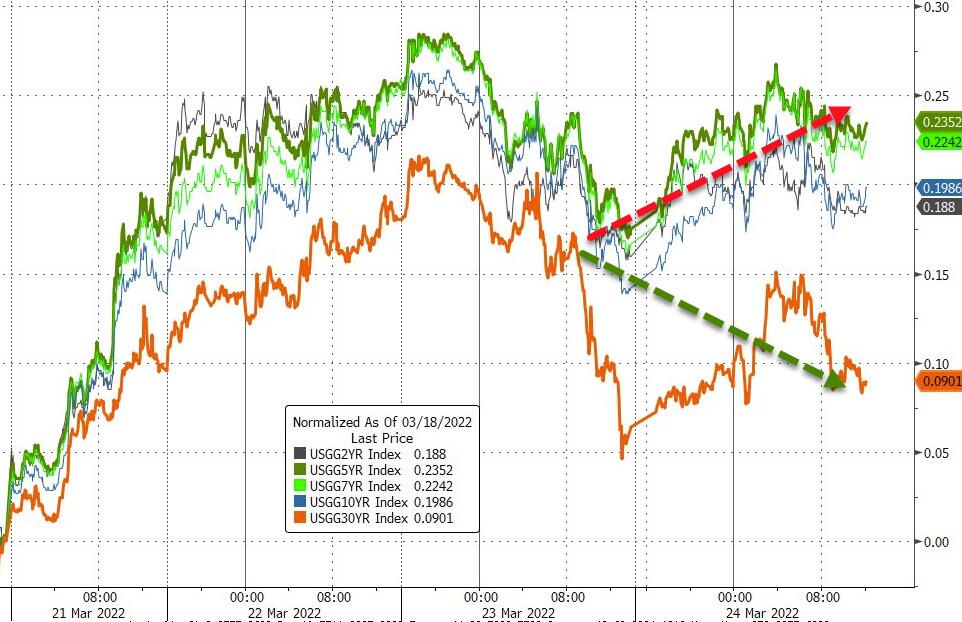
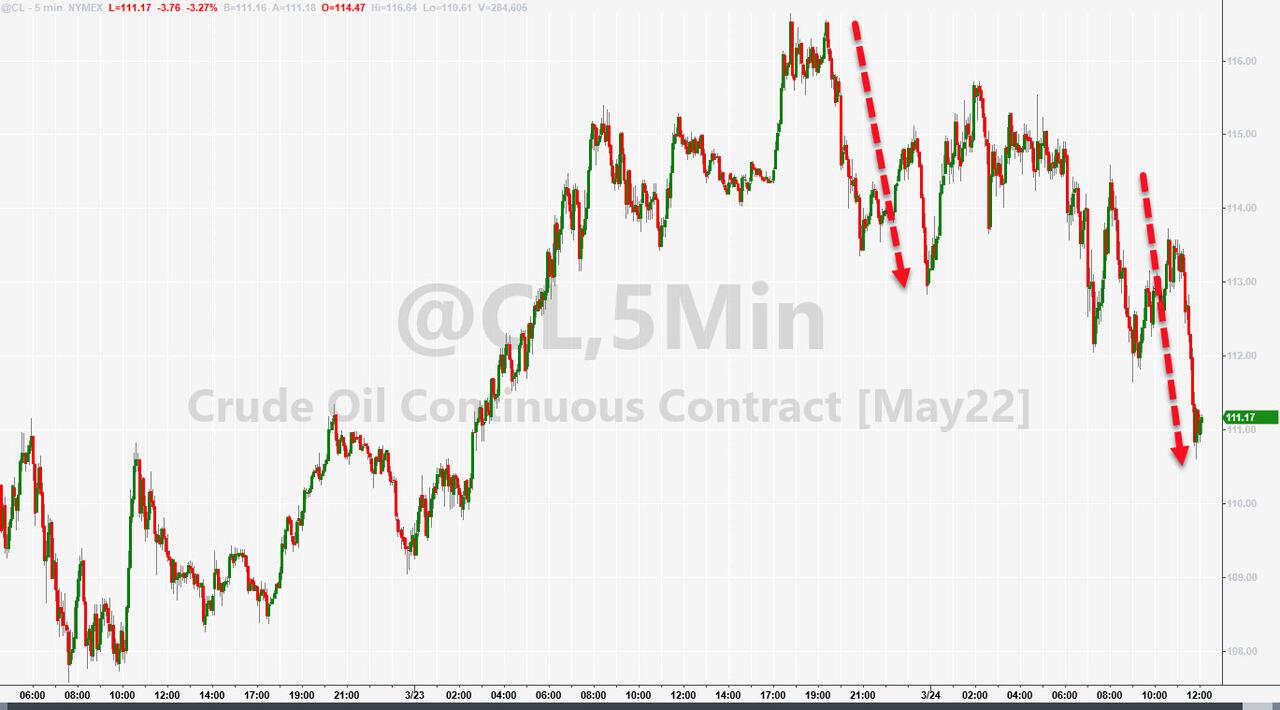
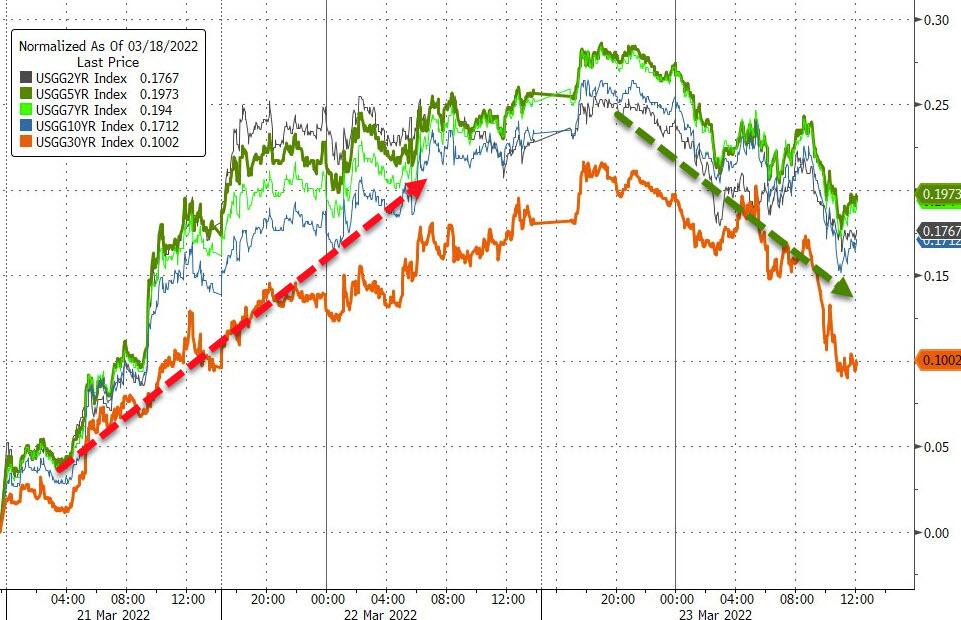
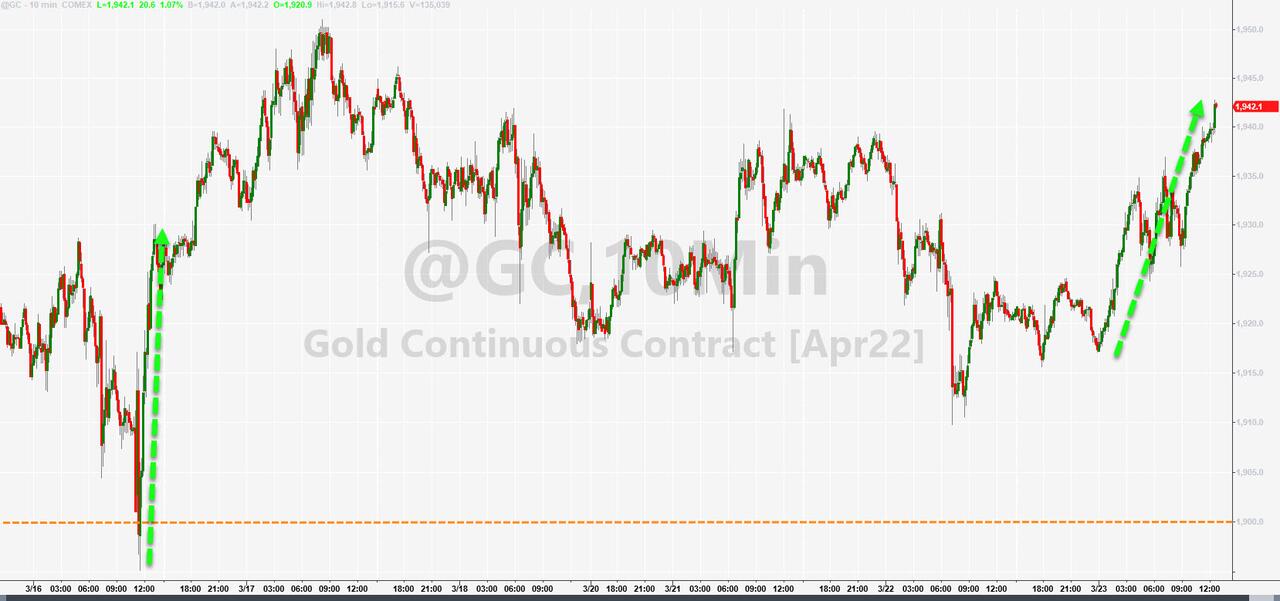
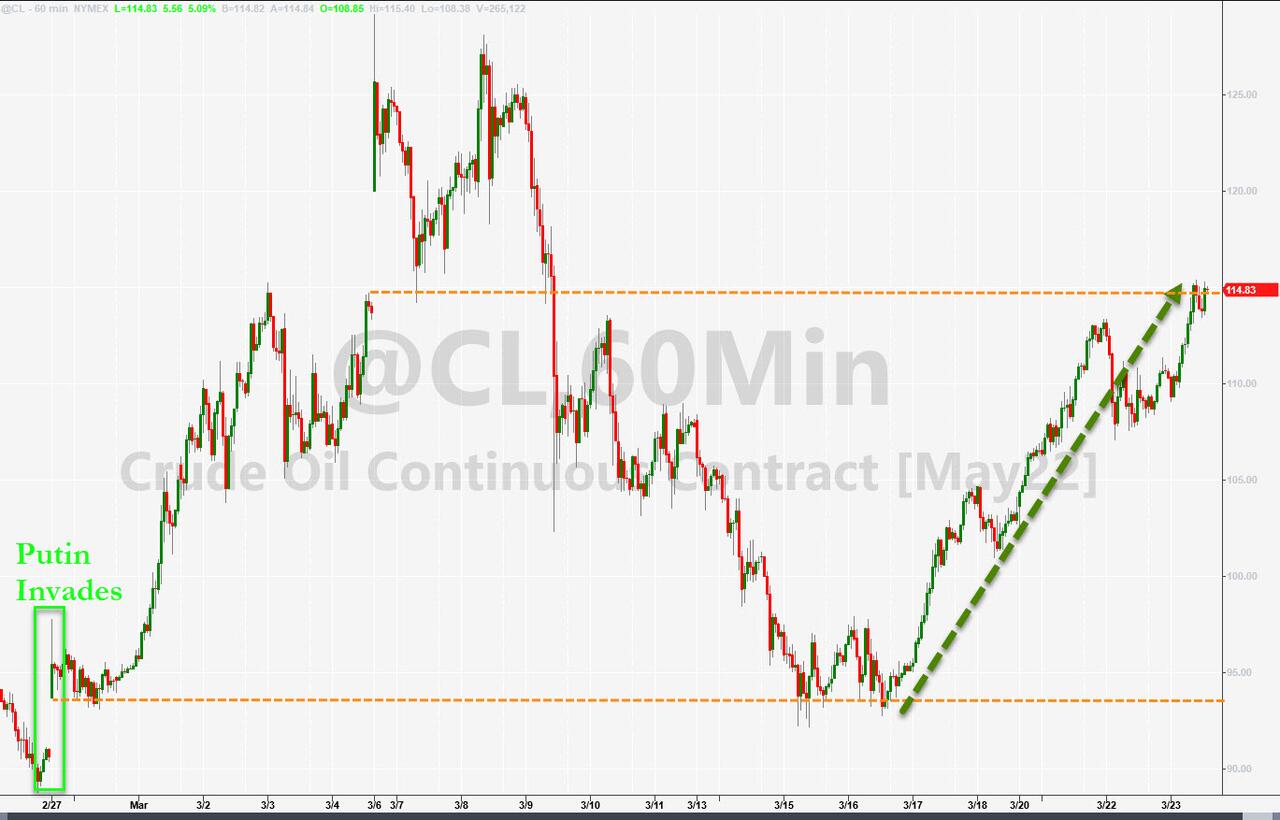
Nevertheless, this turnaround pushed Crude Oil, the Energy sector and Gold lower, while bond yields fell modestly.
Analyst Edward Moya added these words of wisdom:
Geopolitical risks remain very elevated and the rally in equities over the past two weeks is impressive. The U.S. economy is still in good shape but buying every stock market dip probably won’t be the attitude for most traders going forward given how hawkish the Fed has turned.
That’s my sentiment exactly, because if the Fed is truly serious in its inflation fighting efforts via higher interest rates, the days for the stock market bulls are numbered. However, if the Fed caves again in its hiking efforts, as the bears take the upper hand, we may see a reversal in policy just like in late 2018, after which the bull market continued with full force.
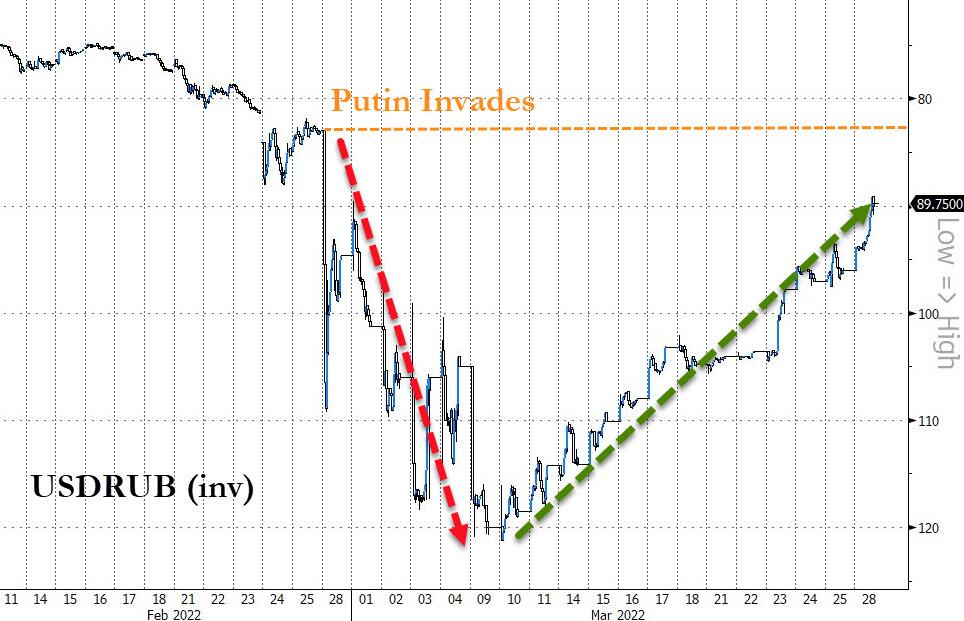
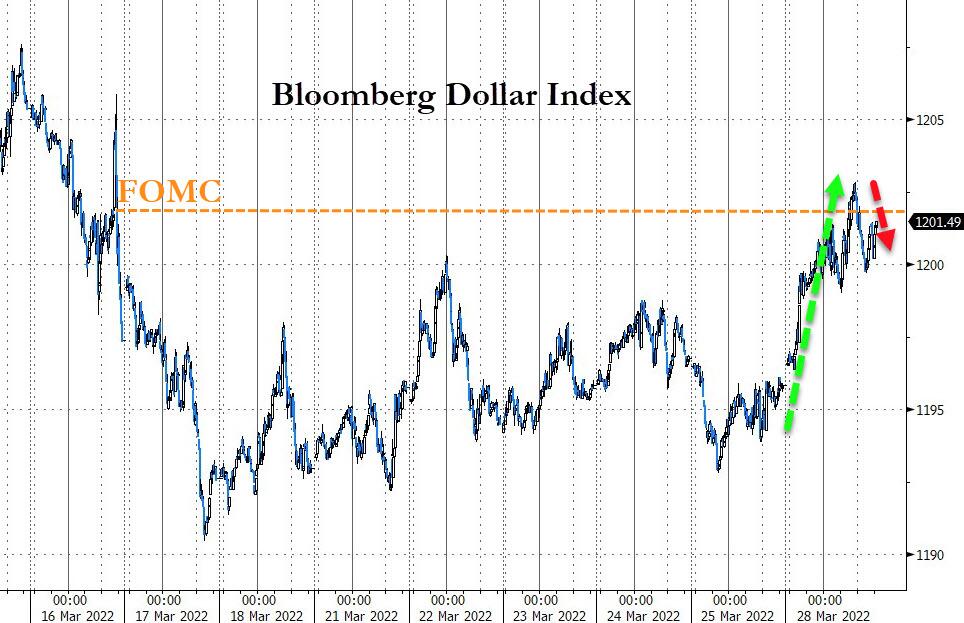
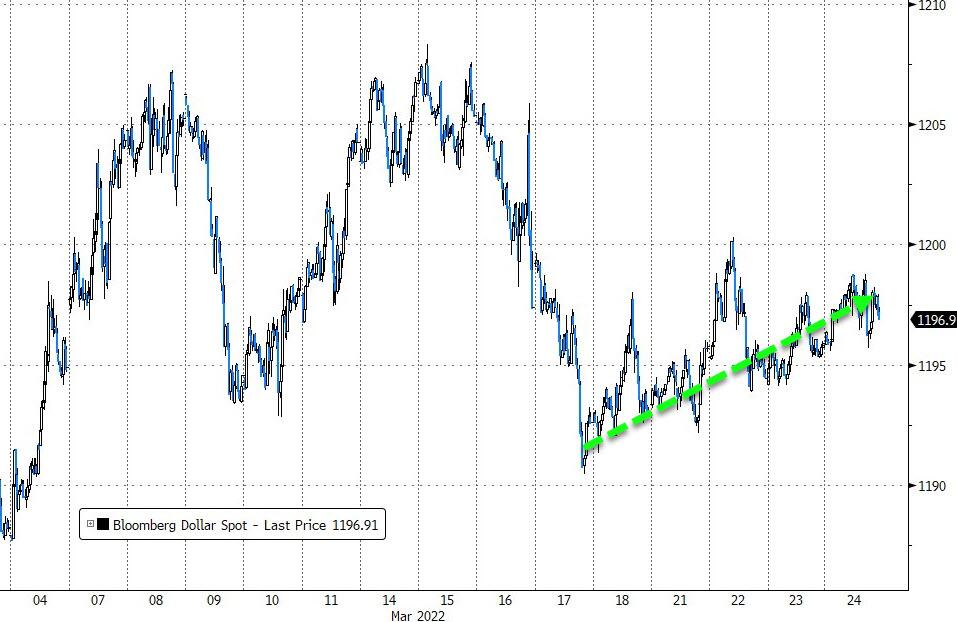
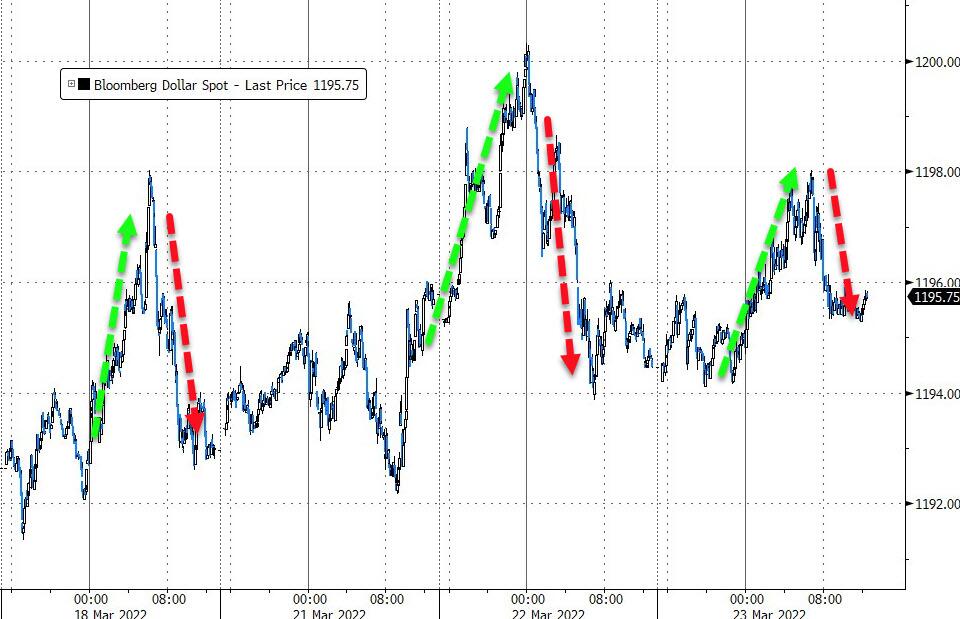
It’s interesting to note that the Russian Ruble, which got hammered into oblivion, finally stopped the bleeding, reversed course and almost wiped out all “invasion” gains. The US Dollar came back to life and rallied to 2-week highs.
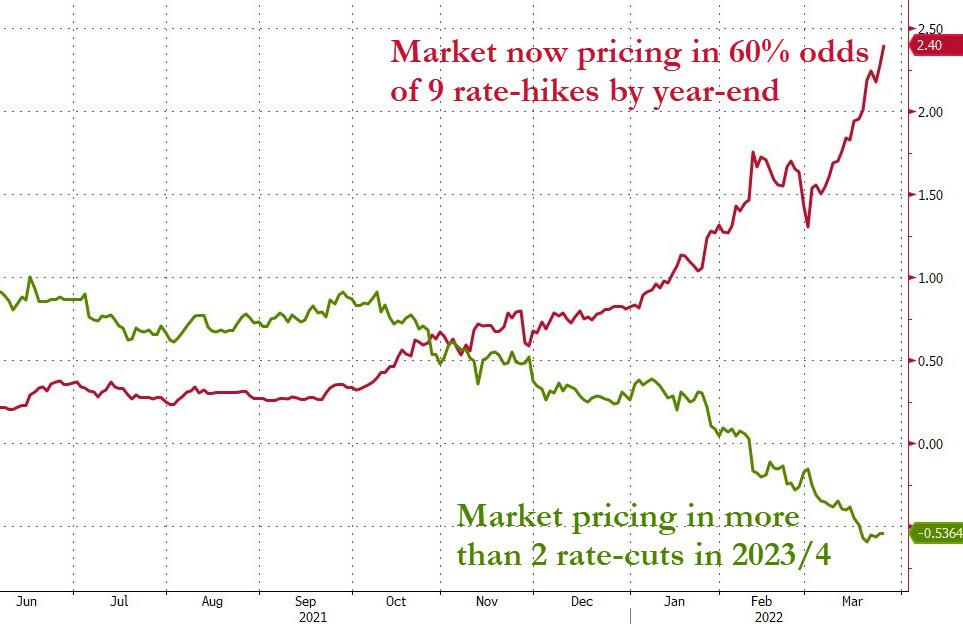
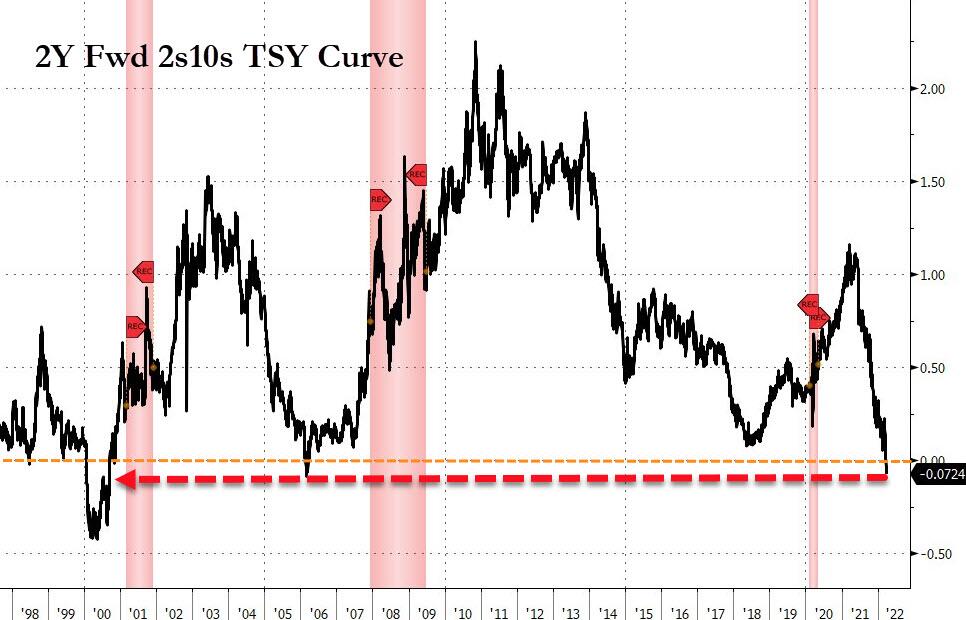
What is most incredible, as ZeroHedge pointed out, is that the market is now pricing in 9 more rate hikes in 2022, which the market sees a guaranteeing a recession…and therefore the market is pricing in almost 3 rate cuts in 2023/24.
That’s why you are seeing the current rally not running out of steam—yet.
Read More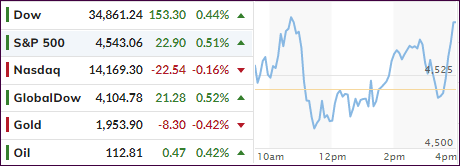
