
ETF Tracker StatSheet
You can view the latest version here.
A TURBULENT DAY CLOSES OUT A TURBULENT WEEK
- Moving the markets
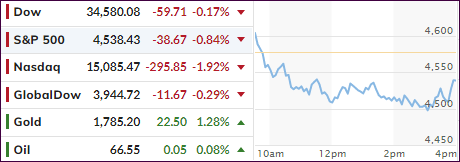
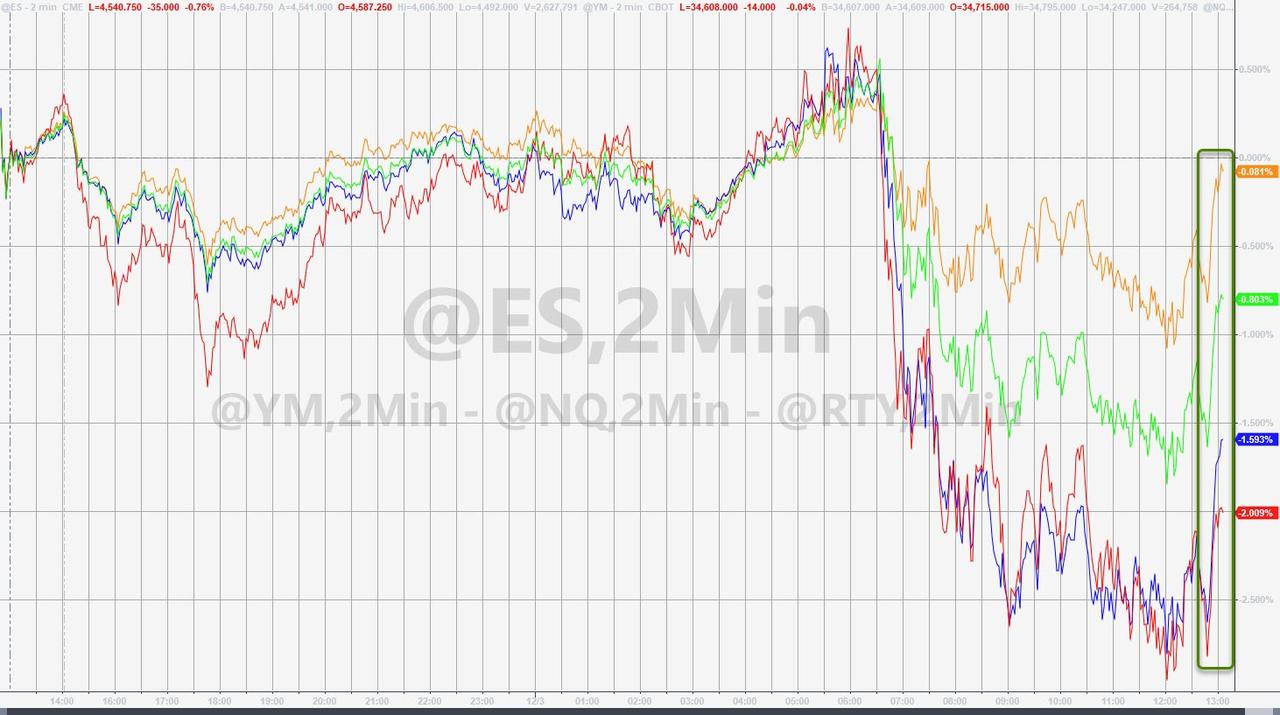
After yesterday’s comeback move, the markets went back into “survival mode,” with the major indexes tanking throughout the day but being somewhat rescued by a last hour rebound attempt.
The indicators still closed in the red but off their mid-day lows. Despite that bounce back, the Nasdaq was the whipping boy du jour and lost almost 2% during today’s dump-a-thon.
Several news items contributed and capped off a turbulent week, but the broadly based S&P 500 only surrendered some 0.5%, while the other two indexes fared worse. Causing this ripple effect were continued Omicron concerns, even thought the physicians discovering this variant only reported mild effects.
Be that as it may, the more immediate downer was the disappointing November jobs report, which showed that only a meager 210k new jobs were created. That is less than half of the expected 573k that economists had forecast. Still, it shows that October’s strong report may have been an outlier.
The good news was that the unemployment rate fell sharply to 4.2%, which was quite an improvement over the estimate of 4.5%. But concerns linger that the economy is struggling due to the ongoing supply chain crisis and the battle with rising inflation, neither of which will be resolved in the short term.
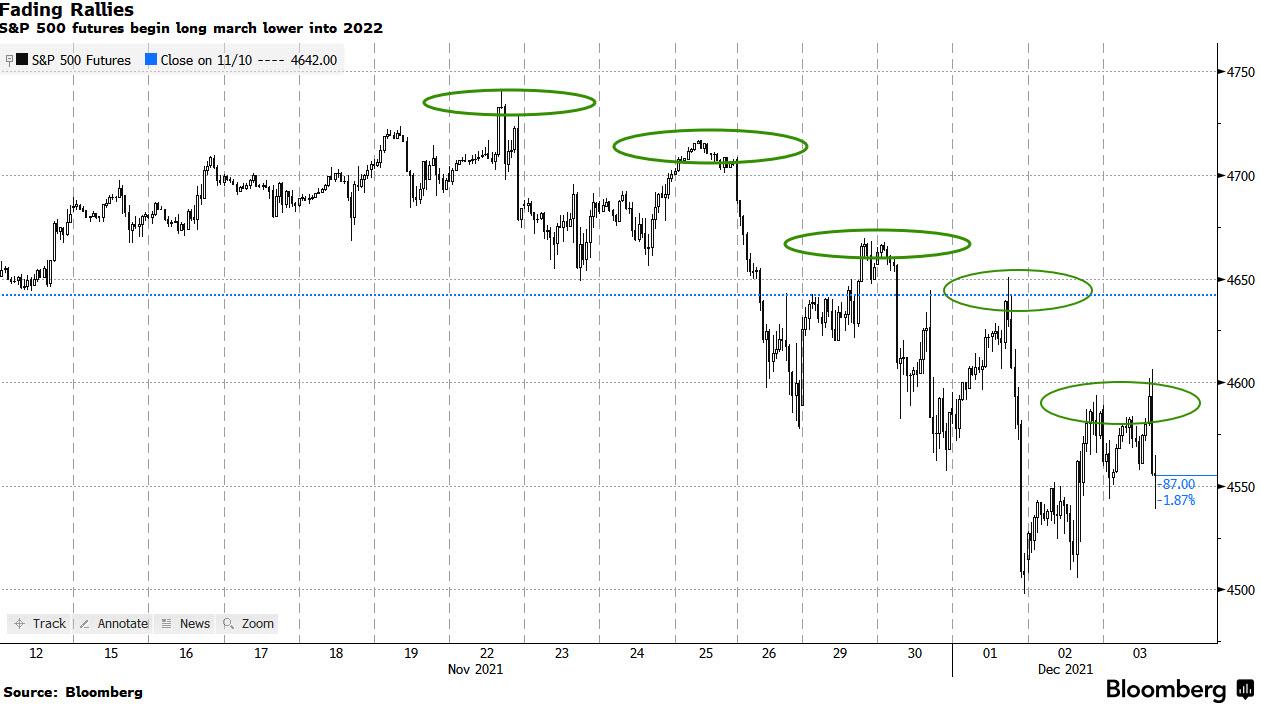
Looking at the market action over the past 5 weeks, it becomes clear that weakness and rebound rallies consisting of less and less magnitude may be signaling a directional turnaround. Bloomberg demonstrated that with this chart showing fading rallies, despite traders being convinced that a Santa Claus rally still lurks on deck.
However, wishful thinking does not create a successful outcome, as our International TTI has already slipped into bear market territory, although by only a fraction.
However, the Domestic TTI is now also rapidly approaching a potential break of its trend line to the downside (section 3 below). Given the bubble territory the equity markets are in, they appear to me like a bug in search of a windshield.
If that collision happens, we need to brace for impact by following our exit strategy to the latter.
2. ETFs in the Spotlight
In case you missed the announcement and description of this section, you can read it here again.
It features some of the 10 broadly diversified domestic and sector ETFs from my HighVolume list as posted every Saturday. Furthermore, they are screened for the lowest MaxDD% number meaning they have been showing better resistance to temporary sell offs than all others over the past year.
The below table simply demonstrates the magnitude with which these ETFs are fluctuating above or below their respective individual trend lines (%+/-M/A). A break below, represented by a negative number, shows weakness, while a break above, represented by a positive percentage, shows strength.
For hundreds of ETF choices, be sure to reference Thursday’s StatSheet.
For this current domestic “Buy” cycle, here’s how some our candidates have fared:
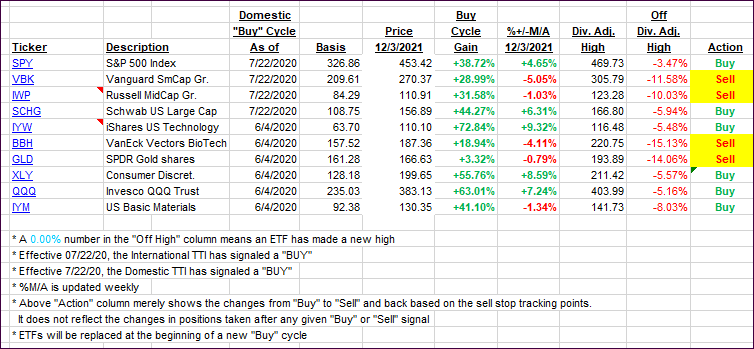
Click image to enlarge.
Again, the %+/-M/A column above shows the position of the various ETFs in relation to their respective long-term trend lines, while the trailing sell stops are being tracked in the “Off High” column. The “Action” column will signal a “Sell” once the -8% point has been taken out in the “Off High” column. For more volatile sector ETFs, the trigger point is -10%.
3. Trend Tracking Indexes (TTIs)
Our TTIs slipped again due to no upside follow through from yesterday’s rebound. It will only take a little more volatility, and the Domestic TTI will also drop below its trend line and into bearish territory. That, accompanied by a little staying power below, will generate a “Sell” signal for that arena.
If you follow along, you need to check in regularly.
This is how we closed 12/03/2021:
Domestic TTI: +2.07% above its M/A (prior close +2.96%)—Buy signal effective 07/22/2020.
International TTI: -1.45% below its M/A (prior close -1.09%)—Buy signal effective 07/22/2020.
Disclosure: I am obliged to inform you that I, as well as my advisory clients, own some of the ETFs listed in the above table. Furthermore, they do not represent a specific investment recommendation for you, they merely show which ETFs from the universe I track are falling within the specified guidelines.
All linked charts above are courtesy of Bloomberg via ZeroHedge.
———————————————————-
WOULD YOU LIKE TO HAVE YOUR INVESTMENTS PROFESSIONALLY MANAGED?
Do you have the time to follow our investment plans yourself? If you are a busy professional who would like to have his portfolio managed using our methodology, please contact me directly or get more details here.
Contact Ulli