
- Moving the markets
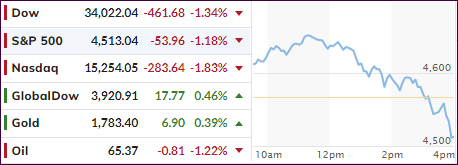
The first couple of trading hours were hopeful with the Dow jumping ahead over 300 points indicating that recent volatility had subsided and traders assuming that we’d be well on our way to the much-anticipated Holiday finish.
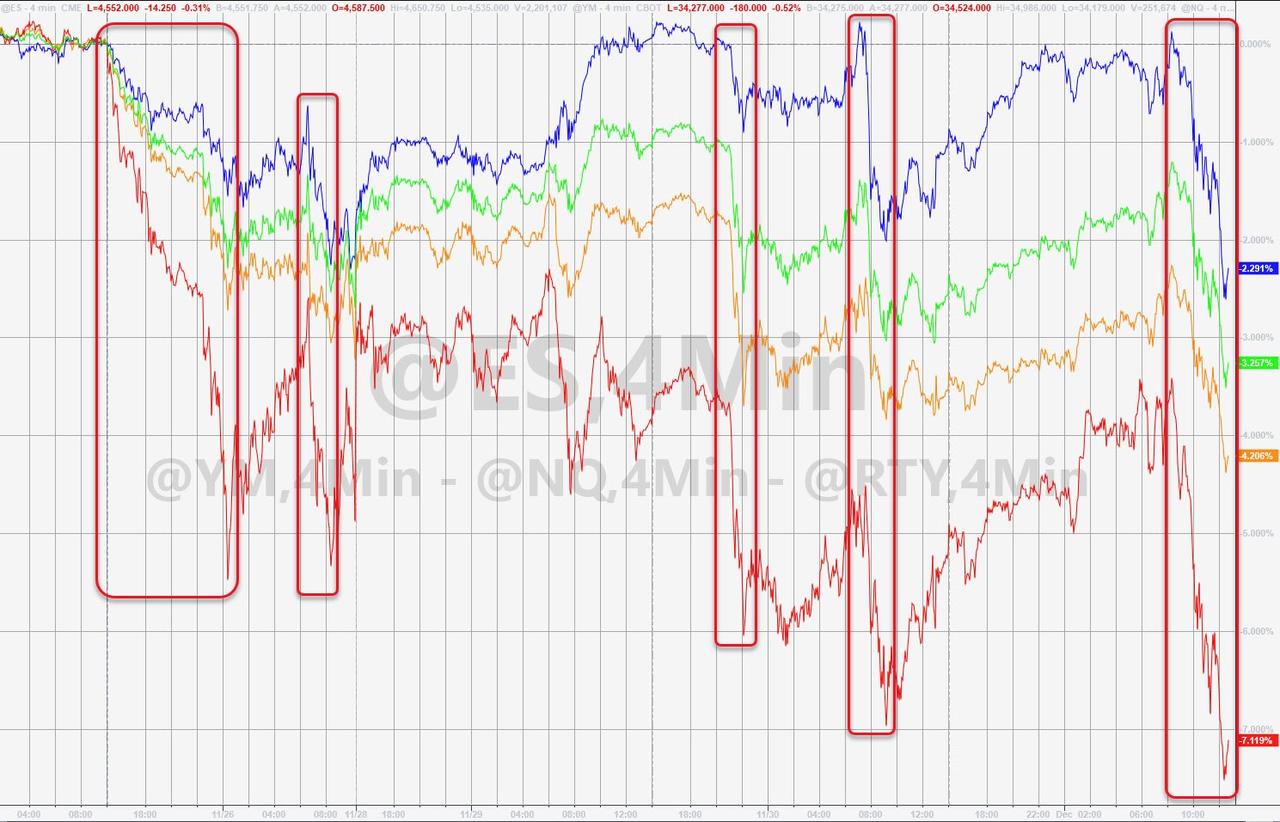
Those hopes were dashed suddenly, when the bears took the upper hand and pounded the major indexes into oblivion with the Dow ending the session down over 460 points, which means the index covered a range of almost 800 points. The S&P 500 and Nasdaq followed suit with the latter suffering the worst loss.
This moment of reality was caused by reports that the Omicron variant had arrived in the US. Of course, the MSM used that event for more fearmongering, but the real negative came from the Fed’s Williams:
“Clearly, it adds a lot of uncertainty to the outlook,” Mr. Williams said of the new variant. He later added that a risk with the new variant is that it “will continue that excess demand in the areas that don’t have capacity and will stall the recovery in the areas where we actually have the capacity.”
That, he said, would “mean a somewhat slower rebound overall” and “also does increase those inflationary pressures, in those areas that are in high demand.”
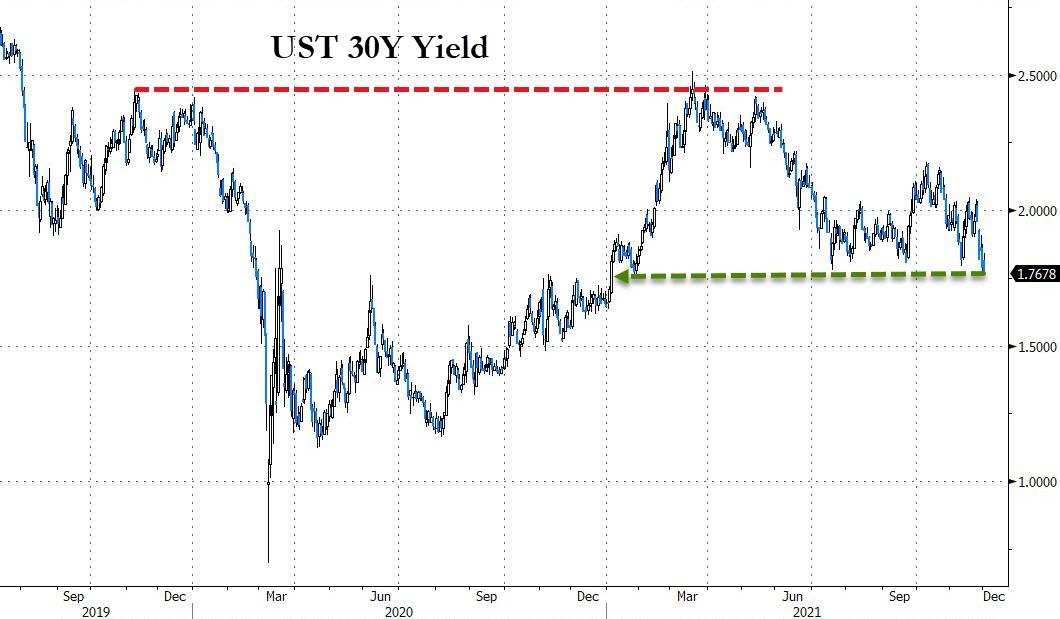
On other words, the dreaded “S” word, as in stagflation, has moved front and center again and sent equities on a southerly path. Bond yields reversed their recent northerly trend with the 30-year settling back below 1.79% last seen at the beginning of this year.
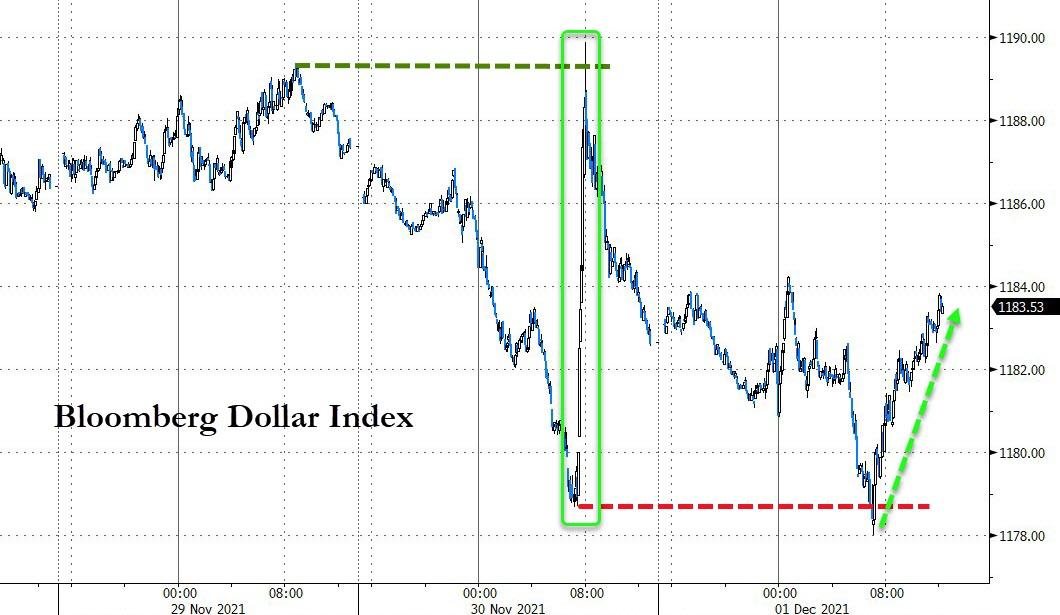
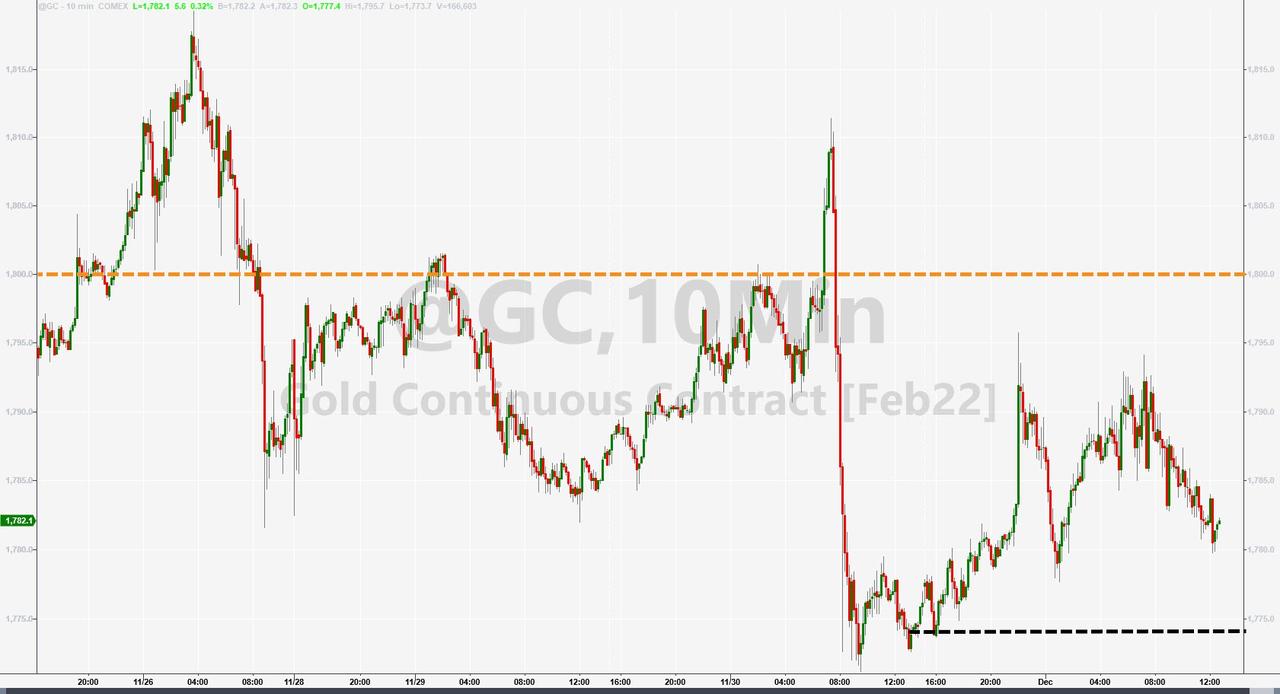
The US Dollar dipped and ripped but ended the session unchanged, which helped gold to stay in the green. After giving back some of its early gains, the precious metal managed to advance 0.38%.
Our Domestic Trend Tracking Index (TTI) is now rapidly approaching its trend line from above and is in clear danger of breaking it to the downside. Please see section 3 for more details.
2. ETFs in the Spotlight
In case you missed the announcement and description of this section, you can read it here again.
It features some of the 10 broadly diversified domestic and sector ETFs from my HighVolume list as posted every Saturday. Furthermore, they are screened for the lowest MaxDD% number meaning they have been showing better resistance to temporary sell offs than all others over the past year.
The below table simply demonstrates the magnitude with which these ETFs are fluctuating above or below their respective individual trend lines (%+/-M/A). A break below, represented by a negative number, shows weakness, while a break above, represented by a positive percentage, shows strength.
For hundreds of ETF choices, be sure to reference Thursday’s StatSheet.
For this current domestic “Buy” cycle, here’s how some our candidates have fared:
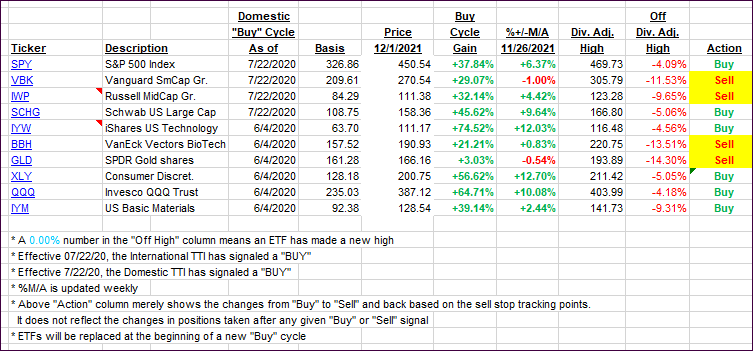
Click image to enlarge.
Again, the %+/-M/A column above shows the position of the various ETFs in relation to their respective long-term trend lines, while the trailing sell stops are being tracked in the “Off High” column. The “Action” column will signal a “Sell” once the -8% point has been taken out in the “Off High” column. For more volatile sector ETFs, the trigger point is -10%.
3. Trend Tracking Indexes (TTIs)
While our International TTI improved during today’s sell fest, the same can’t be said about its Domestic cousin, which fell sharply and is now sitting within spitting distance of piercing its long-term trend line to the downside.
This action would mean a “Sell” for all “broadly diversified domestic equity ETFs and mutual funds.” Of course, before that signal gets executed, I need to see some staying power below the line to determine that this drop is indeed sustainable. The reason is obvious in that I try to avoid a whip-saw signal.
This is how we closed 12/01/2021:
Domestic TTI: +0.53% above its M/A (prior close +1.80%)—Buy signal effective 07/22/2020.
International TTI: -1.91% below its M/A (prior close -2.09%)—Buy signal effective 07/22/2020.
Disclosure: I am obliged to inform you that I, as well as my advisory clients, own some of the ETFs listed in the above table. Furthermore, they do not represent a specific investment recommendation for you, they merely show which ETFs from the universe I track are falling within the specified guidelines.
All linked charts above are courtesy of Bloomberg via ZeroHedge.
Contact Ulli