
ETF Tracker StatSheet
You can view the latest version here.
S&P 500 SCORES ITS BEST WEEK SINCE JUNE
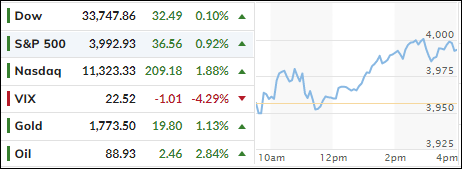
[Chart courtesy of MarketWatch.com]
- Moving the markets
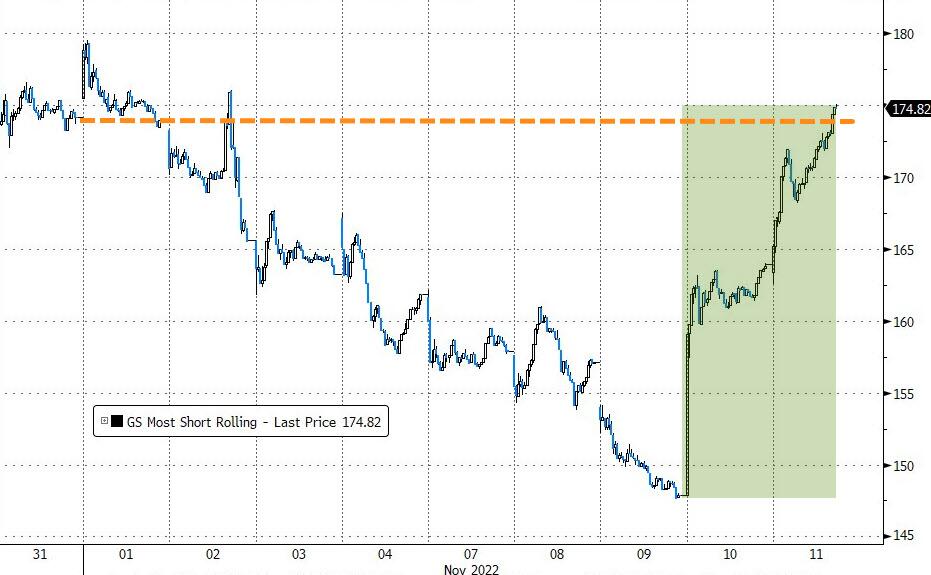
After yesterday’s euphoric reaction to the better-than-expected CPI report, bullish momentum prevailed throughout the session, despite the bond market being closed on this Veteran’s Day. But the short squeeze was alive and well and contributed to another positive ending.
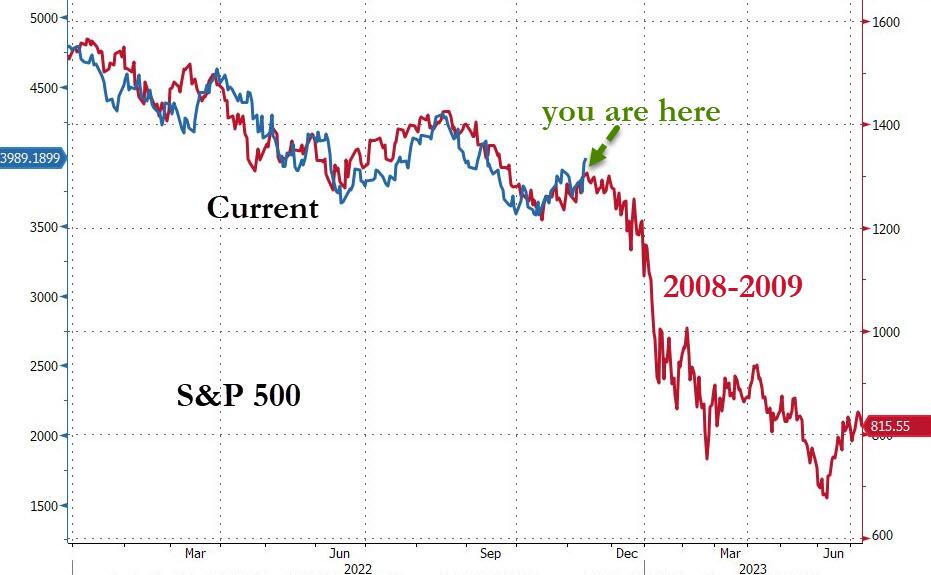
Again, hopes that the Fed would be slowing its interest rate hikes, and therefore supporting equities, was the main driver for the S&P scoring its best week since the June rebound. However, that one ended in a bearish disaster only two months later when the index’s 200-day M/A turned out to be the reversal point to new yearly lows.
This scenario seems to be repeating itself, as the S&P 500 is only 2.16% away from a second attempt to break through that resistance level. If it’s successful, I could see more upside potential. However, if the 200-day M/A turns out to be another impenetrable overhead ceiling, this feel-good CPI rebound may bite the dust.
The future for a sustainable rally in equities lies with the Fed and its intentions not only how high they might hike but also for how long. Despite Fed head Powell and its various mouthpieces spewing nothing but hawkish comments, the Wall Street crowd remains convinced that a pause or a pivot is on deck, hence the frontrunning efforts.
Today, it was Boston Fed President Susan Collins, who uttered these words:
- I think that as we have raised rates that the risk of over tightening has increased.
- I do think we’re going to need to raise rates further.
- A smaller, more “deliberate” rate increase should not be confused for a sign that the Fed is backing down from the task of curbing price pressures.
To me, that does not sound like a Fed that is about to pivot…
The US Dollar spanking continued, as ZeroHedge reported, with the world’s reserve currency down 5 of the last 6 days. It has lost 5% against its fiat peers and has broken its 50- and 100-day M/As on its way to 3-month lows.
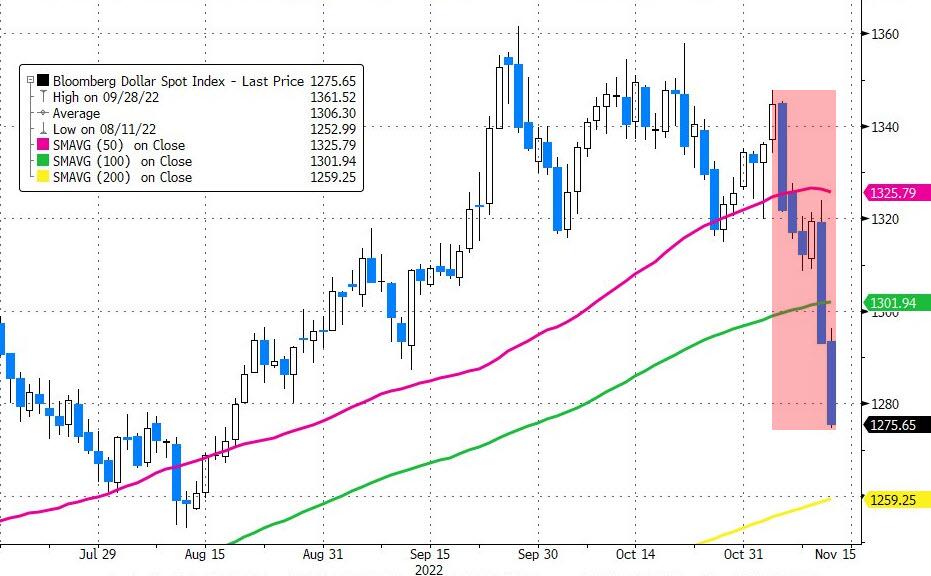
Gold was the beneficiary and closed at $1,770, its highest in 3 months while scoring its best week since March 2020.
According to this analog, we are still in a bear market rally, although my Domestic Trend Tracking Index (TTI-section 3) has crossed its trend line into bullish territory. We should see more clarity next week—in one way or another.
2. ETFs in the Spotlight
In case you missed the announcement and description of this section, you can read it here again.
It features some of the 10 broadly diversified domestic and sector ETFs from my HighVolume list as posted every Saturday. Furthermore, they are screened for the lowest MaxDD% number meaning they have been showing better resistance to temporary sell offs than all others over the past year.
The below table simply demonstrates the magnitude with which these ETFs are fluctuating above or below their respective individual trend lines (%+/-M/A). A break below, represented by a negative number, shows weakness, while a break above, represented by a positive percentage, shows strength.
For hundreds of ETF choices, be sure to reference Thursday’s StatSheet.
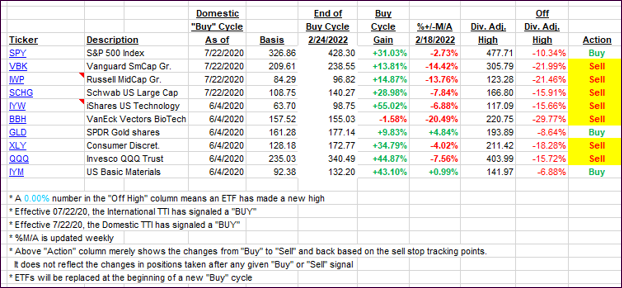
For this closed-out domestic “Buy” cycle (2/24/2022), here’s how some of our candidates have fared. Keep in mind that our Domestic Trend Tracking Index (TTI) signaled a “Sell” on that date, which overrode the existing “Buys” shown for SPY and IYM:
Click image to enlarge.
Again, the %+/-M/A column above shows the position of the various ETFs in relation to their respective long-term trend lines, while the trailing sell stops are being tracked in the “Off High” column. The “Action” column will signal a “Sell” once the -12% point has been taken out in the “Off High” column, which has replaced the prior -8% to -10% limits.
3. Trend Tracking Indexes (TTIs)
Our TTIs advanced with the Domestic one now improving its position above the trend line for the second day. Next week, we should see if this rally has legs and will represent the beginning of a new bull market.
This is how we closed 11/11/2022:
Domestic TTI: +2.03% above its M/A (prior close +0.93%)—Sell signal effective 02/24/2022.
International TTI: +0.36% above its M/A (prior close -1.67%)—Sell signal effective 03/08/2022.
Disclosure: I am obliged to inform you that I, as well as my advisory clients, own some of the ETFs listed in the above table. Furthermore, they do not represent a specific investment recommendation for you, they merely show which ETFs from the universe I track are falling within the specified guidelines.
All linked charts above are courtesy of Bloomberg via ZeroHedge.
———————————————————-
WOULD YOU LIKE TO HAVE YOUR INVESTMENTS PROFESSIONALLY MANAGED?
Do you have the time to follow our investment plans yourself? If you are a busy professional who would like to have his portfolio managed using our methodology, please contact me directly to get more details.
Contact Ulli