
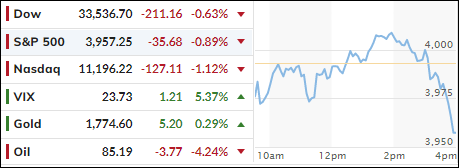
[Chart courtesy of MarketWatch.com]
- Moving the markets
After last week’s Ramp-A-Thon, equities needed a breather. Even though the major indexes held up well throughout the session by bouncing around their respective unchanged lines, momentum waned during the last hour and south we went.
Given the advances of the past five trading days, a pause was in order, and that’s exactly what developed this afternoon. The question now remains if traders’ sentiment is bullish enough to build on recent gains to sustain upward momentum—even at a slower pace— during this seasonally strongest period of the year before the reality of fragile earnings sets in come 2023.
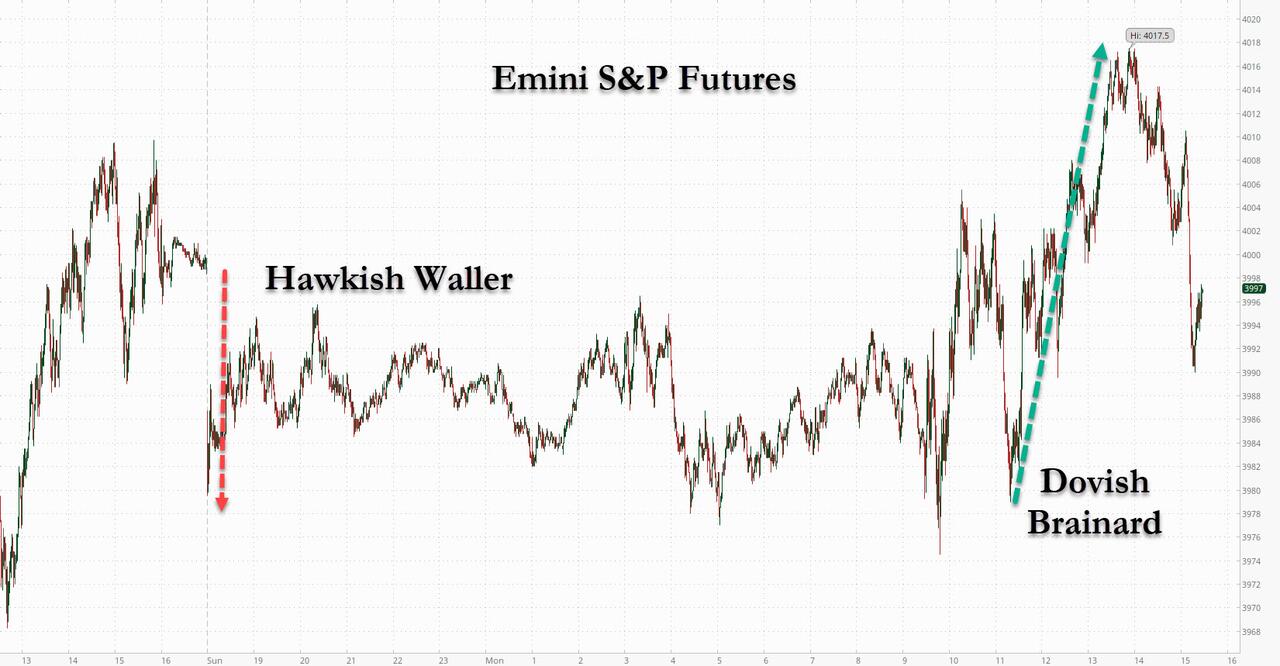
Two dovish and hawkish messages by a couple of Fed mouth pieces cancelled each other out but caused some whipsaws during the session with the S&P being unable to hang on to its $4k level.
Bond yields went sideways, the US Dollar was flat, but gold managed to score a +0.33% gain and kept inching closer to its $1,800 level.
The S&P is now 3.03% away from breaching its widely watched 200-day M/A, a key resistance level which, if broken to the upside, could give technical traders encouragement that the rally will continue, as third quarter earnings season moves into its 9th inning.
2. ETFs in the Spotlight
In case you missed the announcement and description of this section, you can read it here again.
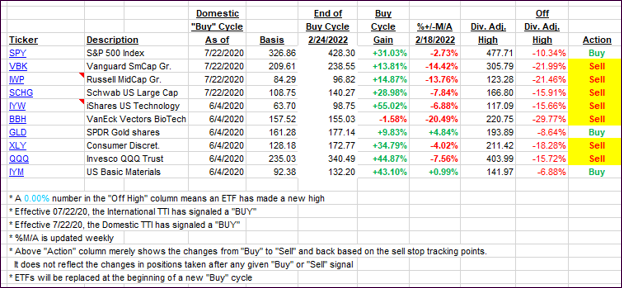
It features some of the 10 broadly diversified domestic and sector ETFs from my HighVolume list as posted every Saturday. Furthermore, they are screened for the lowest MaxDD% number meaning they have been showing better resistance to temporary sell offs than all others over the past year.
The below table simply demonstrates the magnitude with which these ETFs are fluctuating above or below their respective individual trend lines (%+/-M/A). A break below, represented by a negative number, shows weakness, while a break above, represented by a positive percentage, shows strength.
For hundreds of ETF choices, be sure to reference Thursday’s StatSheet.
For this closed-out domestic “Buy” cycle (2/24/2022), here’s how some of our candidates have fared. Keep in mind that our Domestic Trend Tracking Index (TTI) signaled a “Sell” on that date, which overrode the existing “Buys” shown for SPY and IYM:
Click image to enlarge.
Again, the %+/-M/A column above shows the position of the various ETFs in relation to their respective long-term trend lines, while the trailing sell stops are being tracked in the “Off High” column. The “Action” column will signal a “Sell” once the -12% point has been taken out in the “Off High” column, which has replaced the prior -8% to -10% limits.
3. Trend Tracking Indexes (TTIs)
Our TTIs gave back recent gains with the International one sliding back below its trend line, while the Domestic one remained above it, albeit by only a small margin. This shows how quickly things can turn the other way, which is why it’s important to have the indexes show some bullish staying power before pulling the trigger on a new “Buy” signal.
This is how we closed 11/14/2022:
Domestic TTI: +0.91% above its M/A (prior close +2.03%)—Sell signal effective 02/24/2022.
International TTI: -0.15% below its M/A (prior close +0.36%)—Sell signal effective 03/08/2022.
Disclosure: I am obliged to inform you that I, as well as my advisory clients, own some of the ETFs listed in the above table. Furthermore, they do not represent a specific investment recommendation for you, they merely show which ETFs from the universe I track are falling within the specified guidelines.
All linked charts above are courtesy of Bloomberg via ZeroHedge.
Contact Ulli