
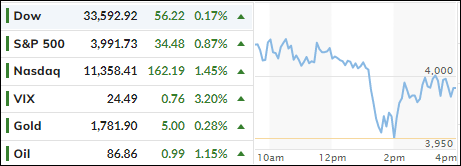
[Chart courtesy of MarketWatch.com]
- Moving the markets
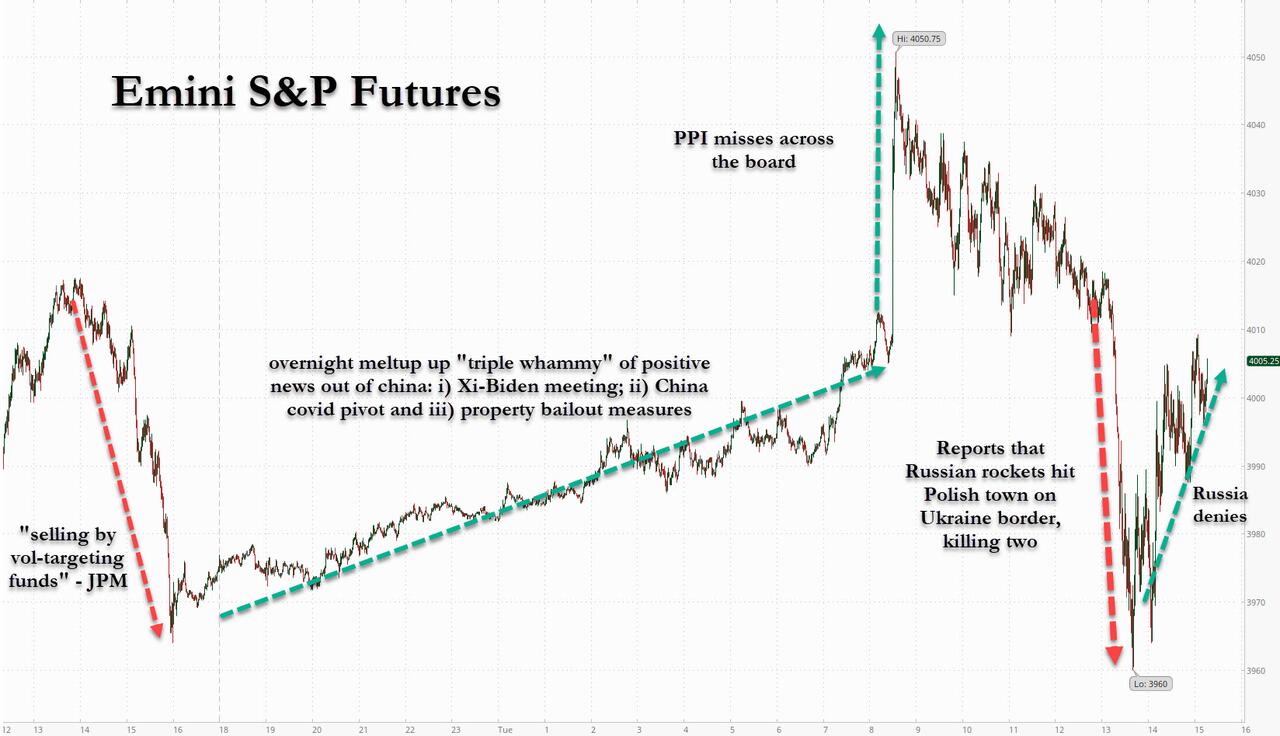
Today’s Producer Price Index (PPI) came in better than expected with CNBC highlighting the data as follows:
- The producer price index rose 0.2% in October, below the 0.4% estimate.
- A significant contributor to the slowdown in wholesale inflation was a 0.1% decline in services, the first outright decline in that measure since November 2020.
- On a year-over-year basis, PPI rose 8% compared to an 8.4% increase in September.
Still, an “only” 8% YoY increase is hardly anything to get excited about, but algos and traders are living in their own world, in which it’s a foregone conclusion that we have seen peak interest rates and peak inflation, both of which are now believed to be on a downward trajectory.
As a result, the data were seen as a positive with the markets scoring a green close despite a sharp mid-day sell off, which pulled the major indexes off their morning highs with the rollercoaster ride continuing.
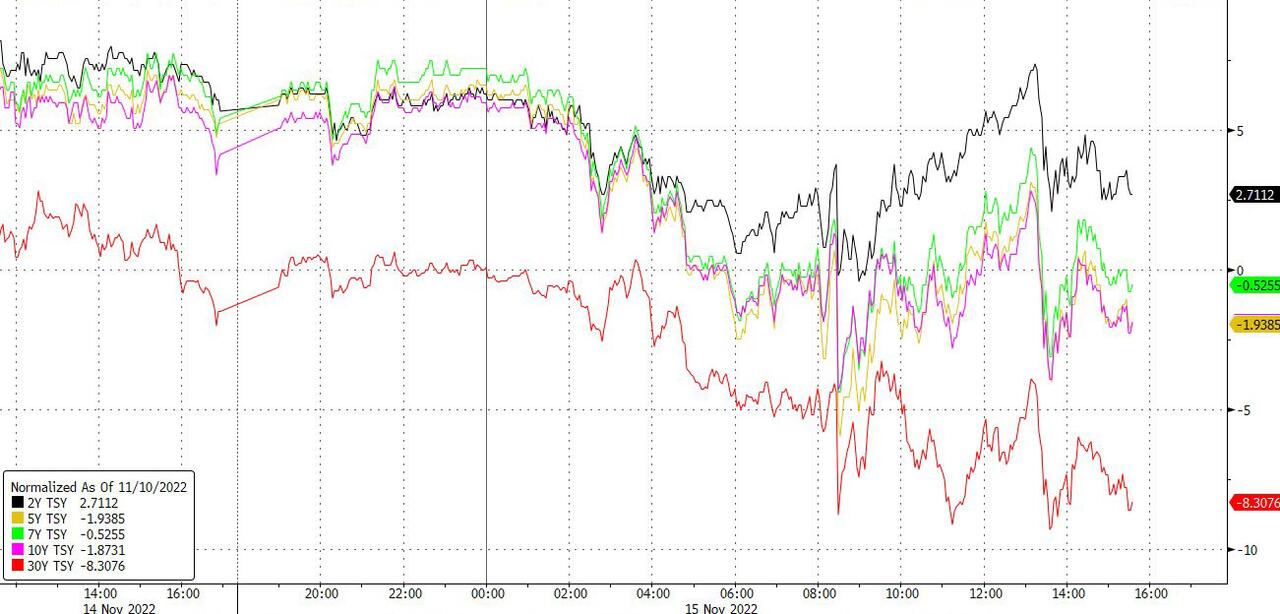
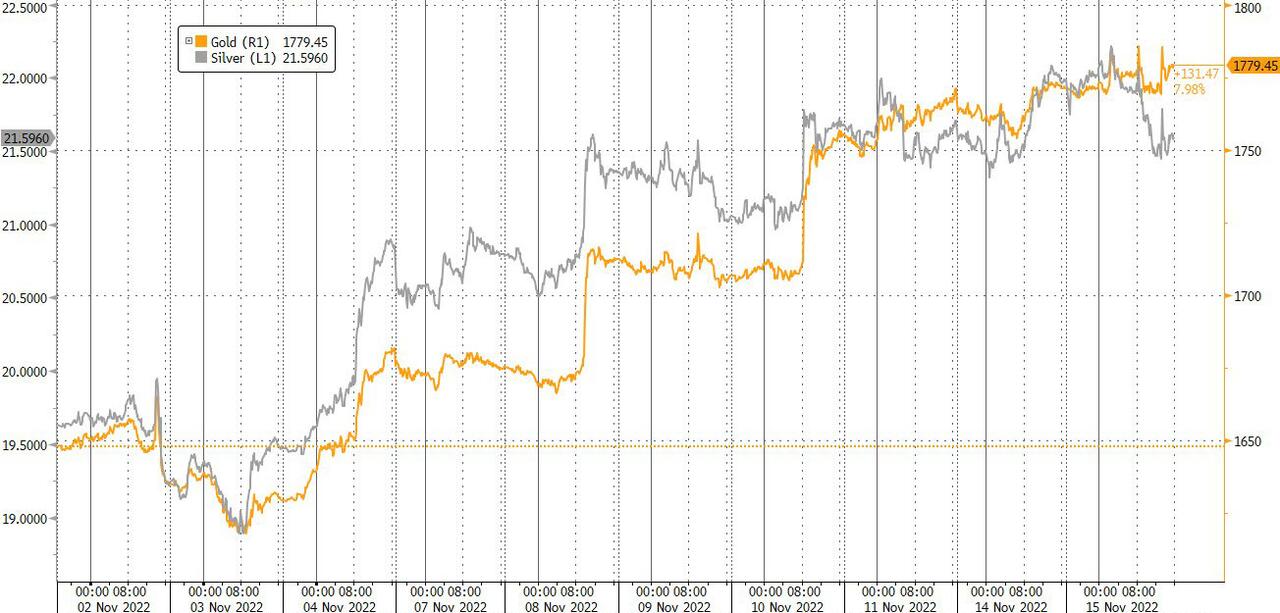
Bond yields meandered throughout the session with the 10-year losing 9bps to close at 3.77%, well below its much-fought over 4% level. The US Dollar continued its slide thereby supporting gold, which advanced again and is now within striking distance of regaining its $1,800 level.
Our main directional indicator, the Domestic Trend Tracking Index (TTI) has now remained above its long-term trend line for the 4th straight day. However, there has not been much follow through to the upside, so the TTI is only a modest sell-off away from breaking back below its dividing line between bullish and bearish territory.
I like to see more staying power and upside momentum before issuing a new “Buy” signal for that arena.
2. ETFs in the Spotlight
In case you missed the announcement and description of this section, you can read it here again.
It features some of the 10 broadly diversified domestic and sector ETFs from my HighVolume list as posted every Saturday. Furthermore, they are screened for the lowest MaxDD% number meaning they have been showing better resistance to temporary sell offs than all others over the past year.
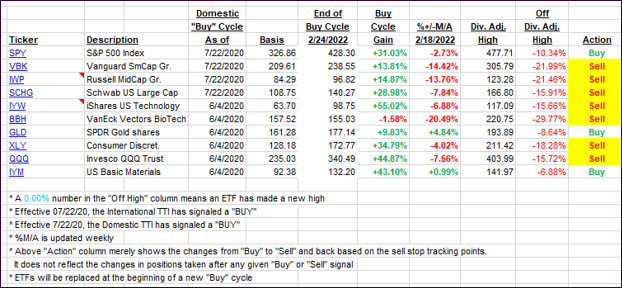
The below table simply demonstrates the magnitude with which these ETFs are fluctuating above or below their respective individual trend lines (%+/-M/A). A break below, represented by a negative number, shows weakness, while a break above, represented by a positive percentage, shows strength.
For hundreds of ETF choices, be sure to reference Thursday’s StatSheet.
For this closed-out domestic “Buy” cycle (2/24/2022), here’s how some of our candidates have fared. Keep in mind that our Domestic Trend Tracking Index (TTI) signaled a “Sell” on that date, which overrode the existing “Buys” shown for SPY and IYM:
Click image to enlarge.
Again, the %+/-M/A column above shows the position of the various ETFs in relation to their respective long-term trend lines, while the trailing sell stops are being tracked in the “Off High” column. The “Action” column will signal a “Sell” once the -12% point has been taken out in the “Off High” column, which has replaced the prior -8% to -10% limits.
3. Trend Tracking Indexes (TTIs)
Our TTIs reversed and headed higher, as the markets interpreted the PPI reading as a positive. More staying power above the line is needed before I will issue a new “Buy” signal.
This is how we closed 11/15/2022:
Domestic TTI: +1.86% above its M/A (prior close +0.91%)—Sell signal effective 02/24/2022.
International TTI: +0.78% above its M/A (prior close -0.15%)—Sell signal effective 03/08/2022.
Disclosure: I am obliged to inform you that I, as well as my advisory clients, own some of the ETFs listed in the above table. Furthermore, they do not represent a specific investment recommendation for you, they merely show which ETFs from the universe I track are falling within the specified guidelines.
All linked charts above are courtesy of Bloomberg via ZeroHedge.
Contact Ulli