
- Moving the markets
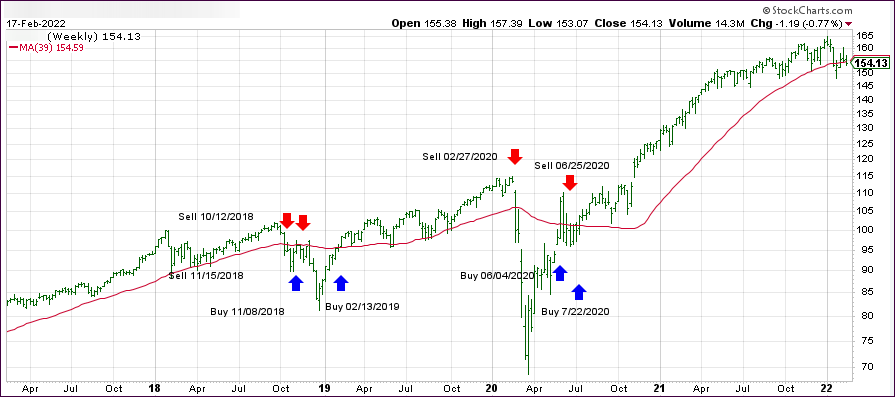
Finally, after several weeks of bouncing above and below my domestic trend line, which separates bullish from bearish territory, today’s downside piercing was enough to confirm that the existing “Buy” cycle had finally come to an end. For tracking purposes, the effective date will be tomorrow, February 24th.
This shift to “Sell” mode only affects “broadly diversified domestic equity ETFs and mutual funds.” Sector and County funds shown in my Thursday StatSheet remain in “selective” Buy mode, meaning they are in bullish territory, if they remain above their respective trend lines (%M/A).
As posted yesterday, in my advisor practice we had only minimal domestic exposure left, the main position of which I already liquidated earlier in the session. It seemed that, due to all the geopolitical distractions, traders and algos alike had not realized that the most widely followed indicator, the S&P 500, had not only dropped below its 200-day M/A a few days ago but also into “correction” territory.
Of course, in this topsy turvy world we are living in, there is no way to assess how long we will remain out of the domestic market. In the meantime, however, I have shifted some assets into a few sector funds, which have been performing well and look to do so in the future given the continuing rise of inflation along with ever-increasing commodity and energy prices.
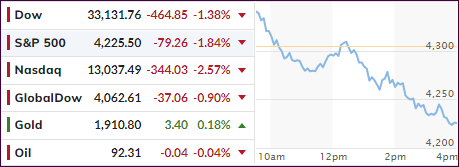
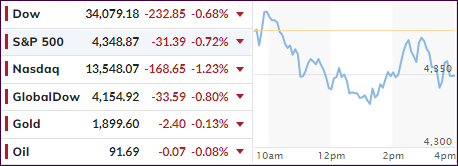
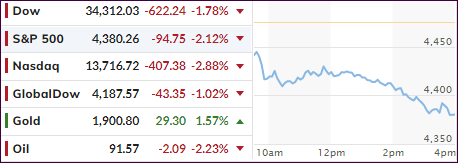
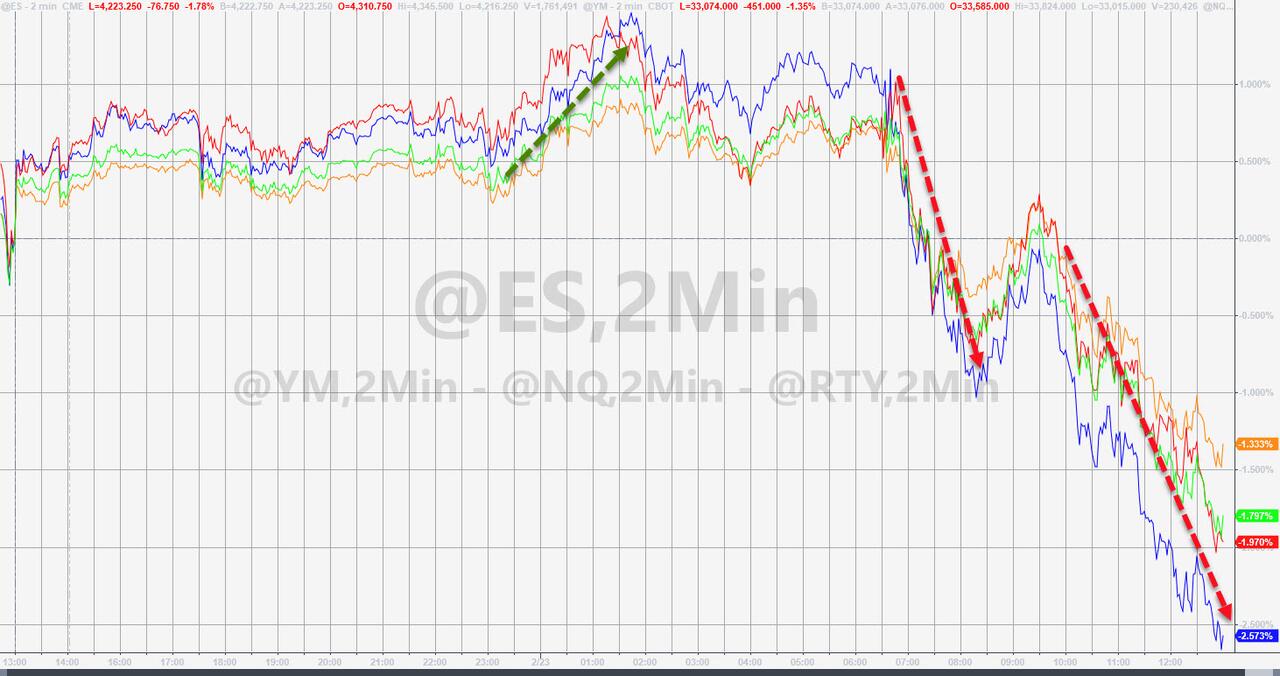
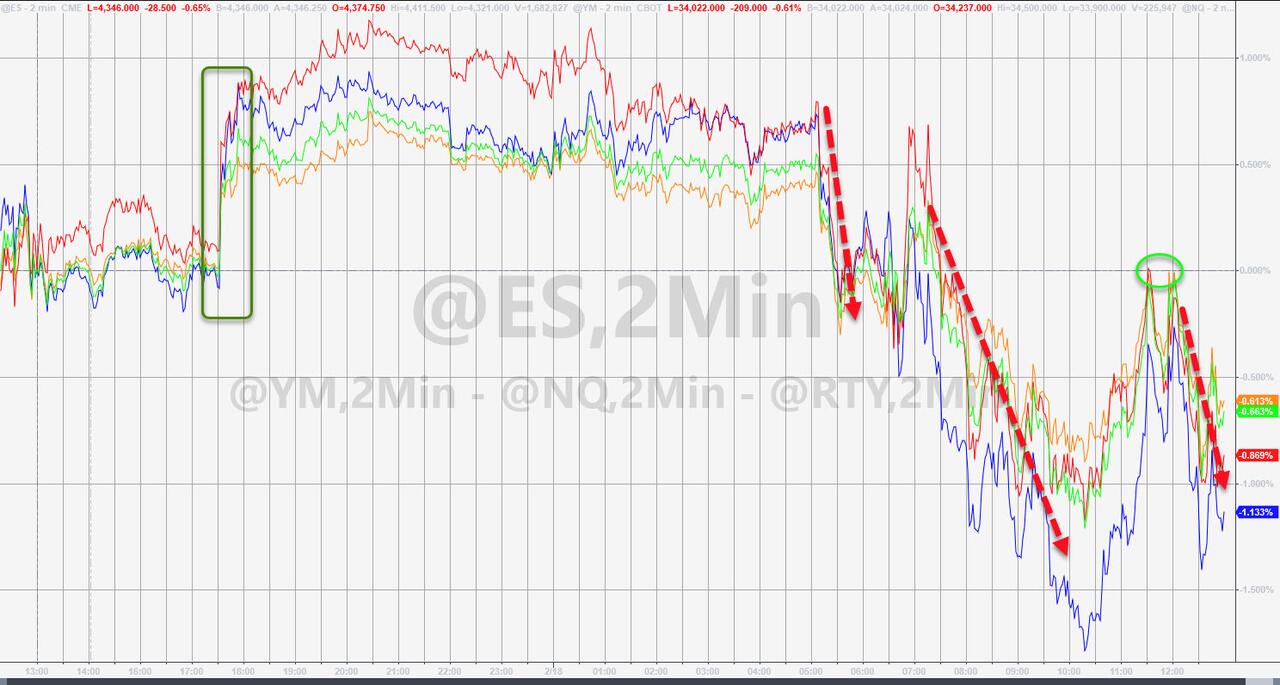
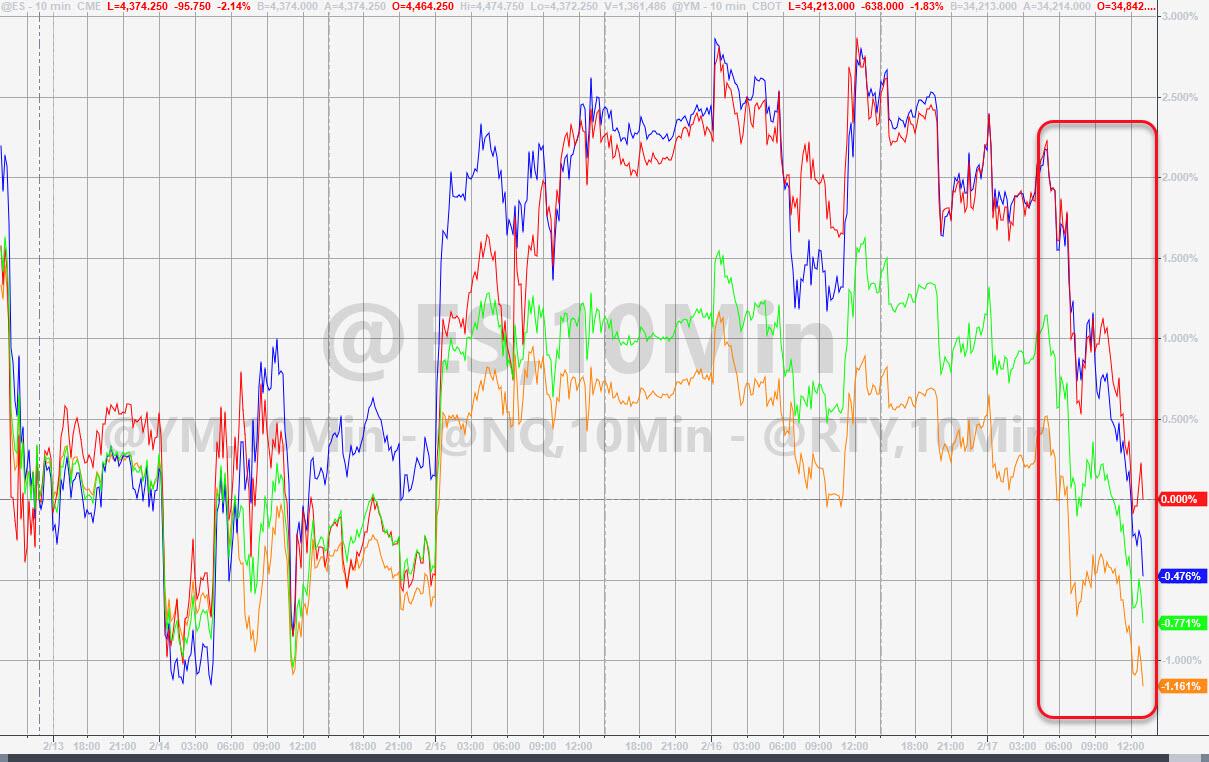
The major indexes, while holding up initially, plunged into the close and reached their lowest level in 2022. In a more shocking context, ZeroHedge reported that SmallCaps have now given up ALL of 2021’s gains (now down 1.4% from 12/31/20), and the Nasdaq is only up 1% from the end of 2020. Ouch! So much for Buy and Hold when the bear strikes.
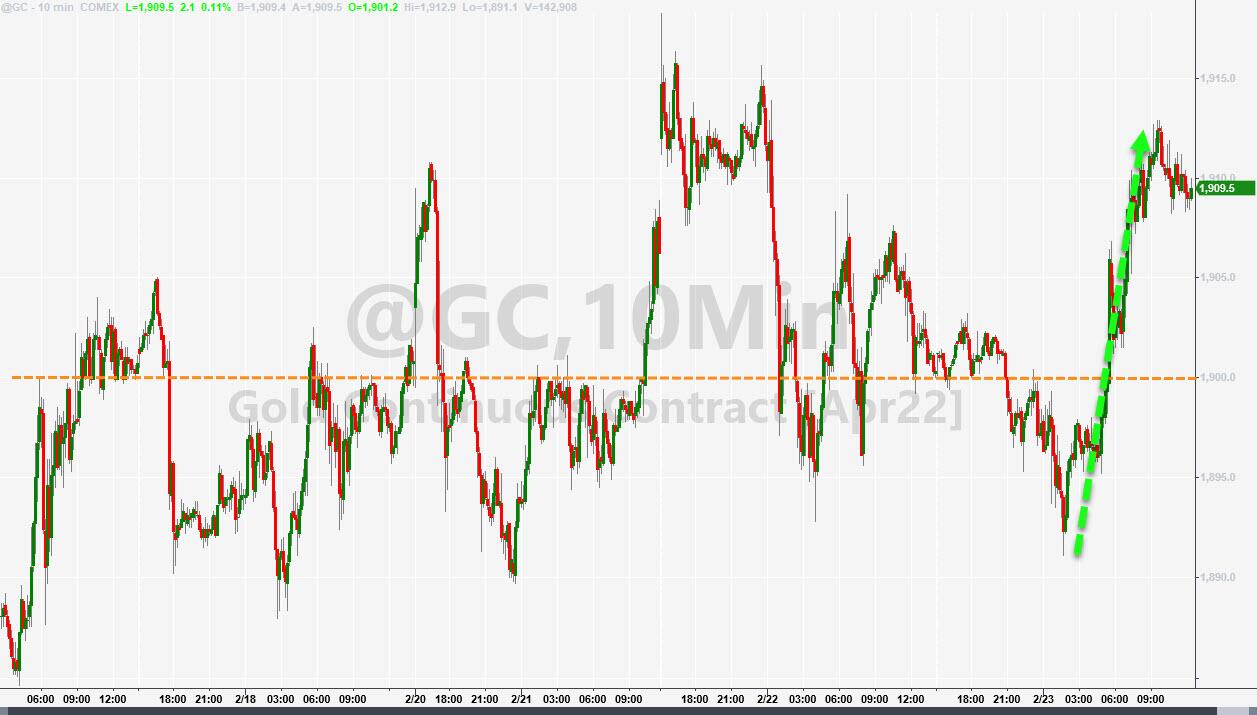
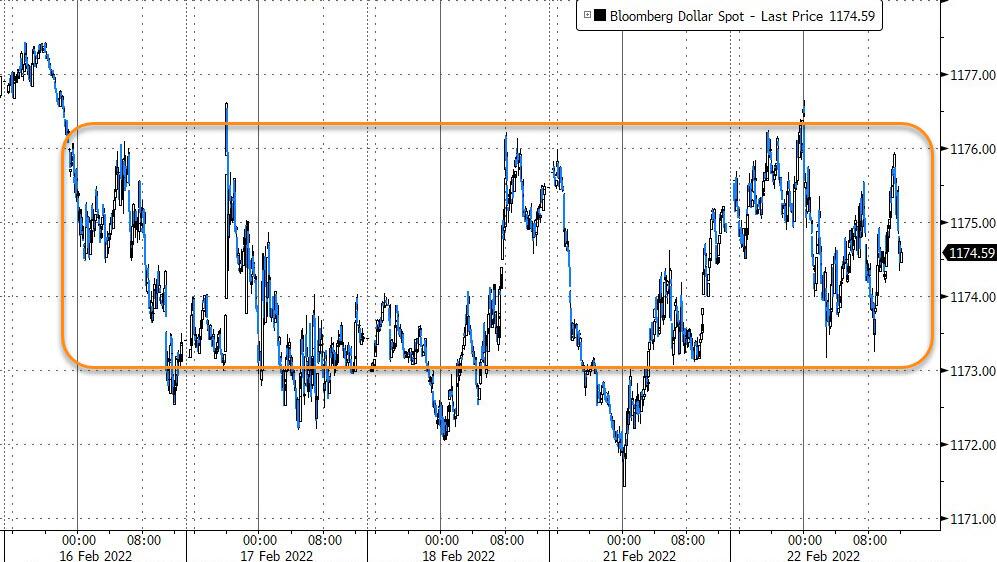
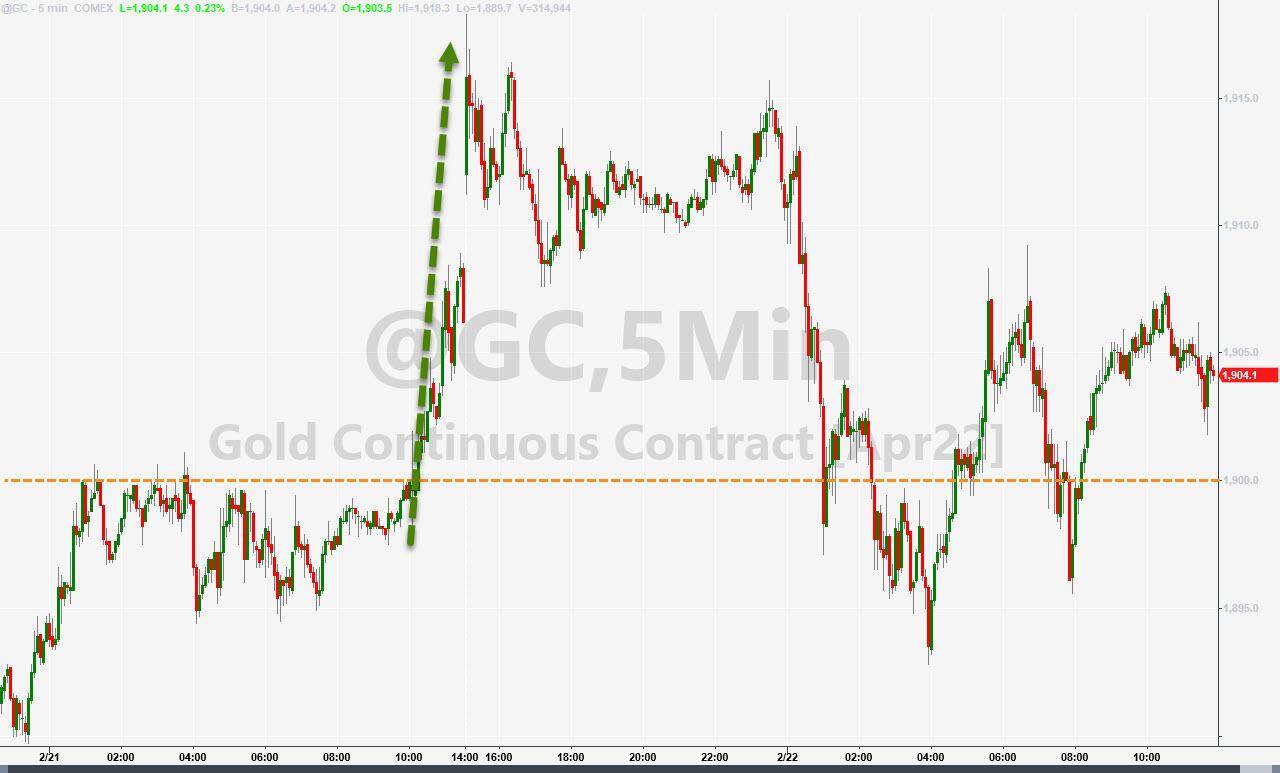
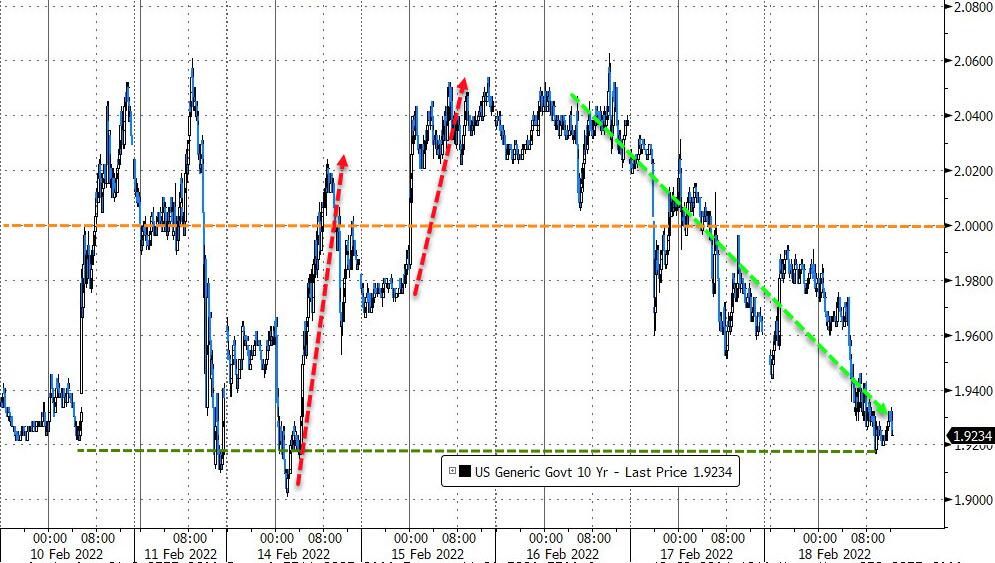
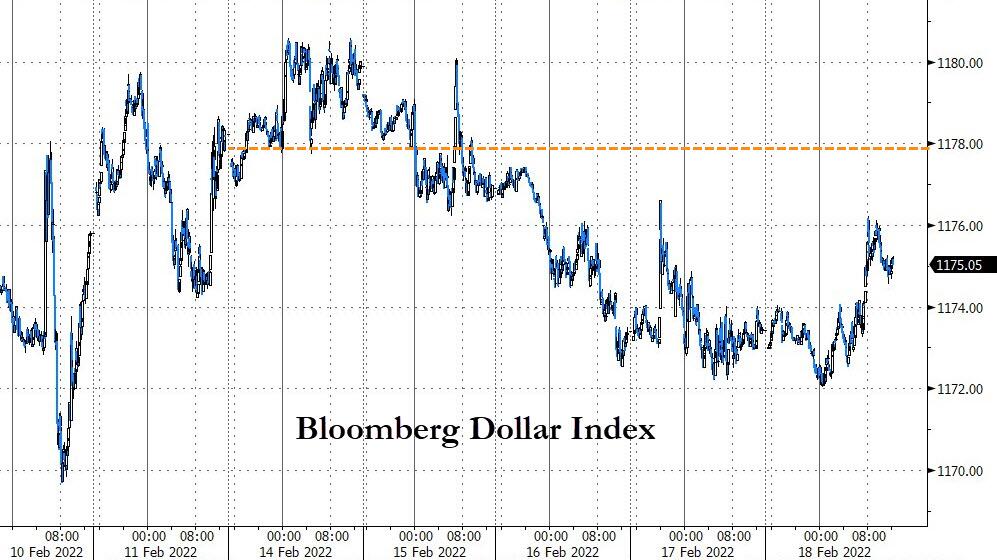
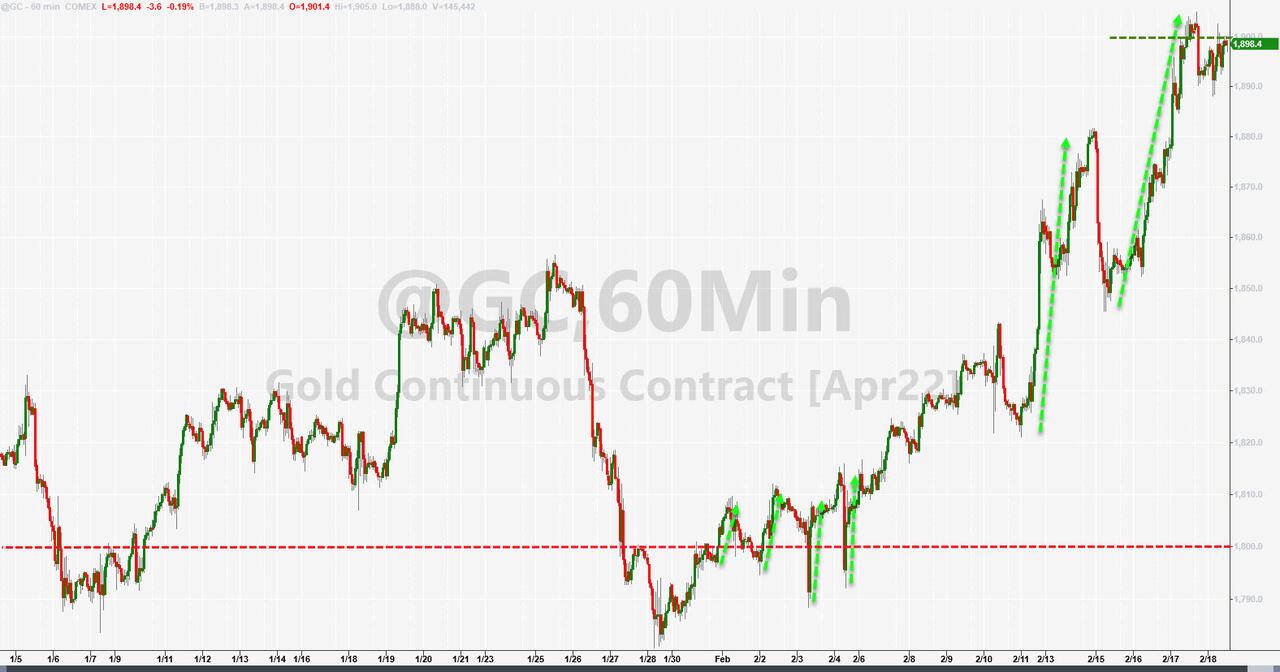
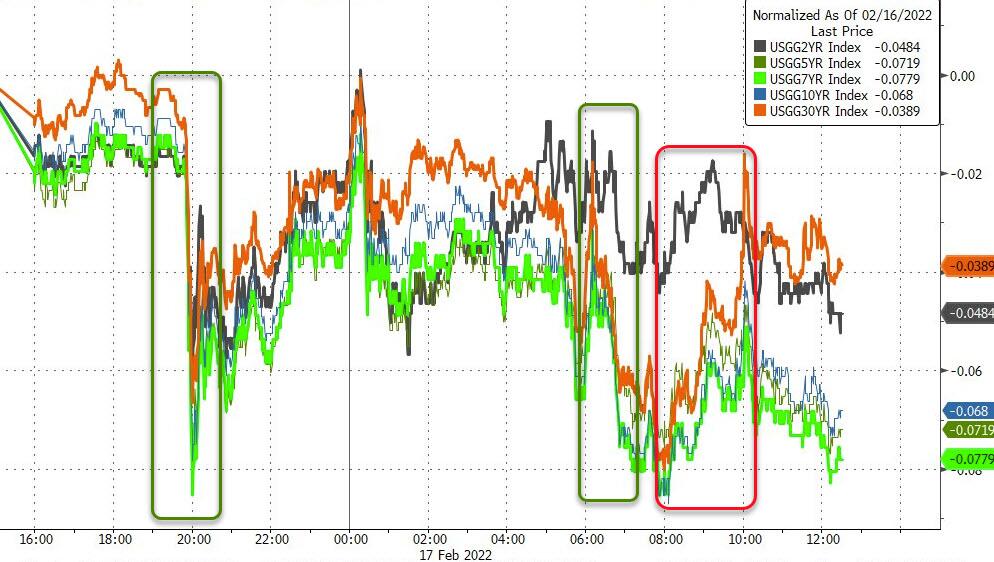
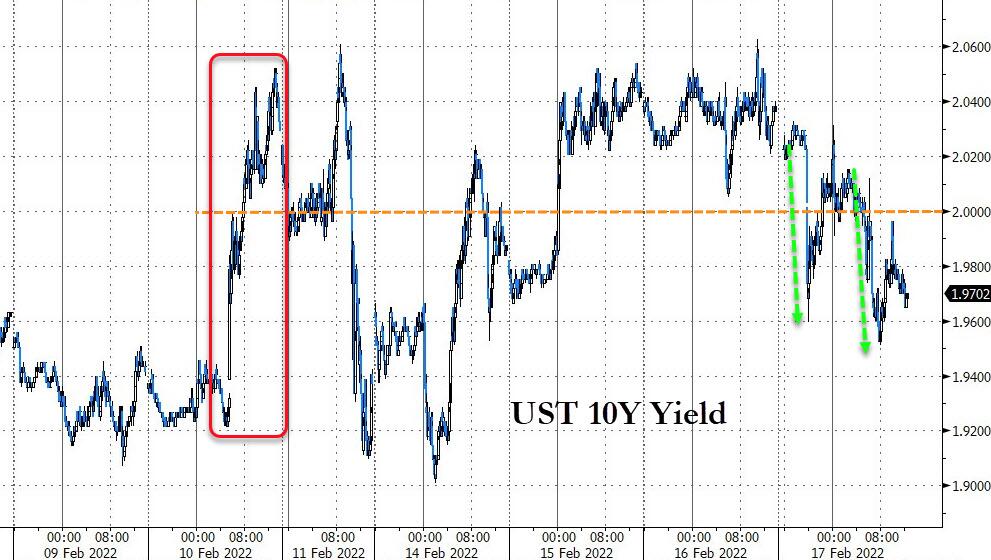
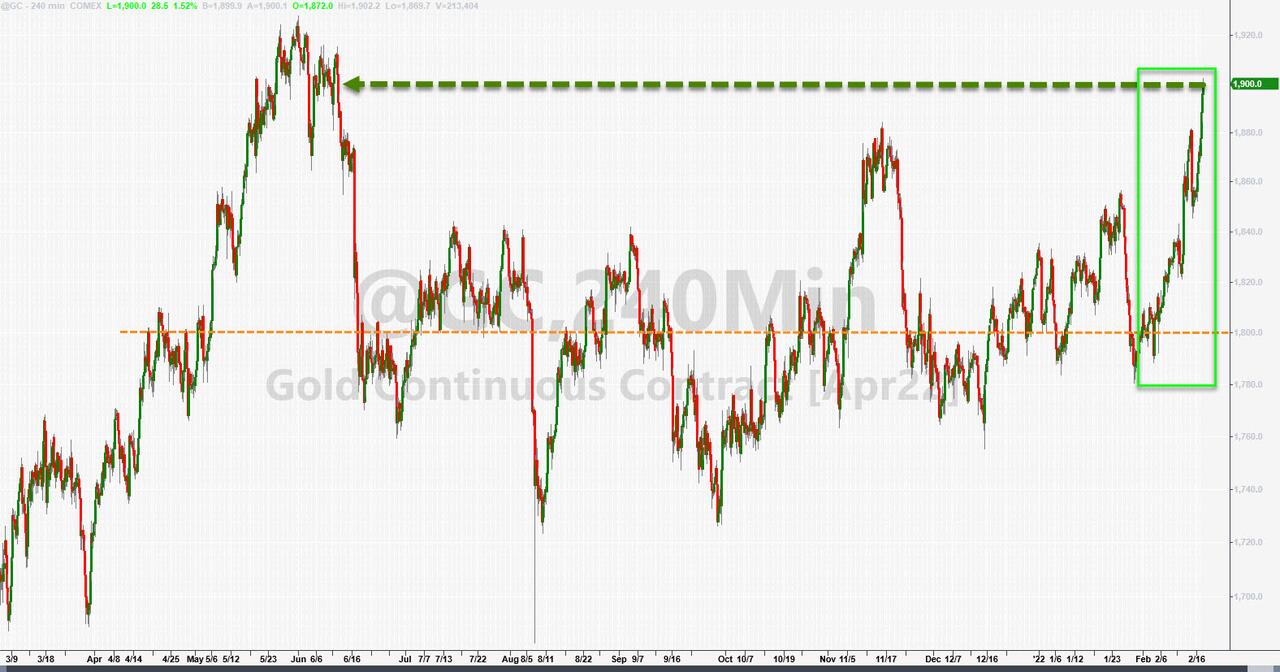
Despite the sell-off in stocks, bond yields rose thereby inflicting more pain on those investors who hold bonds as “protection” against equity weakness. The US Dollar whipsawed and ended about unchanged. To no surprise, gold managed to eke out another gain, albeit a small one.
In my mind, the open question is this one: Will this be the beginning of the long-overdue pricking of the stock market bubble, or will the Fed try to pull a rabbit of its hat—again?
Read More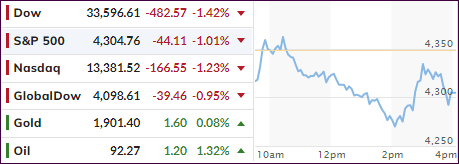

