
ETF Tracker StatSheet
You can view the latest version here.
CHOPPING AND DROPPING
- Moving the markets
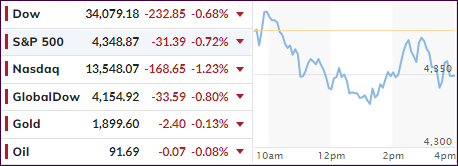
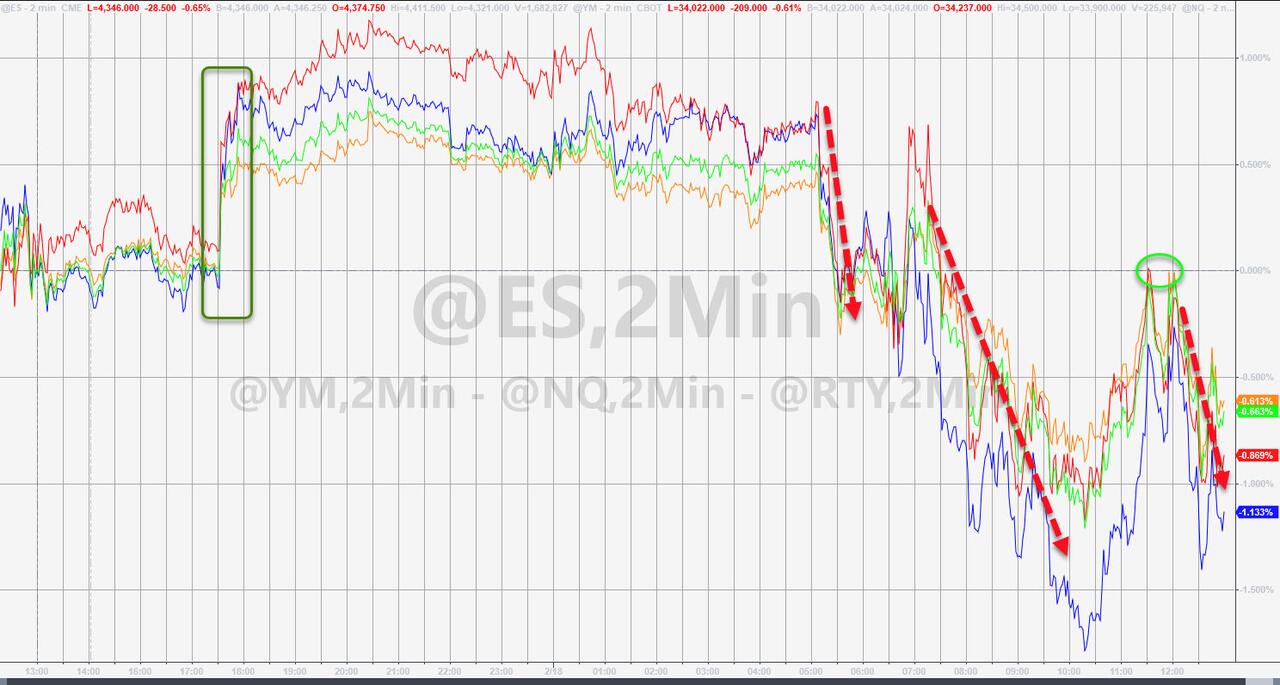
Despite several attempts to reclaim their respective unchanged lines, the major indexes failed and, after chopping around aimlessly all week, succumbed to selling pressure. The S&P 500 surrendered 1.6% over the past 5 trading days, while the indexes scored their second consecutive losing week.
Though options expirations, about $2.2 trillion, influenced some of the erratic market behavior, it was predominantly the continued MSM saga about the Russia-Ukraine conflict that put investors and algos on edge. The latest “attack” headline had no longer a date and time attached to it but was merely referring to an upcoming “event” in a few days.
Headlines in general created much confusion ahead of the 3-day weekend with ZH featuring some of the major ones:
- 0809ET *DONBAS SEPARATISTS SAY WOMEN, CHILDREN TO LEAVE FOR RUSSIA: IFX
- 0838ET *PUTIN: RUSSIA ISN’T AGAINST TALKS ON U.S. SECURITY PROPOSALS
- 0845ET Russia creating ‘false provocations’ in Ukraine in past 24-48 hours: Blinken
- 1040ET *FED’S EVANS: POLICY WRONG-FOOTED, NEEDS SUBSTANTIAL ADJUSTMENT
- 1049ET *ECB OFFICIALS EDGE TOWARD 2022 RATE HIKE TO STEM INFLATION
- 1100ET ITAR-TASS: Powerful explosion rocks downtown Donetsk — Donetsk News Agency
- 1107ET *BIDEN CALL WITH TRANSATLANTIC LEADERS SET FOR 2:30PM ET
- 1240ET *WILLIAMS: HAVE ROOM TO TRIM BAL SHEET MORE QUICKLY THAN BEFORE, SEES FED MOVING TO NORMAL RATES QUICKER THAN ’16, ’17
- 1256ET *DRAGHI: DISCUSSED WITH PUTIN INCREASING GAS SUPPLIES TO ITALY (just made us laugh)
- 1448ET *BELIEVE RUSSIA BEHIND CYBERATTACKS ON UKRAINE BANKS: NEUBERGER
- 1510ET *BRAINARD: I BELIEVE WE WILL TURN NEXT TO BALANCE SHEET RUNOFF
- 1515ET *U.S. BELIEVES RUSSIA POSITIONED FOR UKRAINE ATTACK: PSAKI
- 1555ET *SUBSTANTIAL PROGRESS BEING MADE IN IRAN NUCLEAR TALKS: PSAKI
Despite the Fed having called an emergency meeting last Monday, nothing was revealed nor reported on. Rumor on the Street has it that the Fed is way behind the curve and committed a policy error.
One analyst described the Fed’s dilemma like this:
The Fed is trapped. It can do two things and only two. It can keep it all going, print money and embrace the growing inflation or it can raise interest rates, stop the money printing, and crash the economy and all the markets. In an election year with a failing Administration, what do you think they will do?
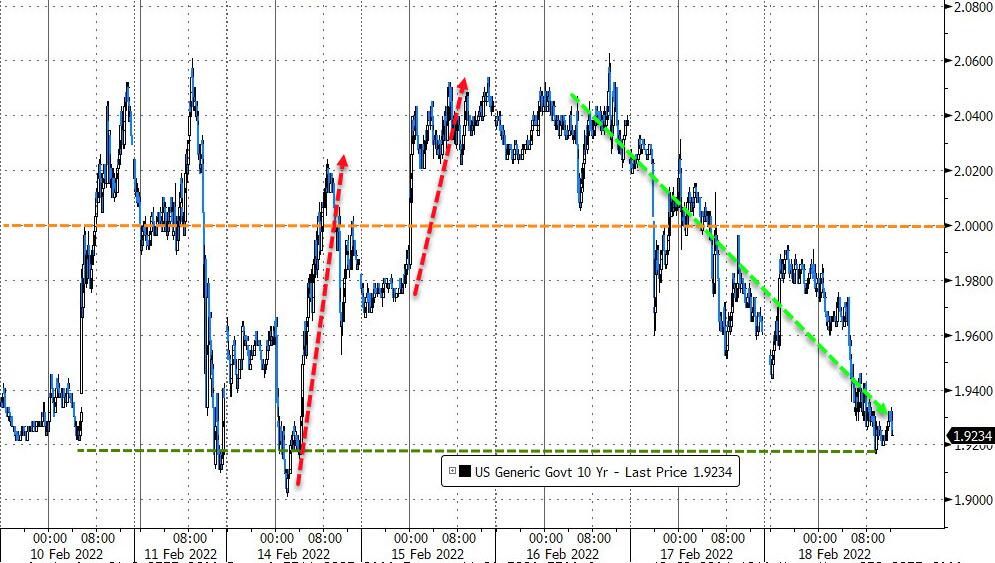
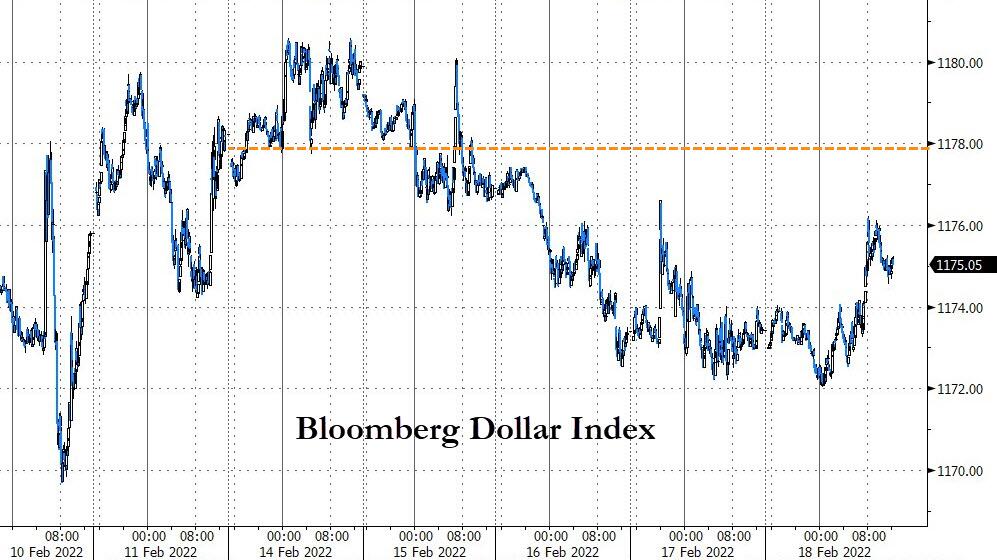
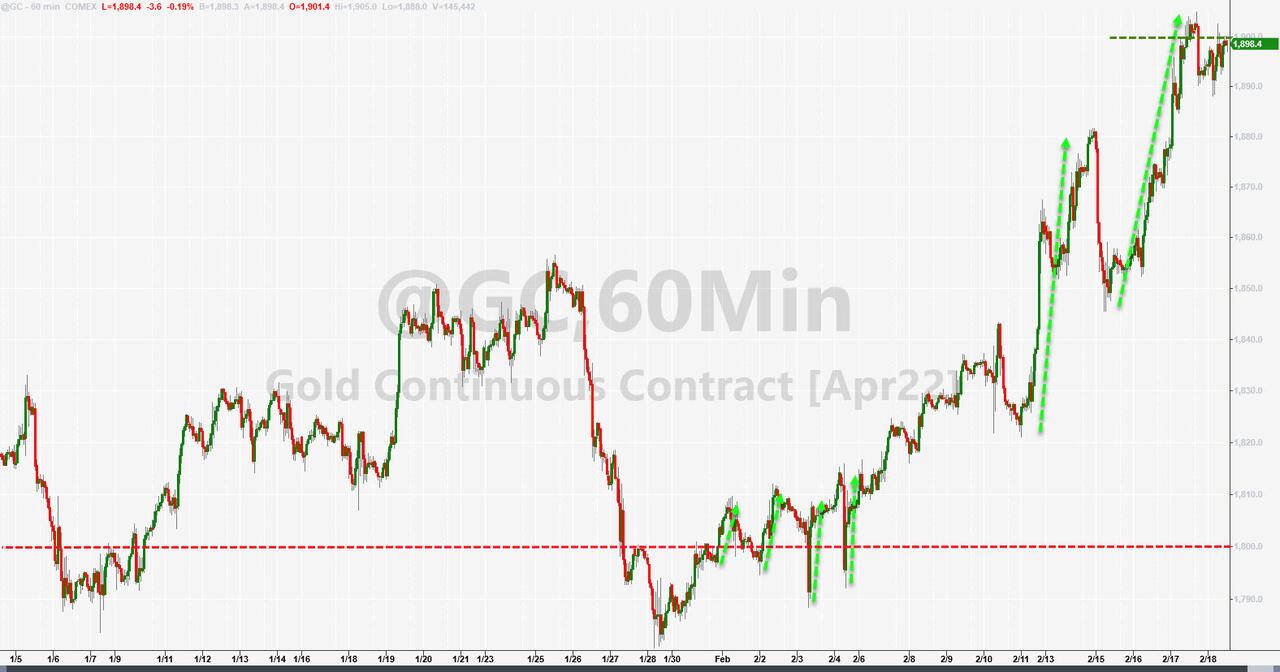
Bond yields eased with the 10-year attempting to crawl above the 2% level but failed during this session. The US Dollar advanced today but slipped for the week. Gold, while pulling back a fraction today, had a profitable 5 trading days by rising over 3%.
Our Domestic TTI (section 3) remained below its dividing line between bullish and bearish territory for the second day in a row—but enough to call an end to this current “Buy” cycle. However, that could change in a hurry.
At times, I look at other leading indicators, which can cast a light on future direction. High yield credit compared to the S&P can offer some valuable insight:
Given the fact that my Domestic TTI has dropped into bearish territory and High Yield credit has sharply decoupled from the S&P 500, I wonder if this is an indication of things to come?

Hmmm…
2. ETFs in the Spotlight
In case you missed the announcement and description of this section, you can read it here again.
It features some of the 10 broadly diversified domestic and sector ETFs from my HighVolume list as posted every Saturday. Furthermore, they are screened for the lowest MaxDD% number meaning they have been showing better resistance to temporary sell offs than all others over the past year.
The below table simply demonstrates the magnitude with which these ETFs are fluctuating above or below their respective individual trend lines (%+/-M/A). A break below, represented by a negative number, shows weakness, while a break above, represented by a positive percentage, shows strength.
For hundreds of ETF choices, be sure to reference Thursday’s StatSheet.
For this current domestic “Buy” cycle, here’s how some of our candidates have fared:
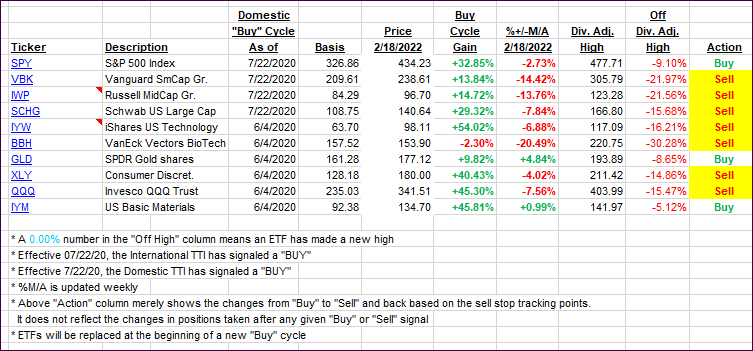
Click image to enlarge.
Again, the %+/-M/A column above shows the position of the various ETFs in relation to their respective long-term trend lines, while the trailing sell stops are being tracked in the “Off High” column. The “Action” column will signal a “Sell” once the -12% point has been taken out in the “Off High” column, which has replaced the prior -8% to -10% limits.
3. Trend Tracking Indexes (TTIs)
Our TTIs slipped with the broad market, but the Domestic one has not yet pierced its trend line enough to generate a “Sell” signal.
This is how we closed 02/18/2022:
Domestic TTI: -0.66% below its M/A (prior close -0.19%)—Buy signal effective 07/22/2020.
International TTI: +2.10% above its M/A (prior close +3.00%)—Buy signal effective 07/22/2020.
Disclosure: I am obliged to inform you that I, as well as my advisory clients, own some of the ETFs listed in the above table. Furthermore, they do not represent a specific investment recommendation for you, they merely show which ETFs from the universe I track are falling within the specified guidelines.
All linked charts above are courtesy of Bloomberg via ZeroHedge.
———————————————————-
WOULD YOU LIKE TO HAVE YOUR INVESTMENTS PROFESSIONALLY MANAGED?
Do you have the time to follow our investment plans yourself? If you are a busy professional who would like to have his portfolio managed using our methodology, please contact me directly or get more details.
Contact Ulli