- Moving the markets
Given the overall geopolitical tensions, some real and some made up, I would have expected the markets to take a steeper dive. However, the pullback was slow and steady with no panic selling, but a melt-up attempt during the last hour hit the skids.
The major indexes gave back over 1% with the S&P 500 faring the best, despite the fact that it has now dropped below its widely watched 200-day M/A by -3.44%, which is a bearish signal. Apparently, traders and algos alike chose to ignore it for the time being.
Much jawboning by the current administration about sanctions on Russian banks and wealthy individuals occupied the MSM headlines, which was repeated in solidarity by the U.K. government.
While the Russia-Ukraine conflict will occupy center stage for some time to come, it does not look to have war implications, which is why the markets remained calm, but that could change in coming weeks.
After all, there are many more items on the economic menu that have the power to affect stocks negatively. Higher interest rates, surging inflation affecting oil and food prices, along with shortages (truckers), are just a few that to me may have more of a market impact than what happens in Ukraine.
Bond yields went sideways to slightly higher, which was imitated by a directionless US Dollar, while oil prices spiked and look to be heading towards the $100 level. Gold regained the $1,900 point by advancing just a tad for the session.
See section 3 below regarding the update about our Trend Tracking Indexes (TTIs).
2. ETFs in the Spotlight
In case you missed the announcement and description of this section, you can read it here again.
It features some of the 10 broadly diversified domestic and sector ETFs from my HighVolume list as posted every Saturday. Furthermore, they are screened for the lowest MaxDD% number meaning they have been showing better resistance to temporary sell offs than all others over the past year.
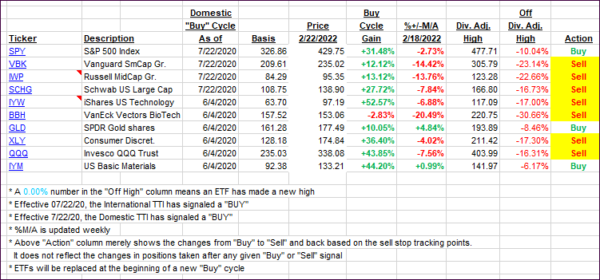
The below table simply demonstrates the magnitude with which these ETFs are fluctuating above or below their respective individual trend lines (%+/-M/A). A break below, represented by a negative number, shows weakness, while a break above, represented by a positive percentage, shows strength.
For hundreds of ETF choices, be sure to reference Thursday’s StatSheet.
For this current domestic “Buy” cycle, here’s how some of our candidates have fared:

Click image to enlarge.
Again, the %+/-M/A column above shows the position of the various ETFs in relation to their respective long-term trend lines, while the trailing sell stops are being tracked in the “Off High” column. The “Action” column will signal a “Sell” once the -12% point has been taken out in the “Off High” column, which has replaced the prior -8% to -10% limits.
3. Trend Tracking Indexes (TTIs)
As was no surprise, our Trend Tracking Indexes (TTIs) dropped with the markets. While the International one remains in bullish territory, the Domestic one dipped deeper into the red, however, it’s only positioned -1.65% below its trendline.
This level can easily be wiped out by a sudden rebound due to, say, the Ukraine crisis fading away, which could initiate a big relief rally that could propel the Domestic TTI back into bullish territory. That is why I am still holding off with issuing a “Sell” for that arena.
In my advisor practice, we already liquidated most our domestic holdings back in January and have focused more on select sector ETFs, which are performing better in this current environment. It simply means that the actual domestic “Sell” signal, whenever it occurs, will only have a minimal impact on our positions.
Sector funds can be volatile, but with worsening inflation virtually assured, that arena presents great opportunities, the likes of which I have not seen in decades.
This is how we closed 02/22/2022:
Domestic TTI: -1.65% below its M/A (prior close -0.66%)—Buy signal effective 07/22/2020.
International TTI: +0.72% above its M/A (prior close +2.10%)—Buy signal effective 07/22/2020.
Disclosure: I am obliged to inform you that I, as well as my advisory clients, own some of the ETFs listed in the above table. Furthermore, they do not represent a specific investment recommendation for you, they merely show which ETFs from the universe I track are falling within the specified guidelines.
All linked charts above are courtesy of Bloomberg via ZeroHedge.
Contact Ulli