
- Moving the markets
If you think recent market behavior was downright nutty, nonsensical, and non-directional, you are not only correct, but you are also not alone.
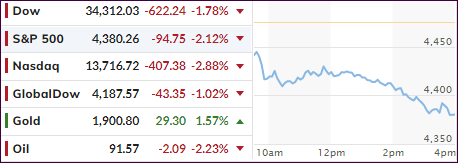
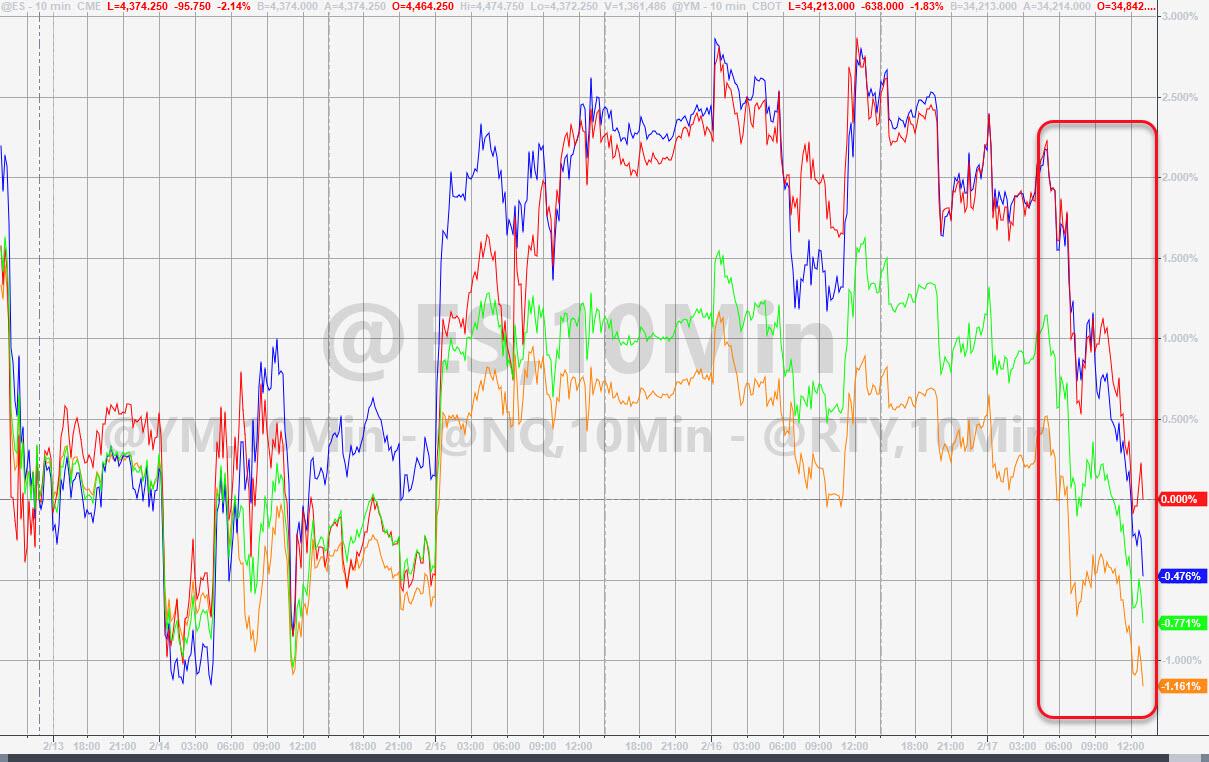
After Tuesday’s relief bounce, and yesterday’s comeback, traders were disappointed today that there was no follow-through buying, but also that the bears emerged full force and slammed the major indexes back to a level last seen the end of January.
The alleged conflict between Russia and Ukraine was pushed hard by MSM, with no evidence provided, as tension at their border impacted market sentiment and pushed our main directional indicator (TTI-section 3 below) back into the red—though by only a fraction of a percent.
I think that other geopolitical issues like Canada’s freezing of bank accounts, the US economy slowing (higher jobless claims and tumbling housing starts) and the potential of hyperinflation contributed considerably to today’s market spanking.
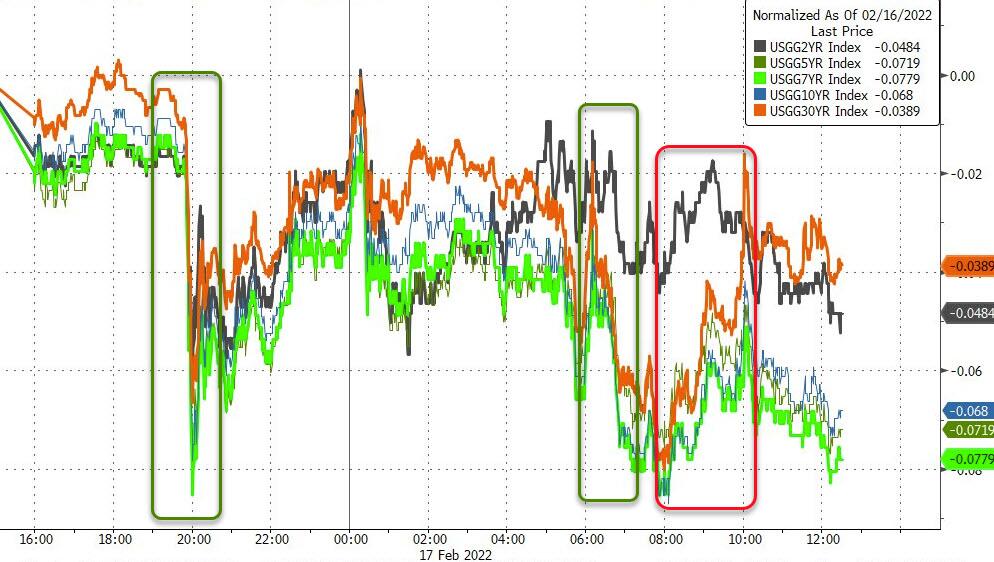
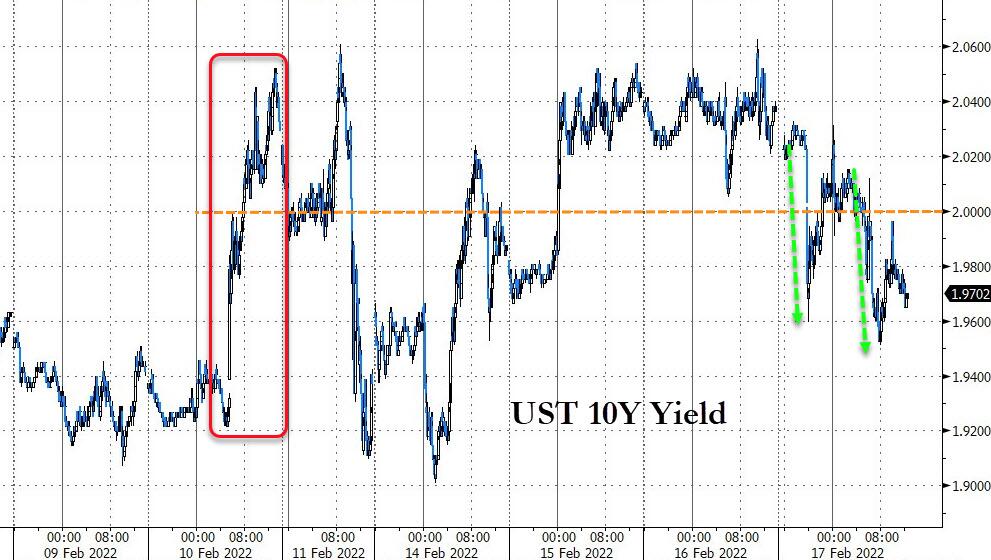
It turned out to be the worst day of the year for equities with all sectors puking evenly, however, SmallCaps took the lead and dumped -3.27%. Bond yields were down again, with the 10-year dropping back below its 2% level.
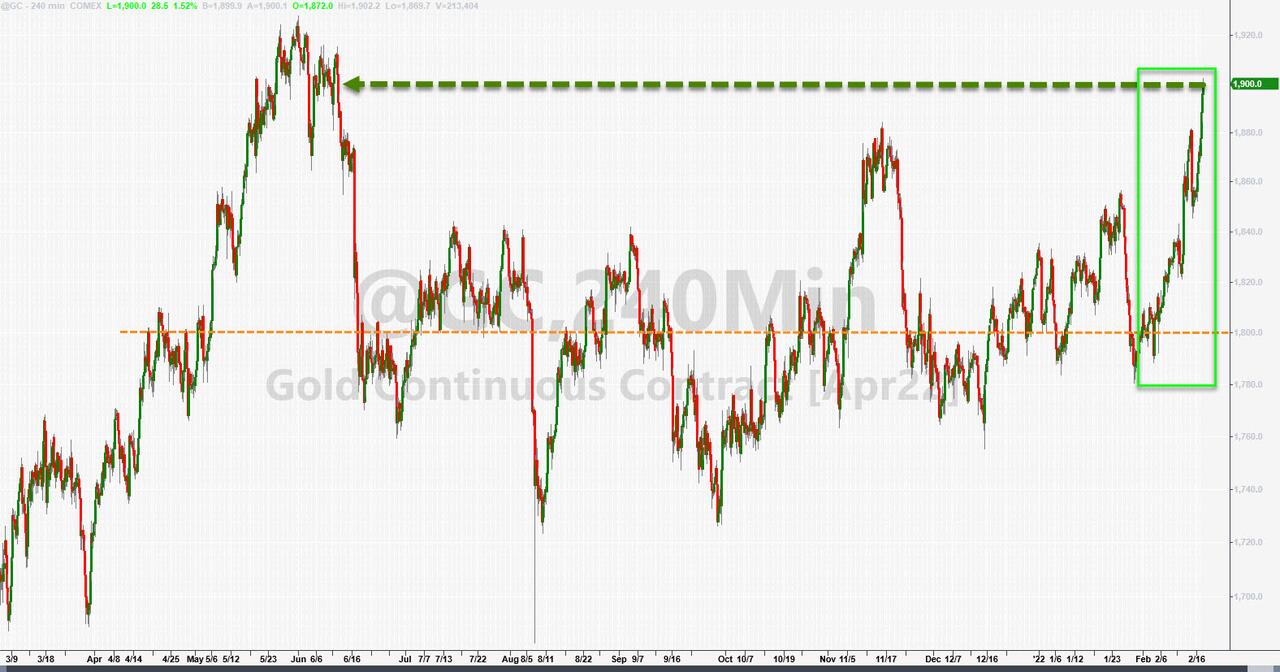
The shining star of the day was gold, which added a solid +1.54% to reclaim its $1,900 level by a tad and reached a point last seen in June 2021.
The market behavior of the recent past, pushing our Trend Tracking Index (TTI) in and out of bullish territory, is a sign to me that we are nearing an inflection point, meaning a major change in direction (bearish) has become a distinct possibility. Even ZH pointed to this bon mot, which seems to support my thoughts:
As Bloomberg’s Ven Ram noted, the Warren Buffett indicator – Total stock market capitalization divided by GDP – suggests that the recent frenzy that drove stock valuations to astronomical highs is yet to deflate fully.
Exactly.
2. ETFs in the Spotlight
In case you missed the announcement and description of this section, you can read it here again.
It features some of the 10 broadly diversified domestic and sector ETFs from my HighVolume list as posted every Saturday. Furthermore, they are screened for the lowest MaxDD% number meaning they have been showing better resistance to temporary sell offs than all others over the past year.
The below table simply demonstrates the magnitude with which these ETFs are fluctuating above or below their respective individual trend lines (%+/-M/A). A break below, represented by a negative number, shows weakness, while a break above, represented by a positive percentage, shows strength.
For hundreds of ETF choices, be sure to reference Thursday’s StatSheet.
For this current domestic “Buy” cycle, here’s how some of our candidates have fared:
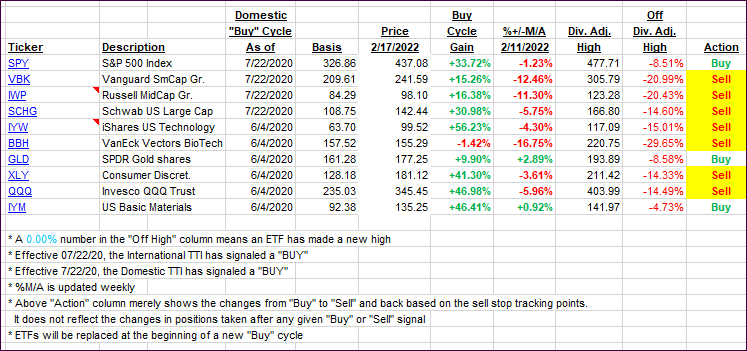
Click image to enlarge.
Again, the %+/-M/A column above shows the position of the various ETFs in relation to their respective long-term trend lines, while the trailing sell stops are being tracked in the “Off High” column. The “Action” column will signal a “Sell” once the -12% point has been taken out in the “Off High” column, which has replaced the prior -8% to -10% limits.
3. Trend Tracking Indexes (TTIs)
Our TTIs dropped with the major indexes with the Domestic one now again having broken below its trend line. Again, I need to see a bit more staying power, or a sharp drop, before declaring this current Buy cycle to be over.
This is how we closed 02/17/2022:
Domestic TTI: -0.19% below its M/A (prior close +1.63%)—Buy signal effective 07/22/2020.
International TTI: +3.00% above its M/A (prior close +4.11%)—Buy signal effective 07/22/2020.
Disclosure: I am obliged to inform you that I, as well as my advisory clients, own some of the ETFs listed in the above table. Furthermore, they do not represent a specific investment recommendation for you, they merely show which ETFs from the universe I track are falling within the specified guidelines.
All linked charts above are courtesy of Bloomberg via ZeroHedge.
Contact Ulli