
ETF Tracker StatSheet
You can view the latest version here.
DOMESTIC TREND TRACKING INDEX (TTI) CROSSES INTO BULLISH TERRITORY
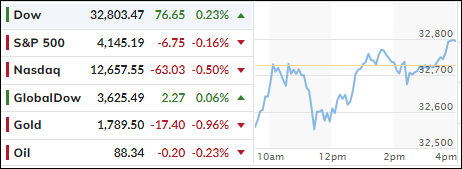
- Moving the markets
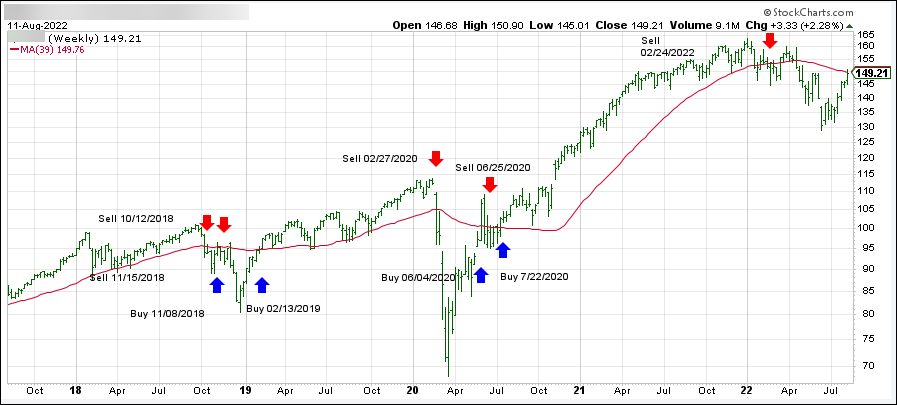
During yesterday’s morning rebound, my proprietary Domestic Trend Tracking Index (TTI) peeked above its long-term trend line into bullish territory. Weakening afternoon momentum pulled the index back below its line, but I took the opportunity to already ease back into the equity market.
Today’s follow through finally pushed the TTI into bullish territory for the first time since our effective “Sell” signal on 2/24/2022. See section 3 below for more details.
This may turn out to be the point in time where a bear market rally morphs into a new bull market with the only question being as to how long this condition will last.
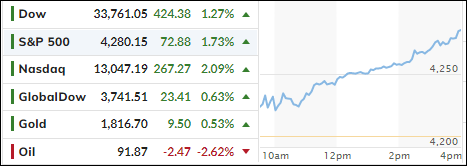
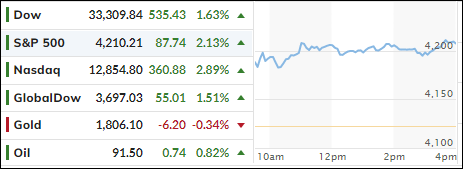
All this positive action, with the S&P 500 now having risen for the fourth straight week, was based on nothing but hope that the Fed will soon have to pivot towards a lowering of the interest rates, as the economy worsens.
Wednesday’s 8.5% CPI reading was heralded as a defining moment, in that we may have already reached peak inflation, an assumption that will turn out to be as wrong as the year long view that inflation was transitory. However, for the time being, traders and algos alike are content riding the bullish bandwagon.
Added ZeroHedge:
Today’s melt up was especially memorable, as it not only cemented the Nasdaq’s new bull market, but sent the broader market up more than 3% for the week, its 4th consecutive week of gains (starting with the week when Powell announced “we’re at neutral”) the longest stretch of gains since November…
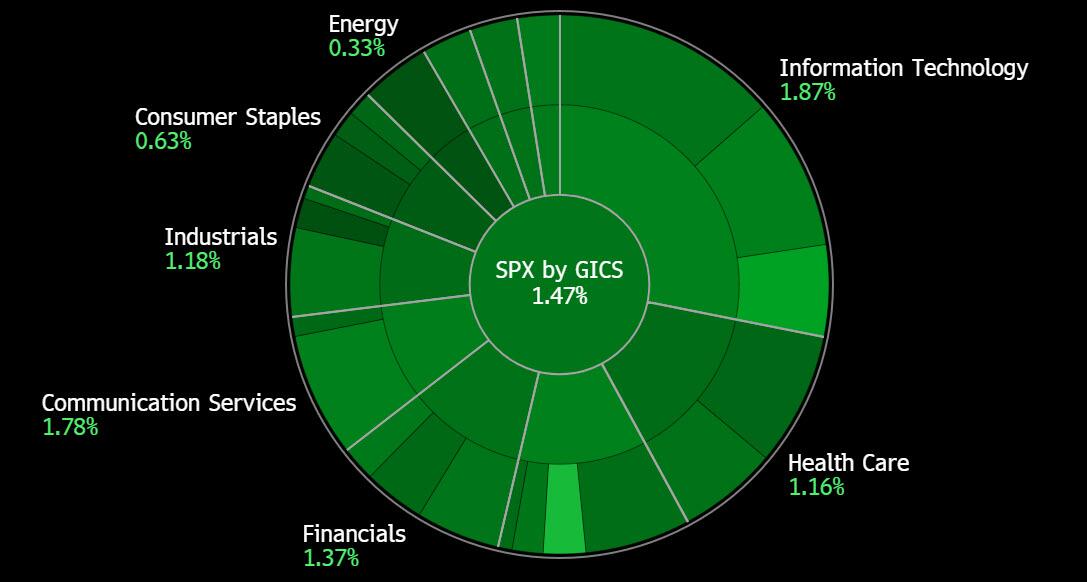
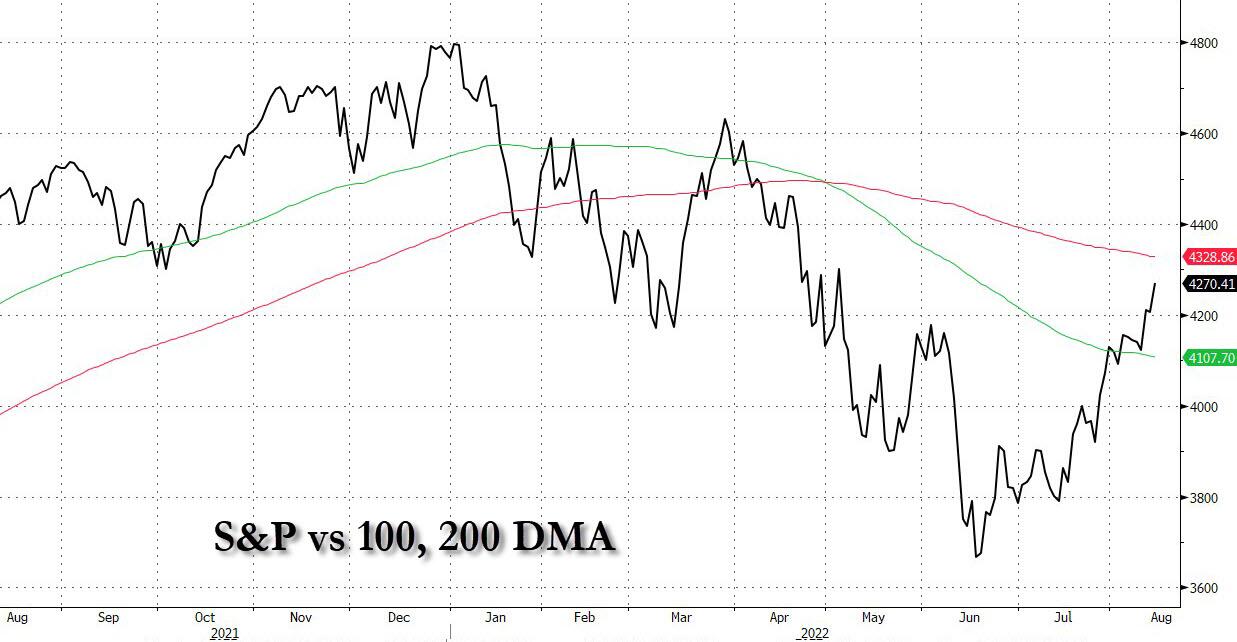
As a result, we saw a sea of green across every sector with SmallCaps as well conquering their long-term trend line. Just as much attention will be given once the S&P 500 crosses its widely followed 200-day M/A, which will only take a gain of about 1.2%.
From a big picture view, ZeroHedge is spot on with this observation:
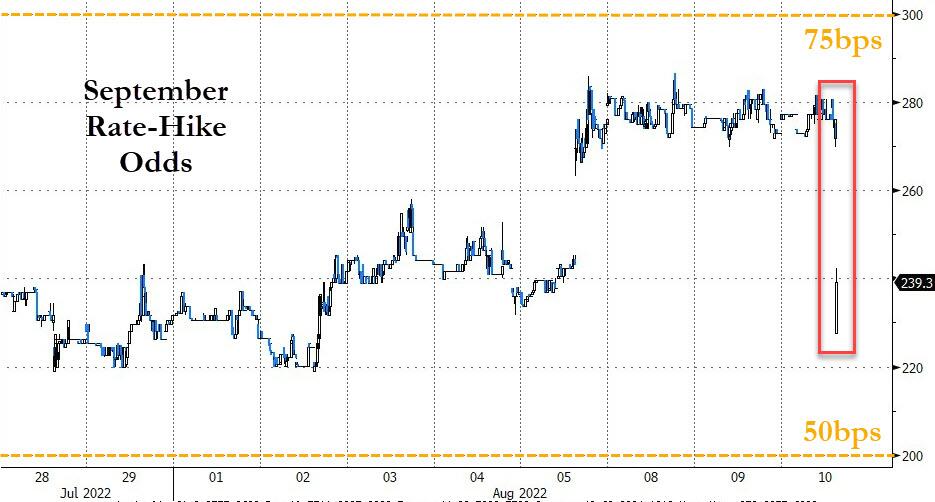
Yet for all the melt up euphoria, a casual look at what lies ahead brings up storm clouds because unless earnings rebound – and with margins collapsing that’s unlikely – the markets will need to see multiple expansion, which however is unlikely unless real yields drop turn negative again…which however is especially unlikely since the Fed will have to aggressively step in and contain the market’s froth which has undone the tightening from the latest 150bps of Fed rate hikes…
In other words, don’t count on the Fed of not making another hawkish move, or two, something that the various Fed governors have frequently confirmed, as recently as a week ago, but which seems to have been conveniently forgotten.
If you decide to participate in this market, I can only advise you to do so with a clearly defined exit strategy, because we are living in an economic and political environment where things could reverse at a moment’s notice.
Read More