Front Running The CPI Report

Ulli Market Commentary Contact

[Chart courtesy of MarketWatch.com]

  1. Moving the markets

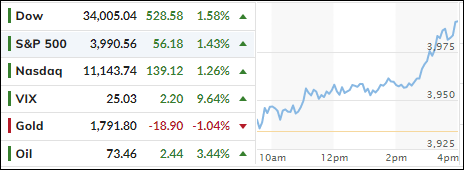
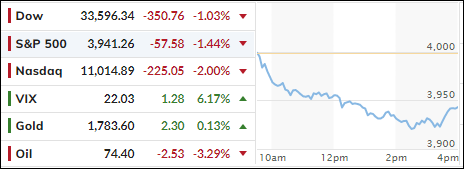
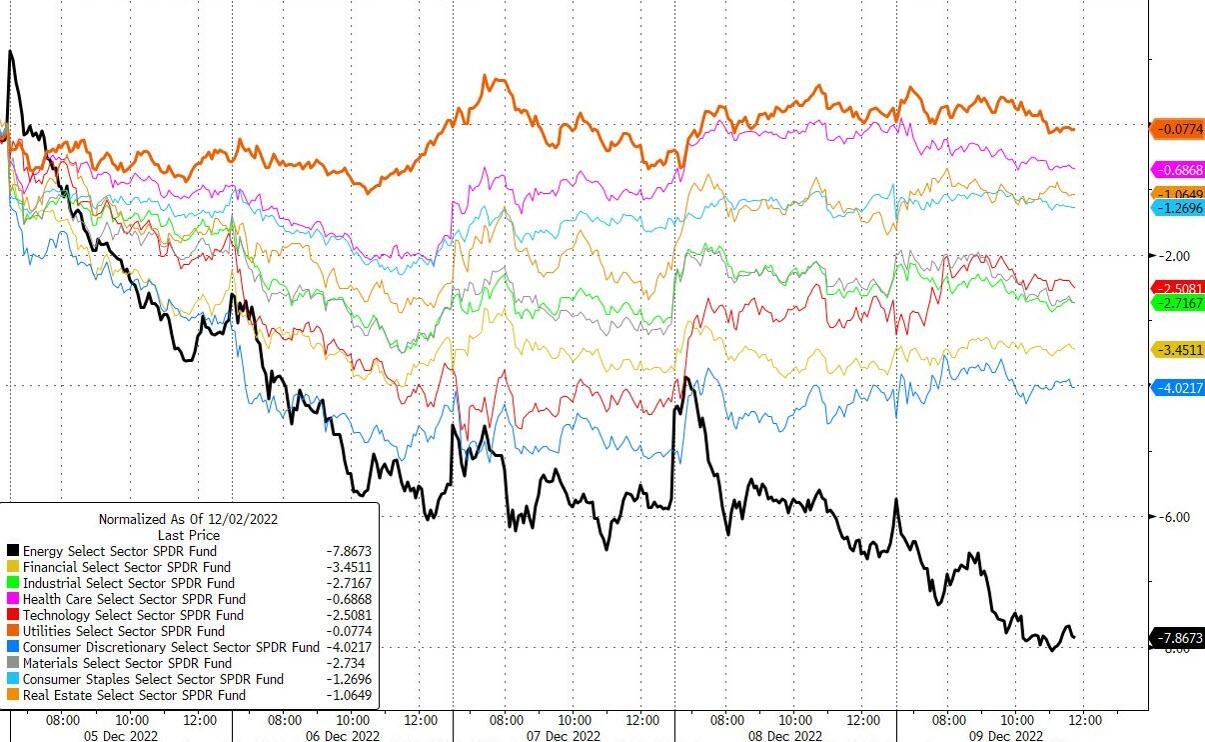
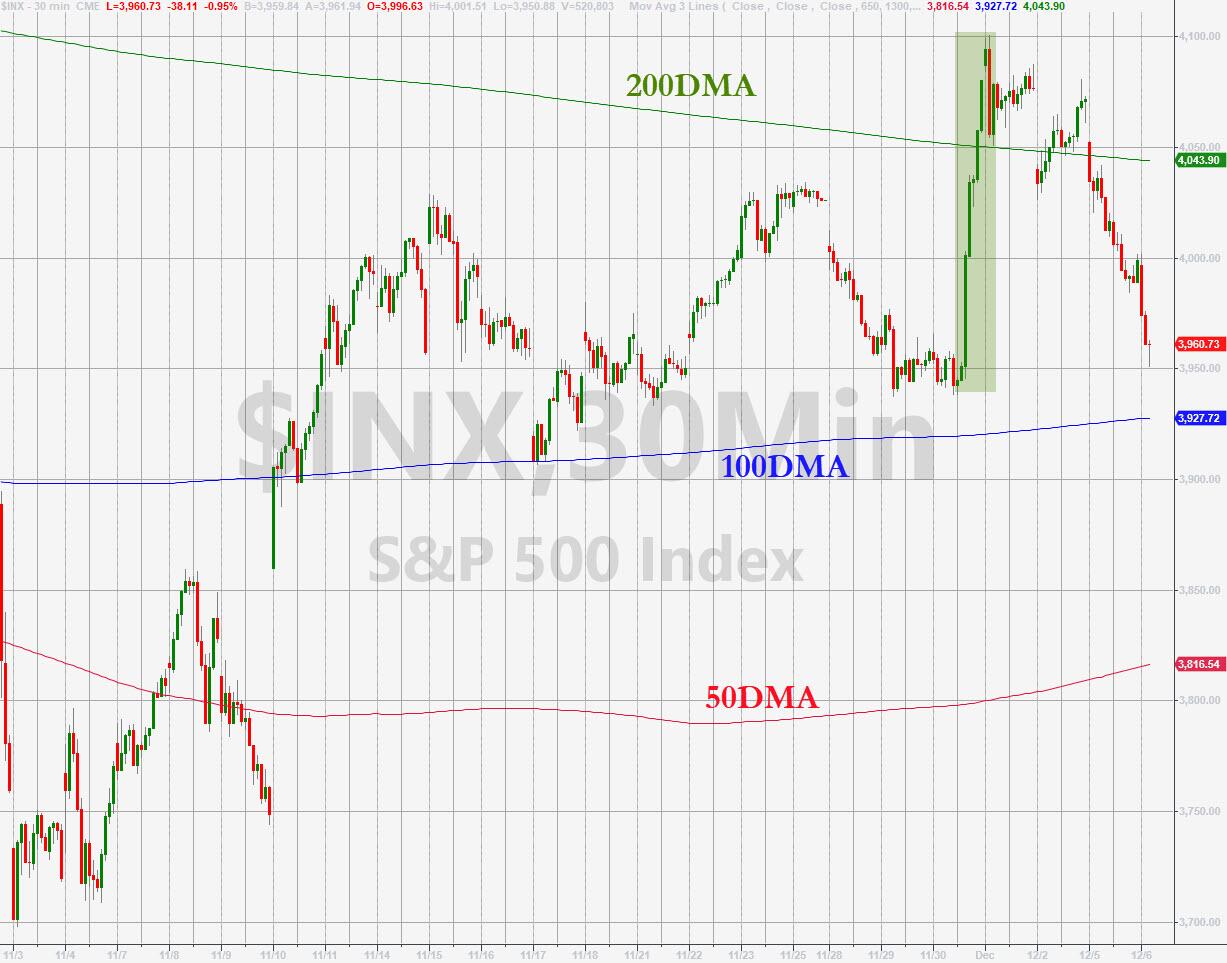
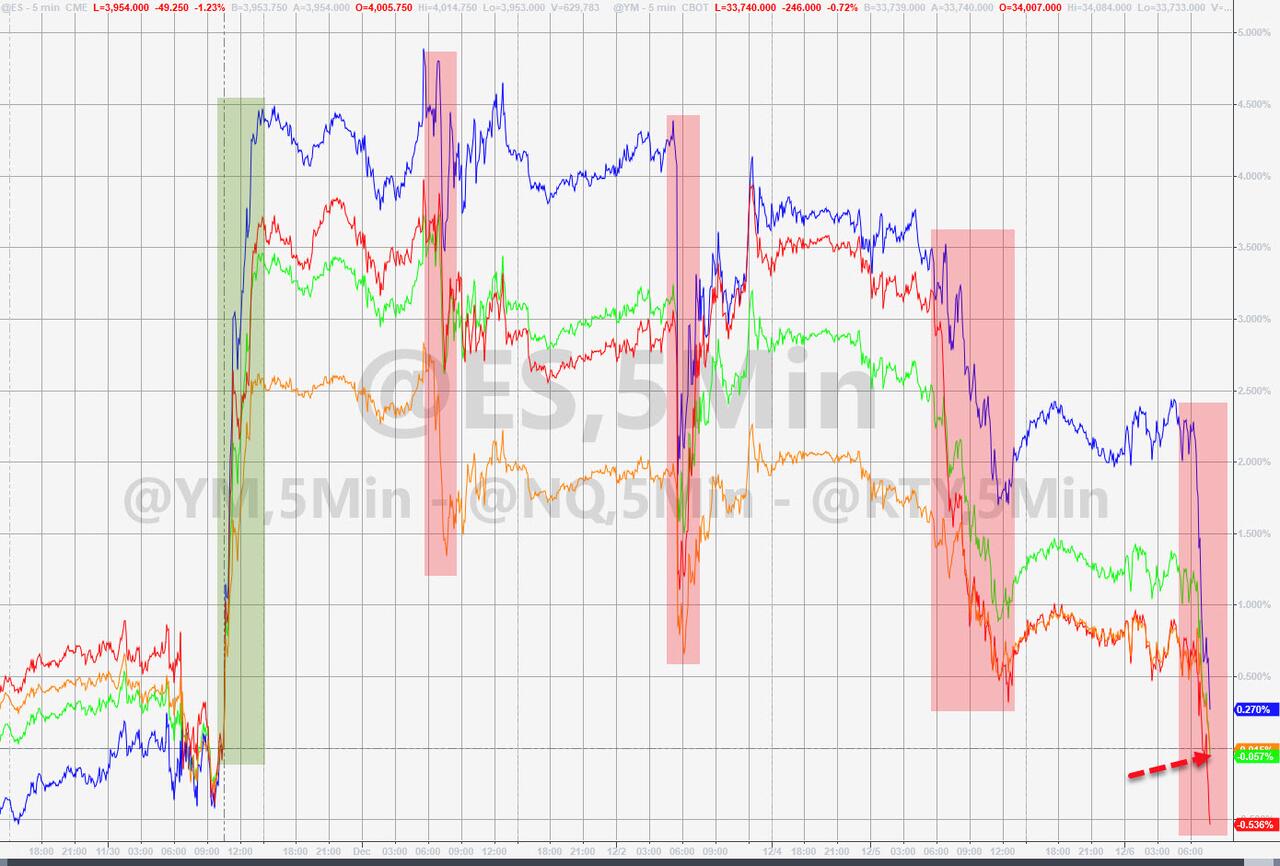
While moderate bullish sentiment dominated market direction throughout the day, traders decided to shift upward momentum into overdrive during the last hour of the session, thereby pushing equities sharply higher.

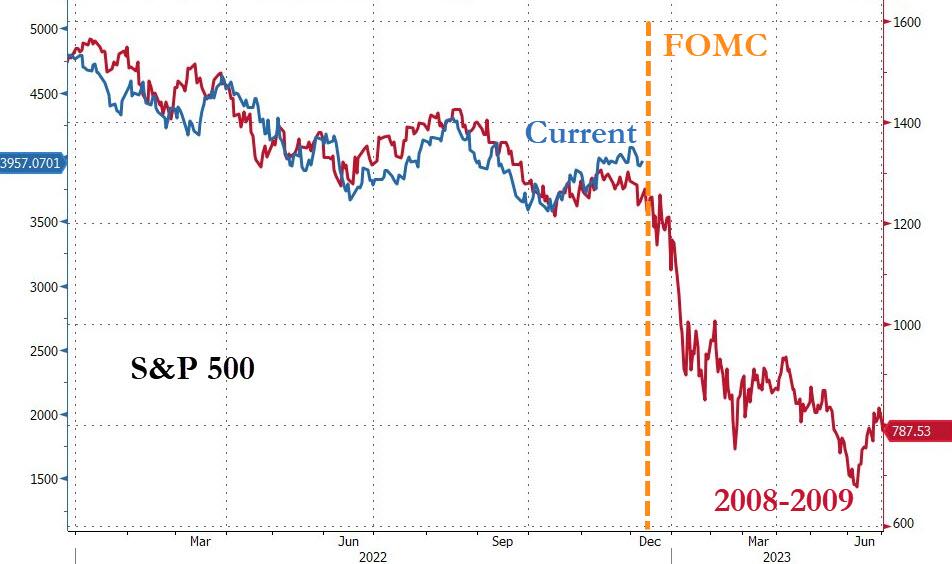
The major indexes sported solid gains in the end, indicating that tomorrow’s CPI number is expected to come in lower than had been assumed. Should that be the case, we will see the bullish theme grow stronger and provide us with the much longed-for Santa Claus rally.

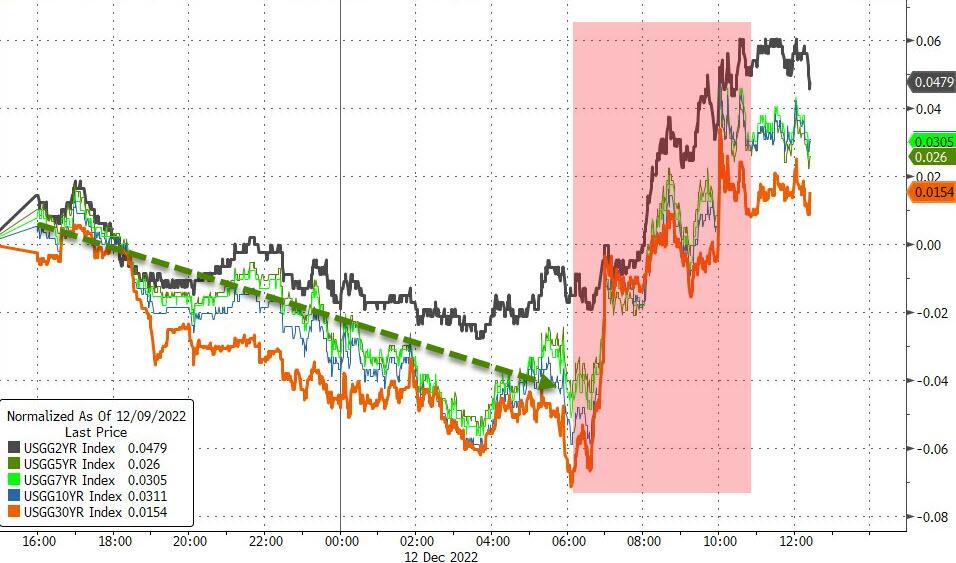
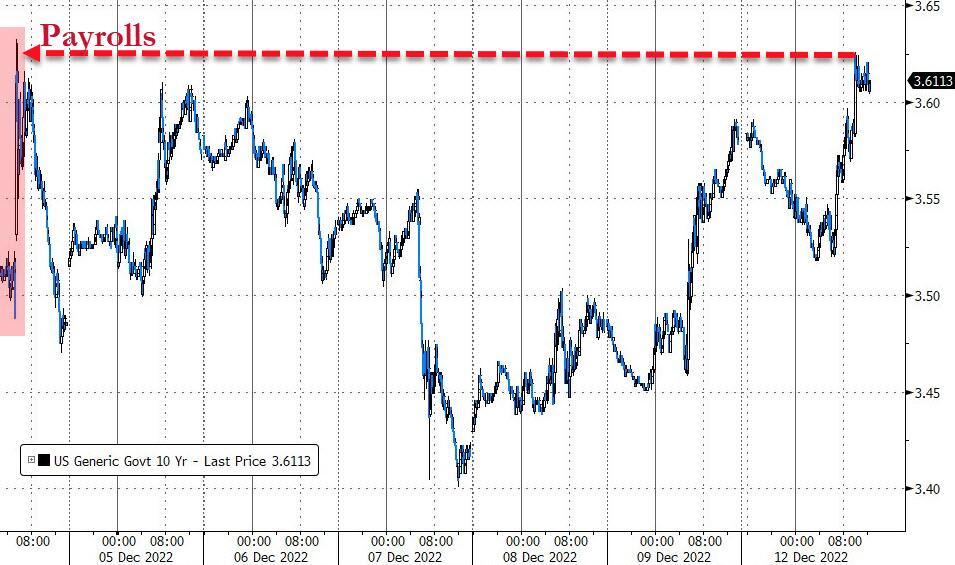
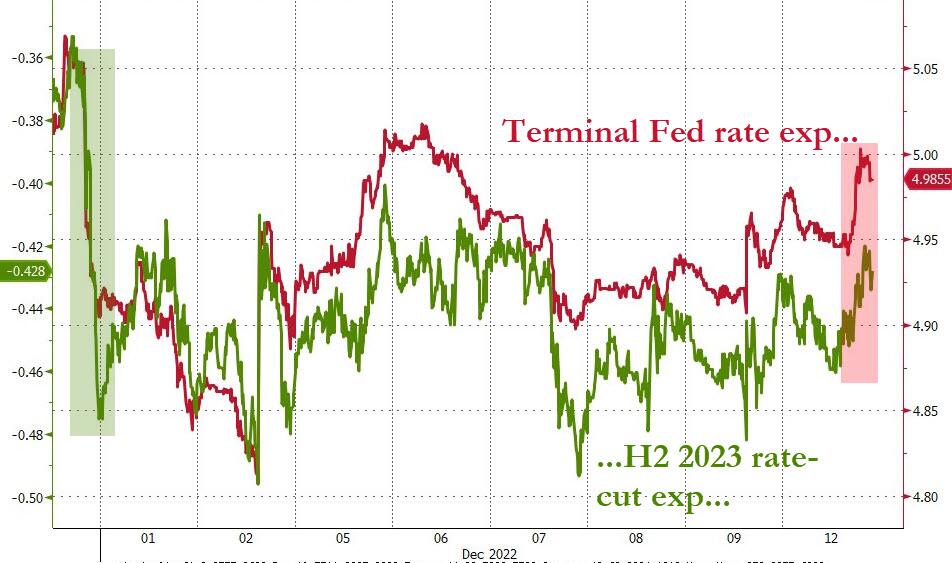
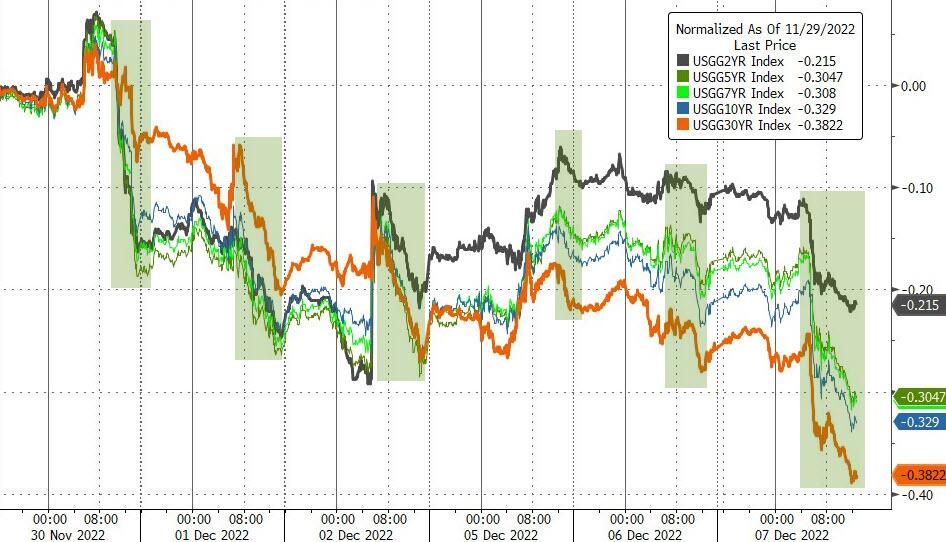
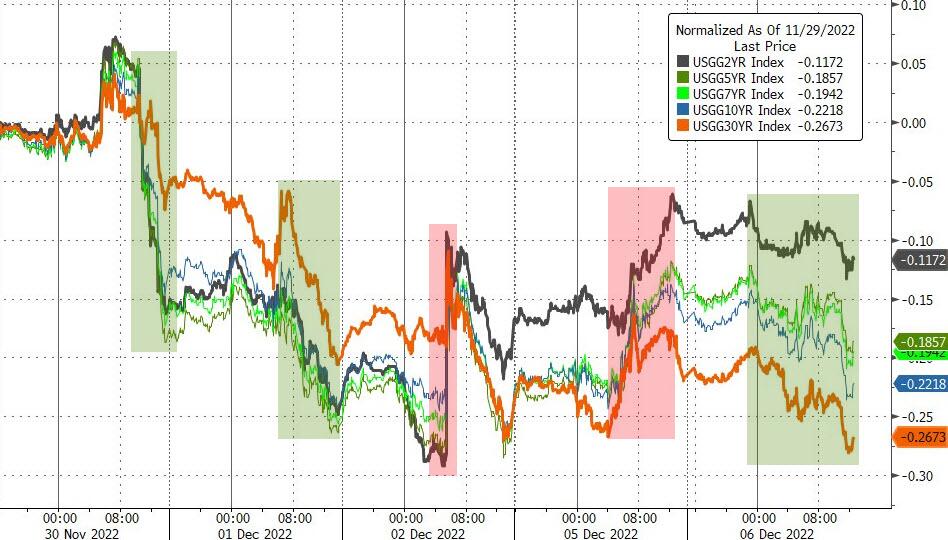
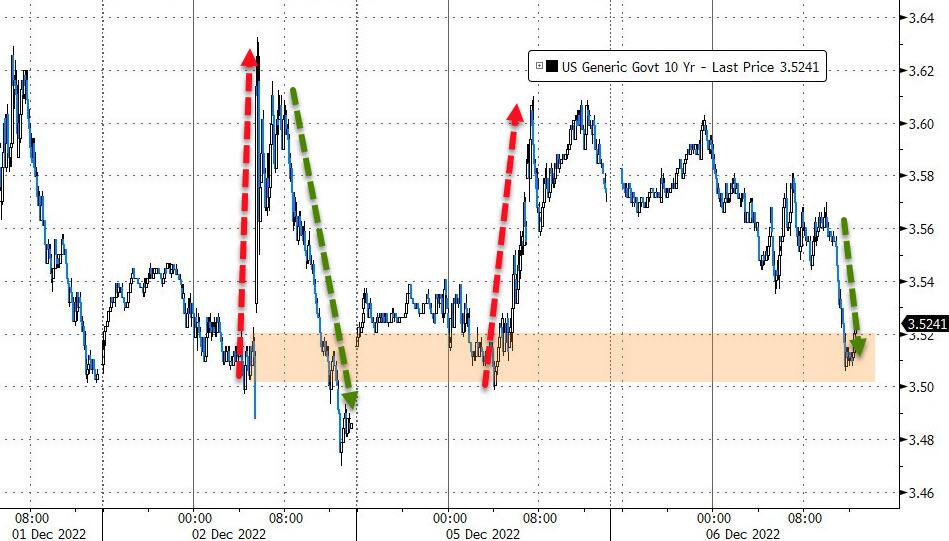
Bond yields jumped with the 10-year adding 12 bps to close at 3.62%. Rate trajectory expectations rose, as ZeroHedge pointed out, with the terminal rate now back up to 5%.

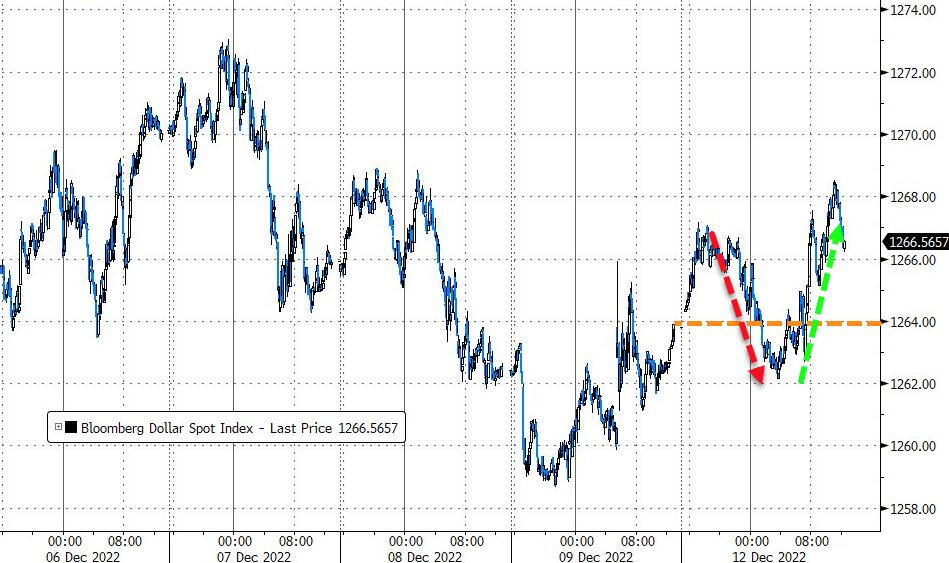
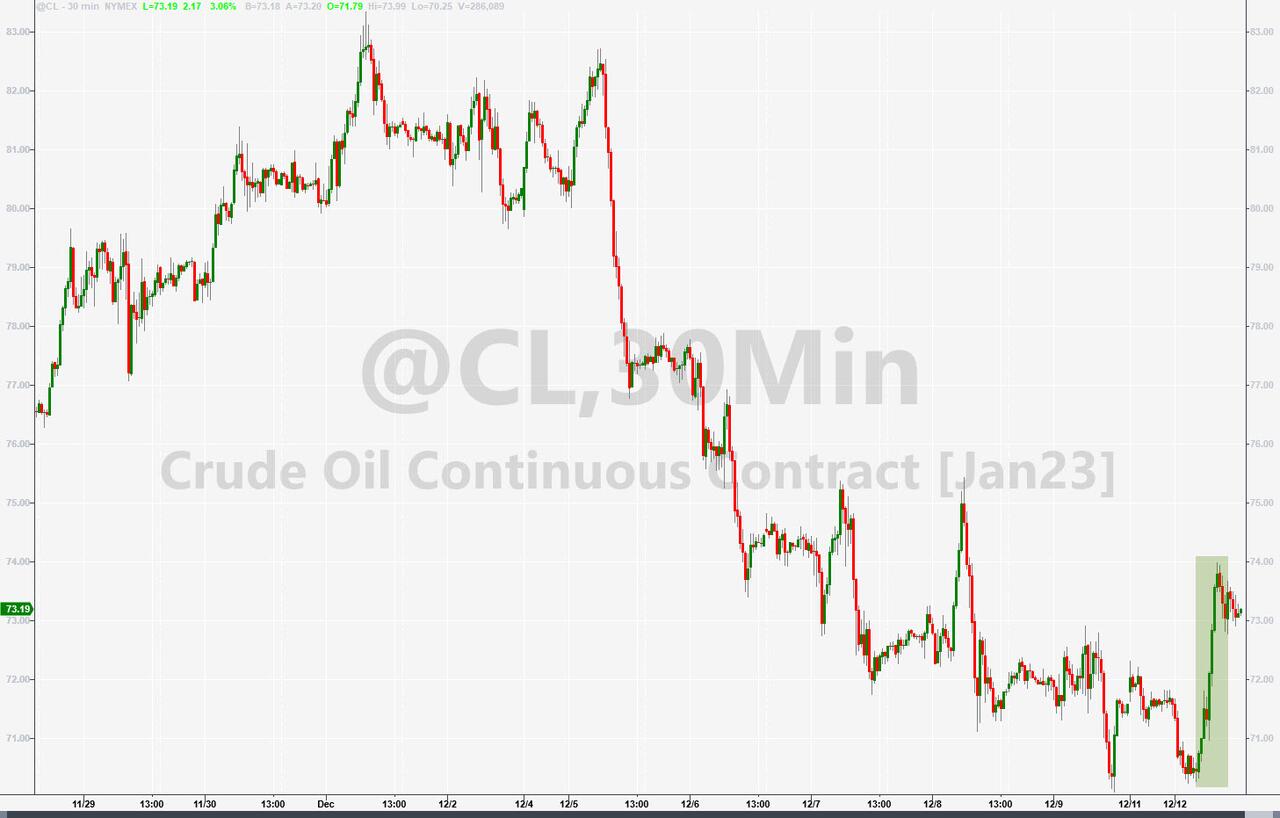
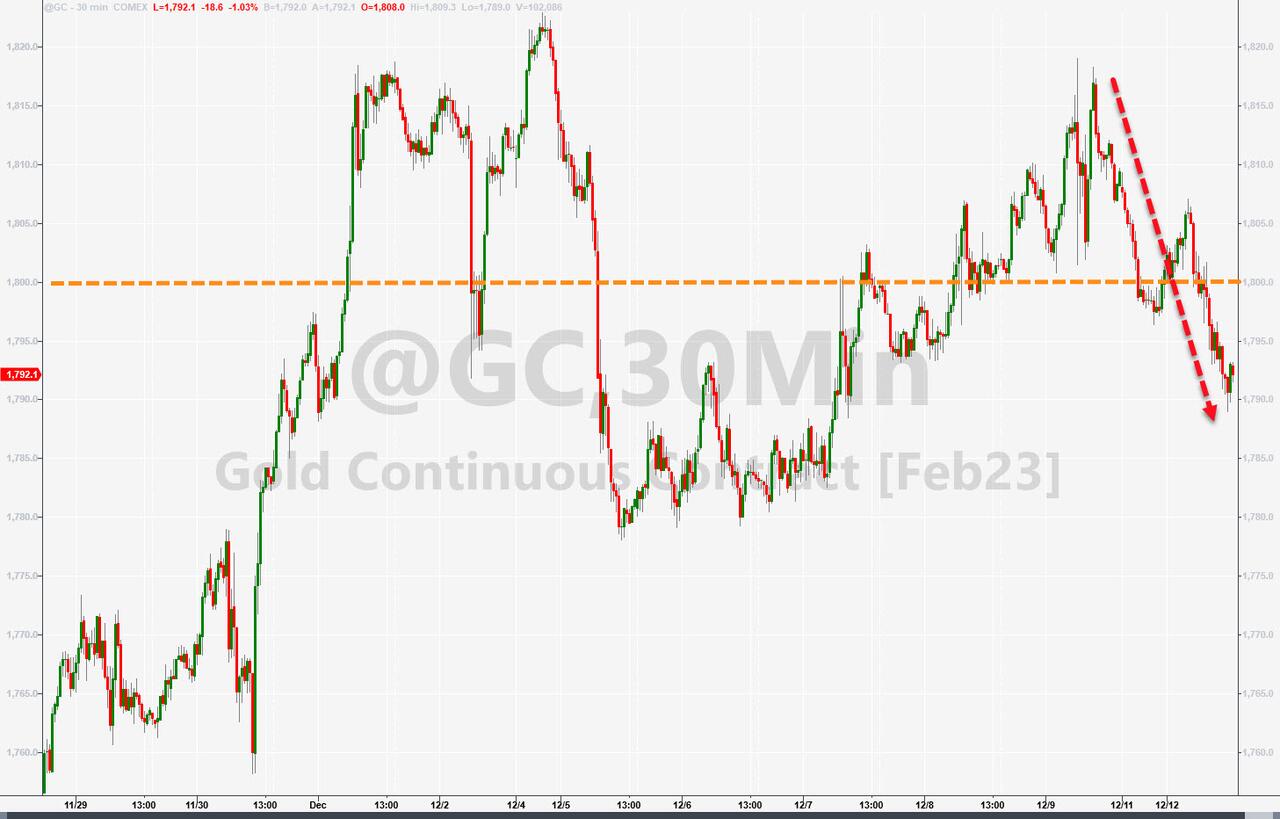
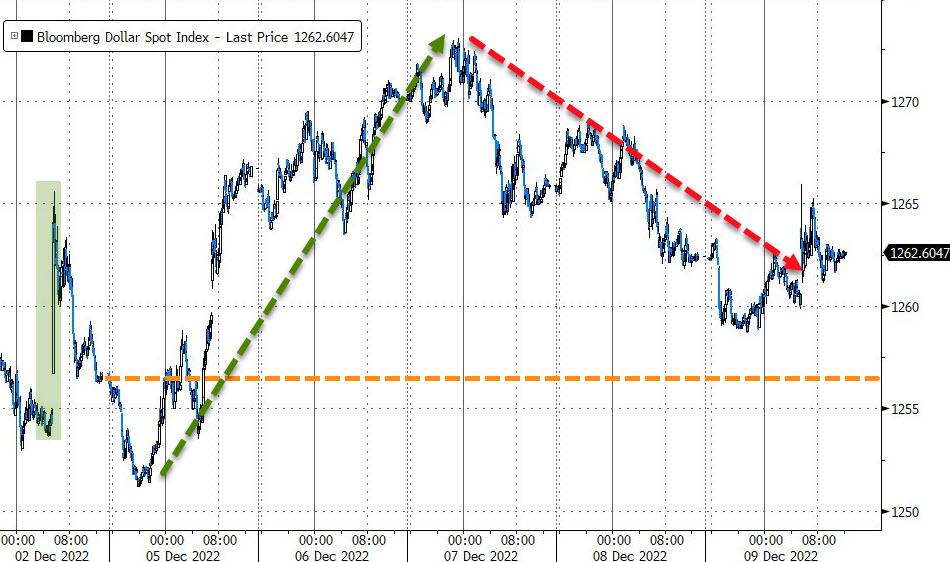
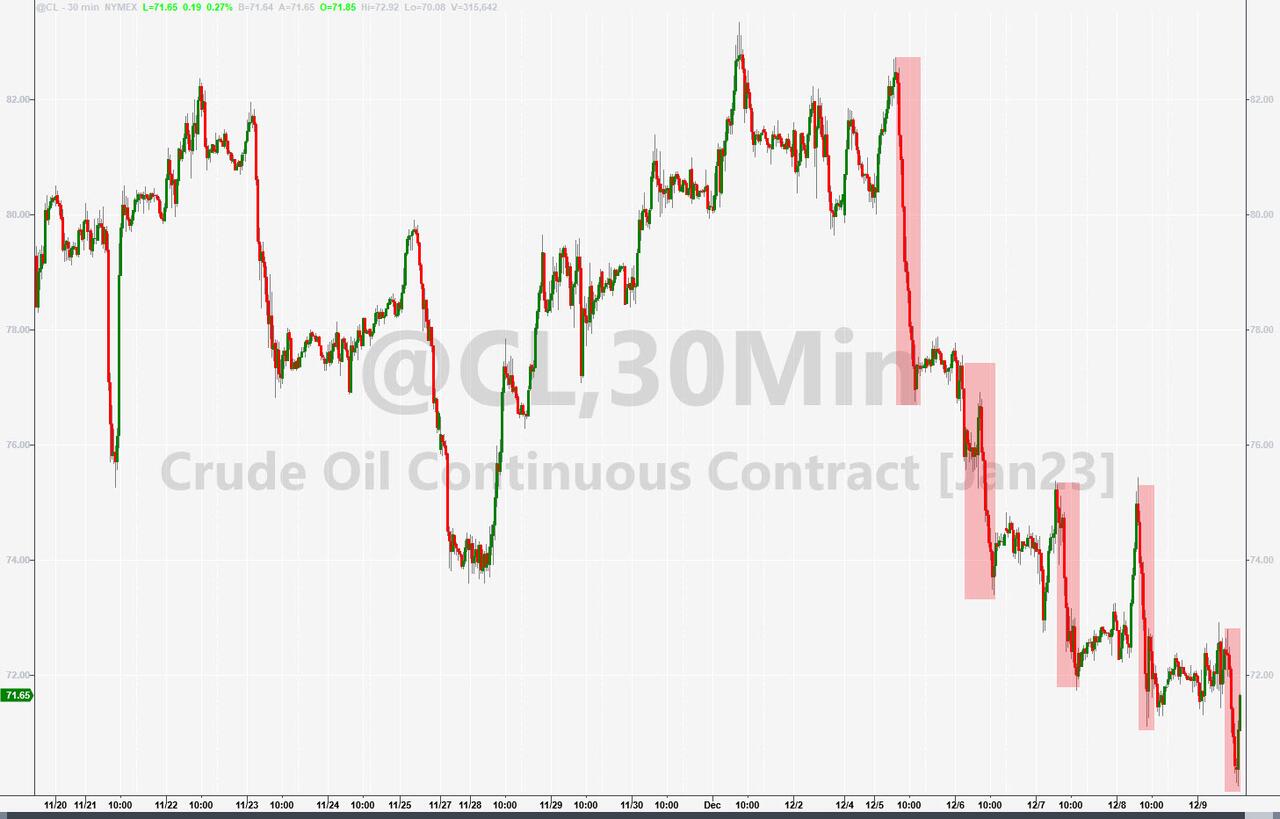
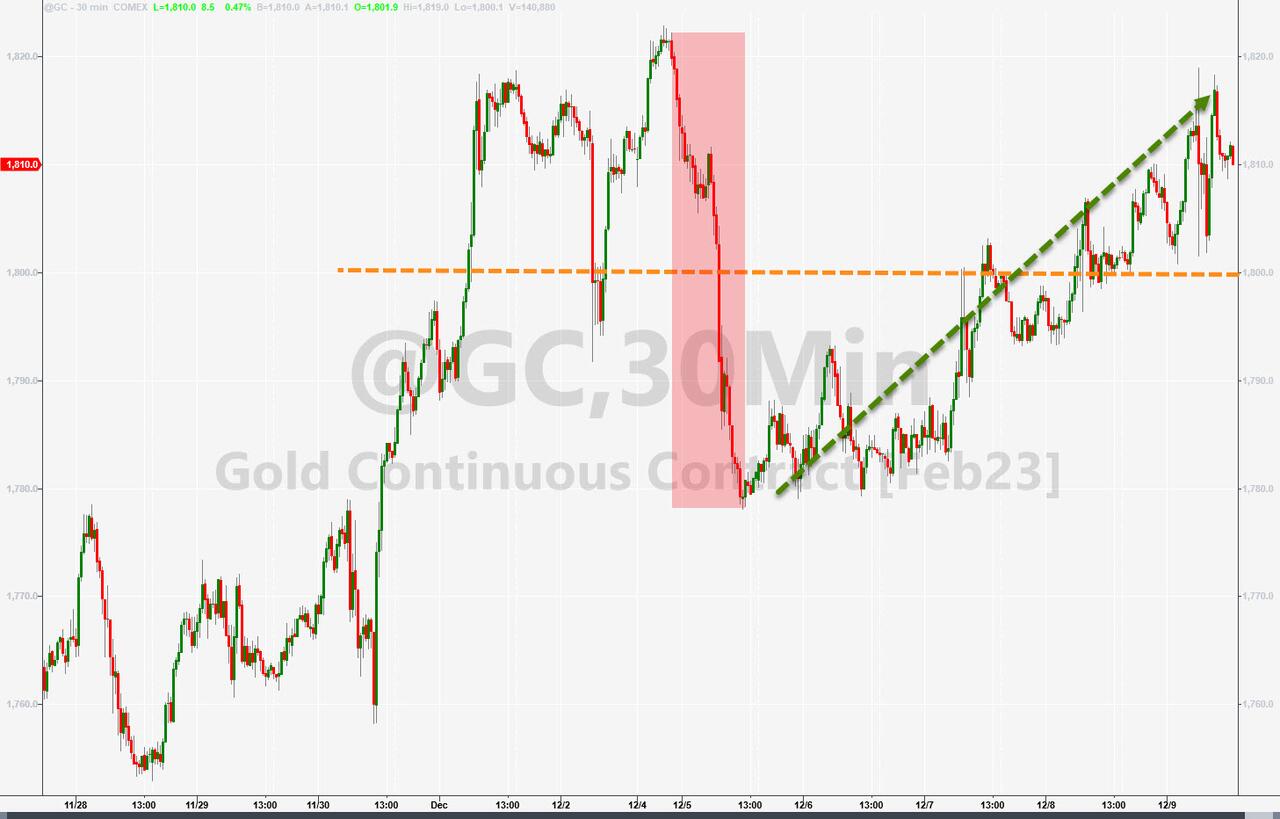
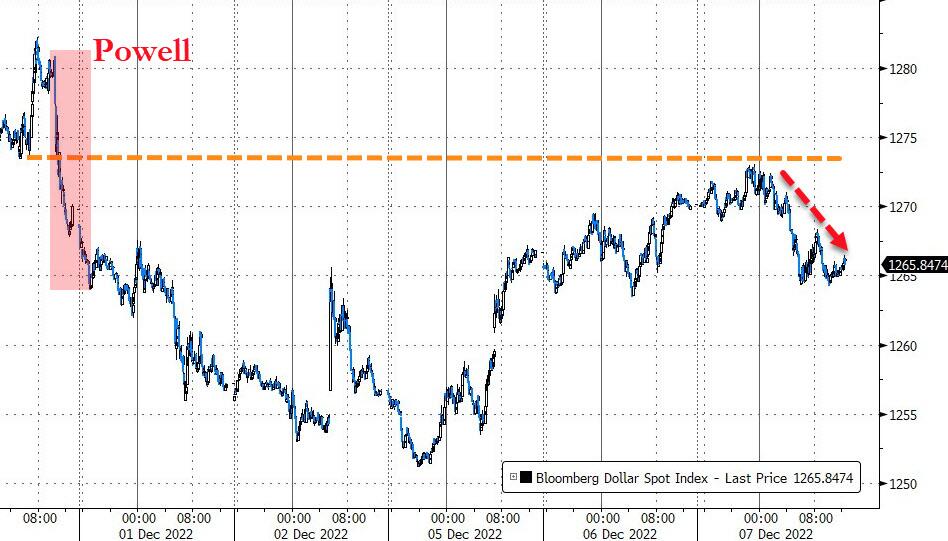
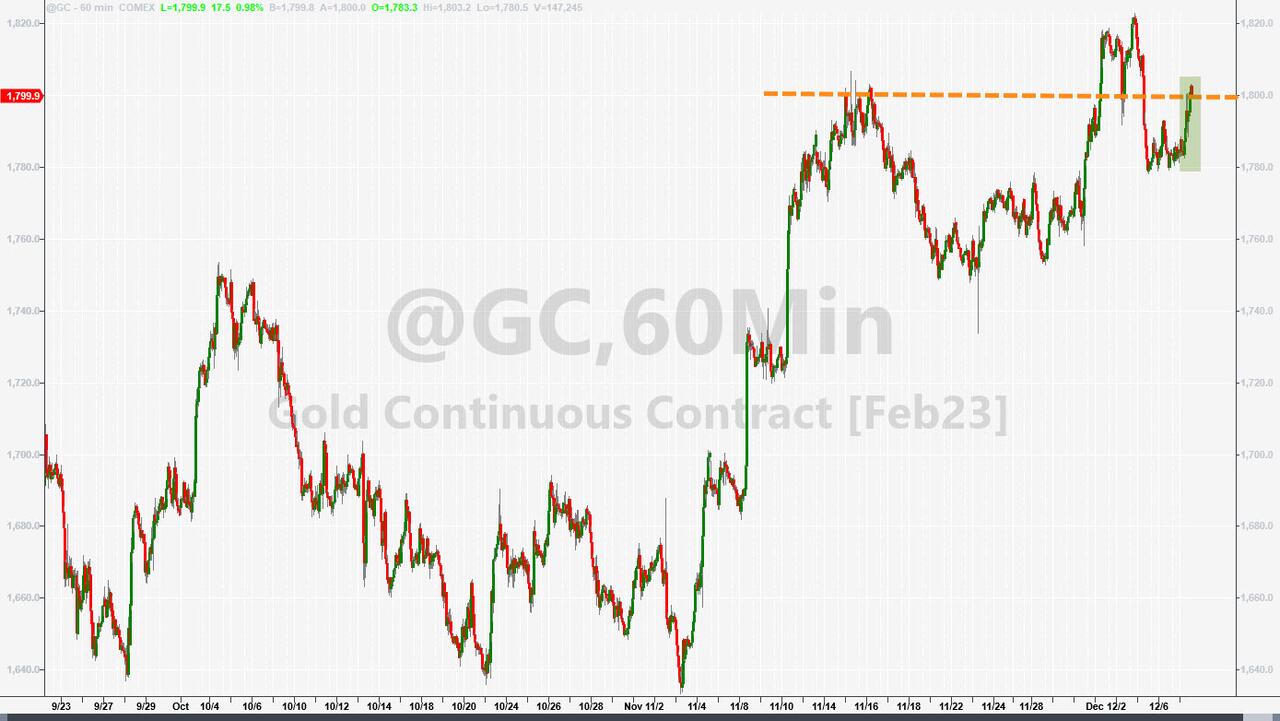
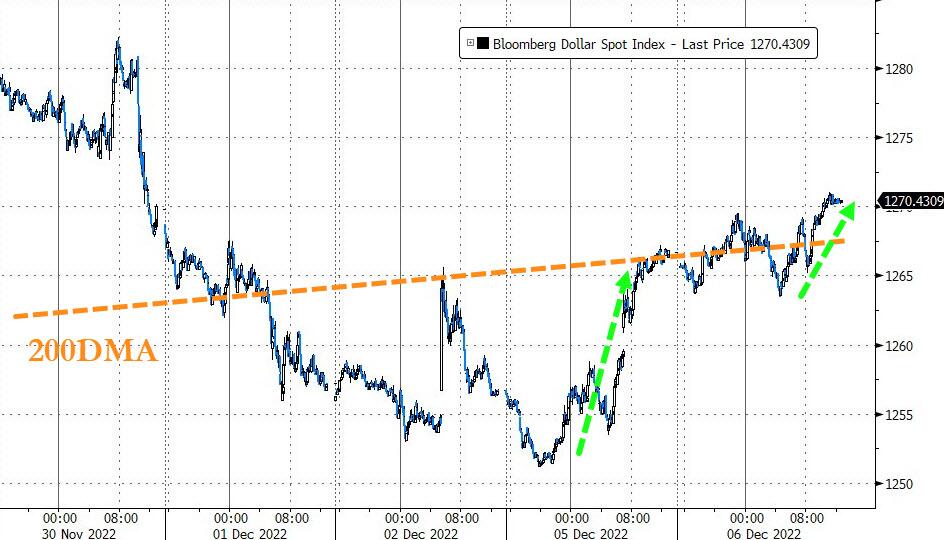
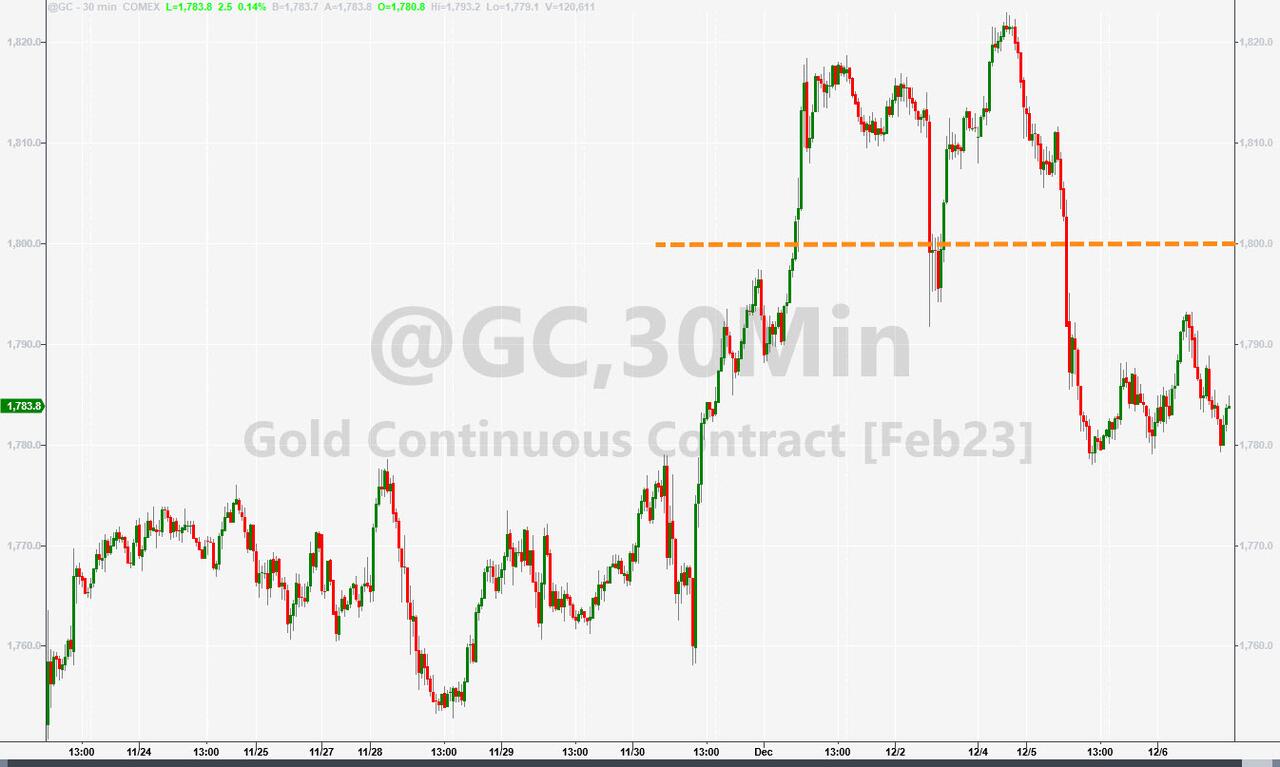
The US Dollar rode the rollercoaster but managed to eke out a small gain, Crude Oil rebounded after the recent drubbing, and Gold lost its $1,800 level by a small margin.   

All eyes are on tomorrow’s CPI release and Wednesday’s FOMC meeting, after which Fed head Powell will likely again elaborate his hawkish stance—higher rates for longer—which may not go over well with the Wall Street crowd, because they have almost desperately anticipated a pause or pivot in rate policy.

Read More

ETFs On The Cutline – Updated Through 12/09/2022

Ulli ETFs on the Cutline Contact

Below, please find the latest High-Volume ETF Cutline report, which shows how far above or below their respective long-term trend lines (39-week SMA) my currently tracked ETFs are positioned.

This report covers the HV ETF Master List from Thursday’s StatSheet and includes 312 High Volume ETFs, defined as those with an average daily volume of more than $5 million, of which currently 133 (last report: 192) are hovering in bullish territory. The yellow line separates those ETFs that are positioned above their trend line (%M/A) from those that have dropped below it.

Take a look:                                                                   

The HV ETF Master Cutline Report

In case you are not familiar with some of the terminology used in the reports, please read the Glossary of Terms. If you missed the original post about the Cutline approach, you can read it here.      

ETF Tracker Newsletter For December 9, 2022

Ulli ETF Tracker Contact

ETF Tracker StatSheet          

You can view the latest version here.

ENDING THE WEEK TO THE DOWNSIDE

[Chart courtesy of MarketWatch.com]

  1. Moving the markets

Yesterday’s rebound now appears to have been an outlier, as the major indexes, following an early bounce, lost their mojo and dropped into the close ending a week that turned out to be the worst since September. The S&P 500 lost 3.4% during this pullback.

Worries over continued rate hikes remained at the center of attention, primarily due to next week’s CPI print, and the Fed’s announcement on the magnitude of its next increase. Expectations are for +0.5%, but the dreaded +0.75% is also on traders’ minds.

Casting a shadow on the upcoming CPI number was today’s Producer Price Index (PPI), because it came in at +0.3% last month (+7.4% YoY), which was higher than the hoped for +0.2% MoM, but leaving the index at its lowest level since May 2021. The core PPI (without Food and Energy) soared +0.4% MoM, or twice the expectations.

Despite those increases, short-term inflation expectations dropped 4.6% to its lowest level since September 2021. However, that number could change quickly, once we have more clarity once next Tuesday’s CPI release.

Looking at the big picture this week, there simply was no place to hide as all sectors ended in the red led by Energy with a 7.8% plunge. Bond yields rose sharply today and erased all this week’s advances, the US Dollar climbed, and crude oil prices dumped 12% over the past 5 trading days, their worst week since the beginning of April, as ZeroHedge reported.

Gold was this week’s winner by ending unchanged and remaining above its $1,800 level.

Next week promises to be an interesting one, during which volatility is sure to reign—either to the upside or the downside, bringing up the question: Will the 2008-2009 analog remain on target?

Read More

Weekly StatSheet For The ETF Tracker Newsletter – Updated Through 12/08/2022

Ulli ETF StatSheet Contact

ETF Data updated through Thursday, December 8, 2022

Methodology/Use of this StatSheet:

1. From the universe of over 1,800 ETFs, I have selected only those with a trading volume of over $5 million per day (HV ETFs), so that liquidity and a small bid/ask spread are assured.

2. Trend Tracking Indexes (TTIs)

Buy or Sell decisions for Domestic and International ETFs (section 1 and 2), are made based on the respective TTI and its position either above or below its long-term M/A (Moving Average). A crossing of the trend line from below accompanied by some staying power above constitutes a “Buy” signal. Conversely, a clear break below the line constitutes a “Sell” signal. Additionally, I use a 12% trailing stop loss on all positions in these categories to control downside risk.

3. All other investment arenas do not have a TTI and should be traded based on the position of the individual ETF relative to its own respective trend line (%M/A). That’s why those signals are referred to as a “Selective Buy.” In other words, if an ETF crosses its own trendline to the upside, a “Buy” signal is generated. Here too, I recommend trailing sell stop of 12%, or less, depending on your risk tolerance.

If you are unfamiliar with some of the terminology, please see Glossary of Terms and new subscriber information in section 9.     

1. DOMESTIC EQUITY ETFs: BUY — since 12/01/2022

Click on chart to enlarge

Our main directional indicator, the Domestic Trend Tracking Index (TTI-green line in the above chart) has broken back above its long-term trend line (red) by +1.65% and remains in “Buy” mode.  

Read More

Bobbing And Weaving

Ulli Market Commentary Contact

[Chart courtesy of MarketWatch.com]

  1. Moving the markets

After 4 days of declines, the major indexes vacillated around their respective unchanged lines and, despite several breakout attempts, nothing was gained or lost. The exception was gold, with the precious metal adding 1% and closing right at its $1,800 level.

Worries about a worsening recession in 2023 remained on traders’ minds, along with critical upcoming data releases. Jobless claims on Thursday, November’s PPI and preliminary consumer sentiment on Friday will set the stage for next week’s highlights.

On Monday, we will find out whether the CPI has worsened or improved, and on Wednesday, the Fed will either deliver an expected 50 bps rate hike or an unexpected 75 bps. Either one will have an influence on market direction.

Today, even a plunge in bond yields was not enough to support equities, even though the 10-year dropped 11 bps to 3.43%, which caused the US Dollar to stumble and Gold to rise.

We may see some churning and grinding in the indexes until guesswork and uncertainty about the above-mentioned upcoming data sets are removed.   

Read More

Recession Fears Dominate Markets

Ulli Market Commentary Contact

[Chart courtesy of MarketWatch.com]

  1. Moving the markets

Yesterday’s downward momentum carried over into today’s session and accelerated throughout the day, but a last hour rebound prevented a worse outcome.

This is now the 4th straight day of declines for the S&P 500, which has now retreated clearly below its 200-day M/A, thereby nullifying its recent break above it. Looking at the bigger picture, all the massive gains following Powell’s alleged “dovish” speech have now been surrendered.

Traders are back to the drawing board, as bullish hope based on a Powell pivot, or pause, has now made room for the bitter reality that a recession, the depth of which remains unknown, will have consequences on earnings and, by association, stock prices.

Round after round of layoffs is proof that, economically speaking, a hard landing is being accepted as likely, while inflation and its impact on consumers remains a wild guess.

Despite the Fed being expected to slow the pace of interest rate hikes from 0.75% to 0.5%, when they meet next week, traders fear that the fallout from any hike will increase recessionary pressures.

Bond yields dipped a tad but not enough to exert a positive influence on equities, with the 10-year dropping down towards its 3.5% level. The US Dollar vacillated around its 200-day M/A, while Gold gained a tad but did not manage to reclaim its $1,800 level.

Updating the 2008-2009 analog, it appears history is back on schedule for a possible two-peat.  

Read More