
ETF Tracker StatSheet
You can view the latest version here.
RECESSION FEARS REIGN SUPREME
- Moving the markets
After yesterday’s drubbing, and today’s roller coaster ride, the latter of which occurred due to a massive quadruple options expiration session, it comes as no surprise that the markets took another dive.
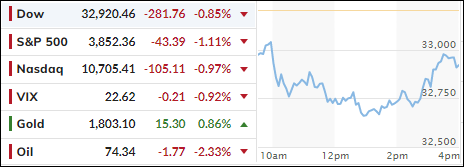
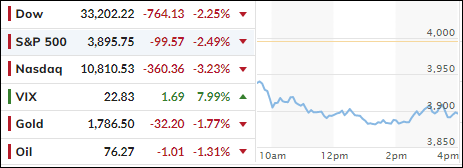
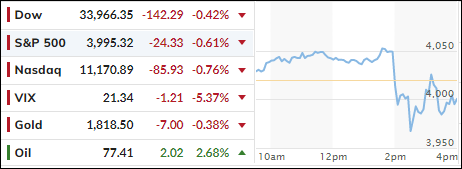
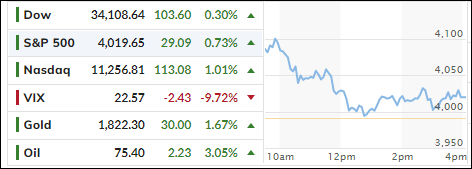
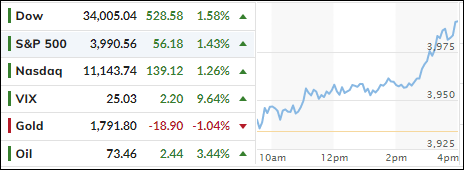
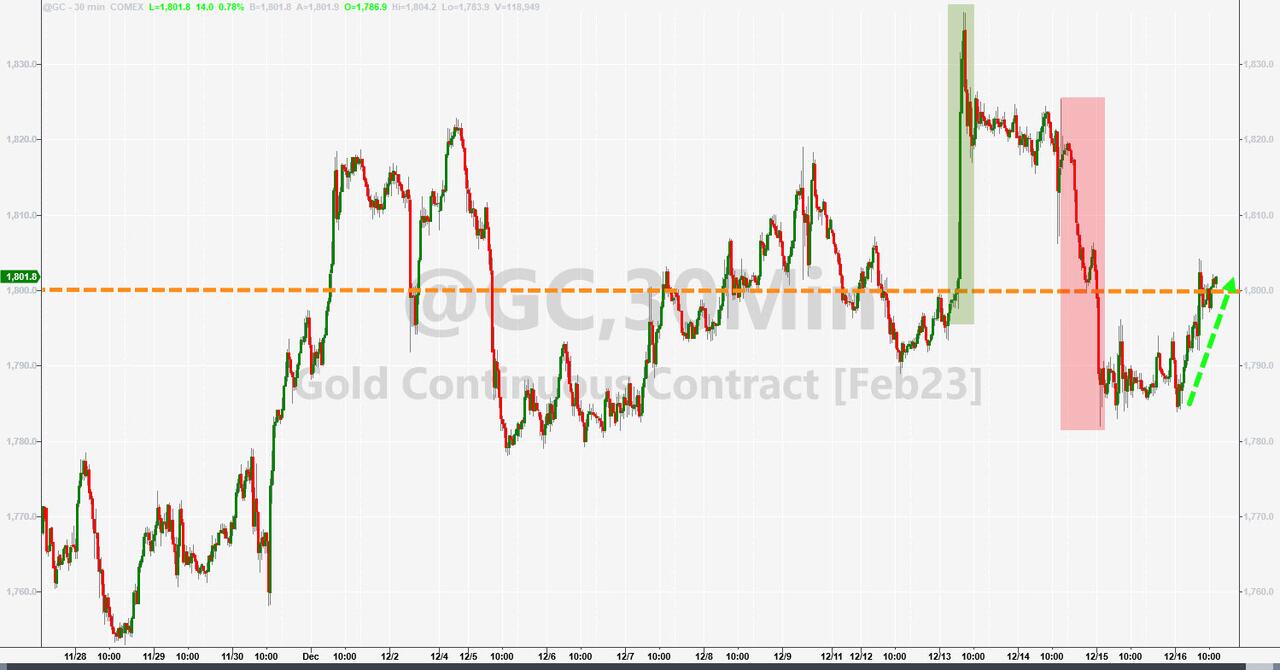
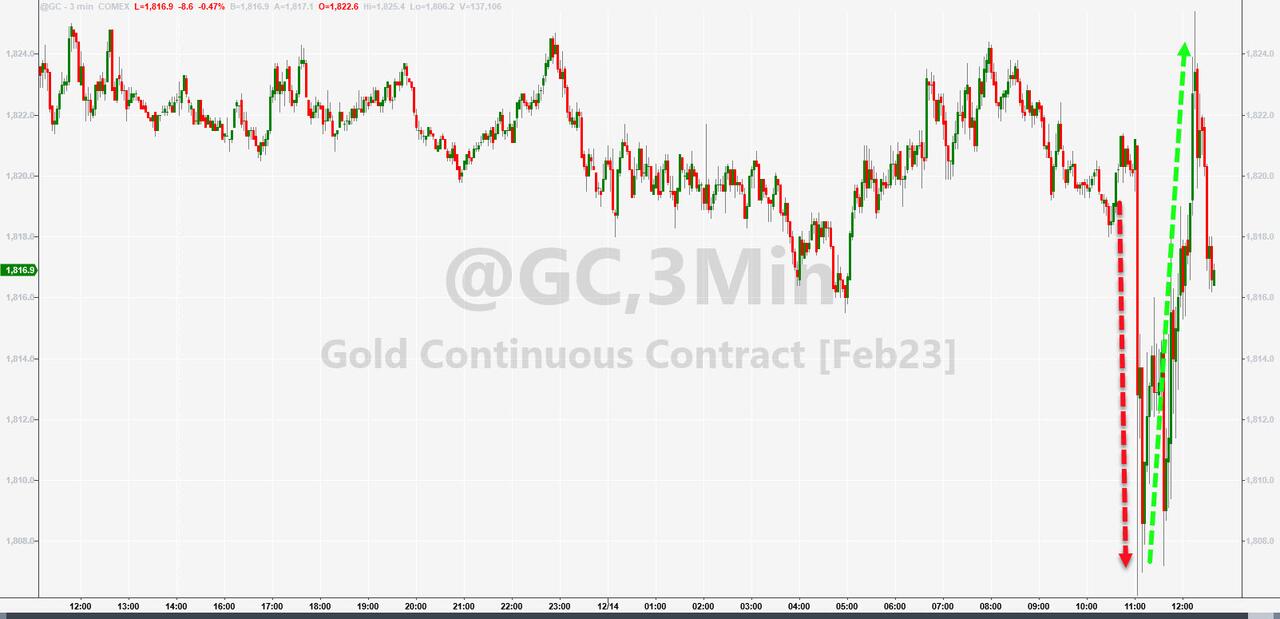
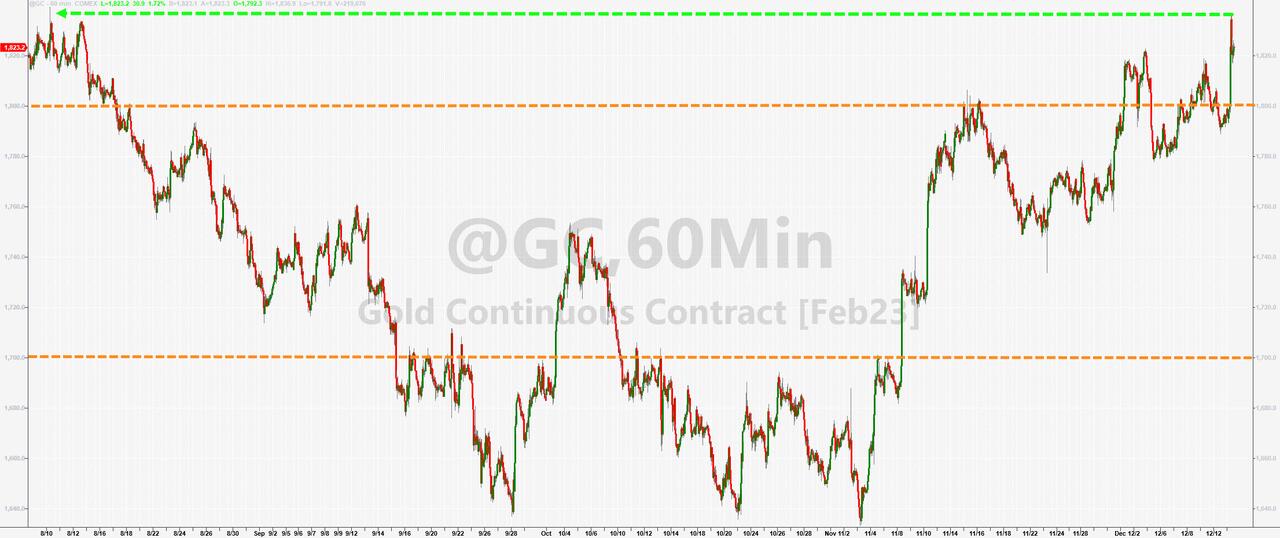
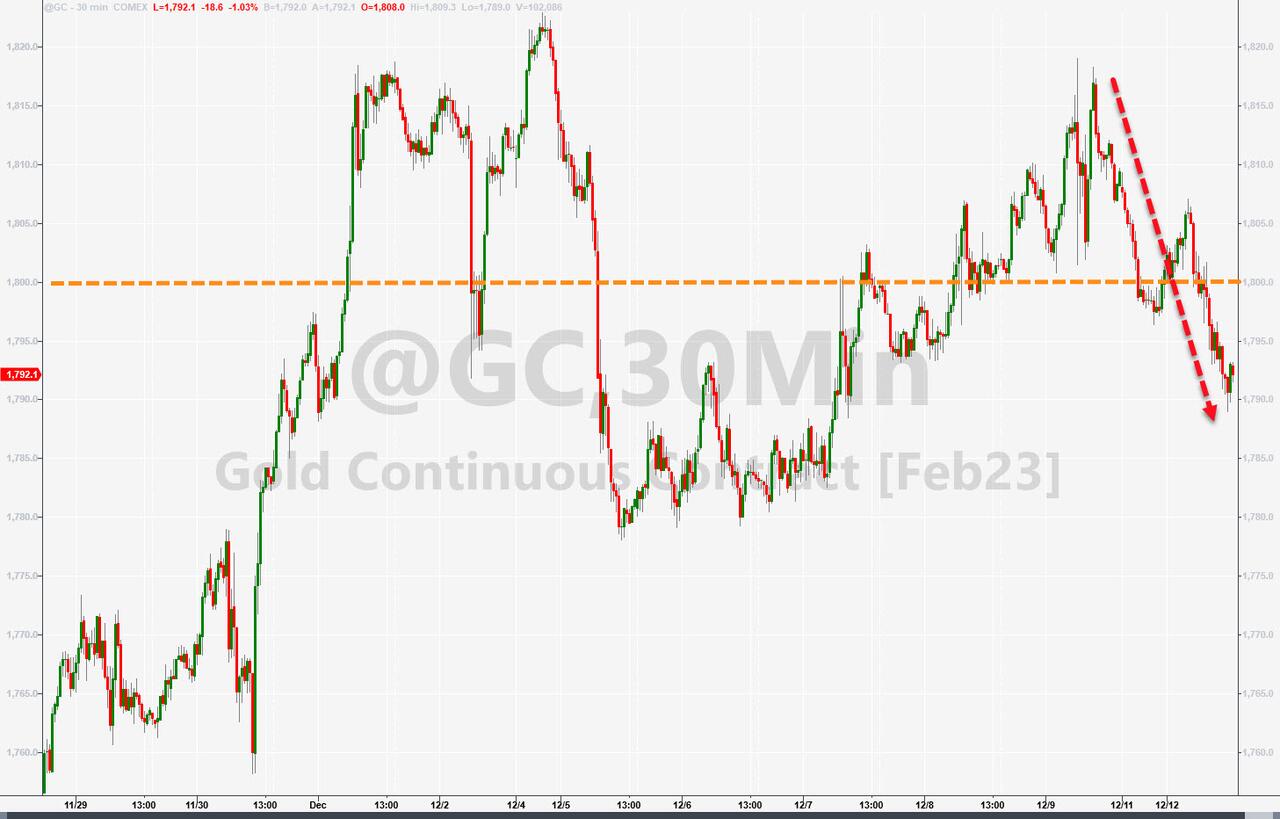
The Dow was down as much as 550 points at its worst moment but managed to pair some of those losses, as did the other two major indexes. However, we ended solidly in the red, but gold bucked the trend, closed higher, and recaptured its $1,800 level.
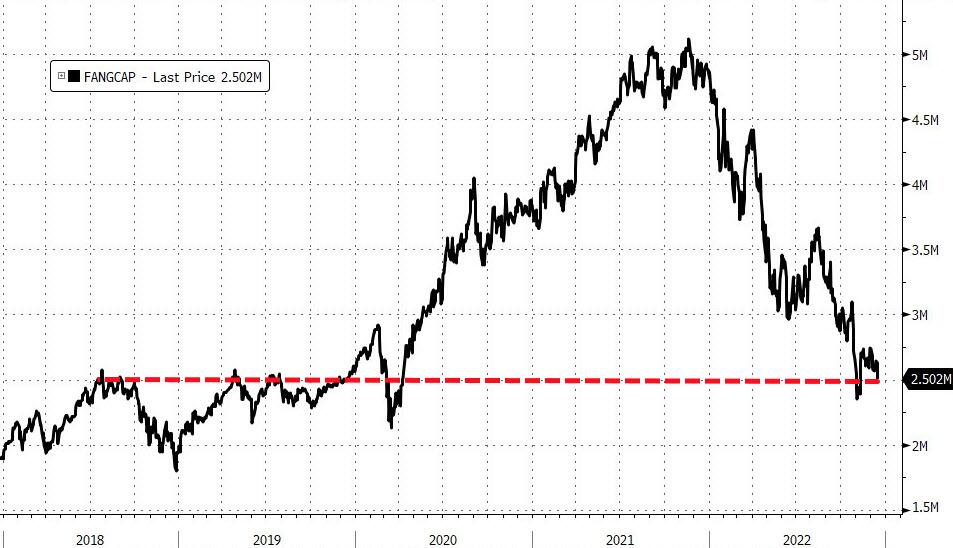
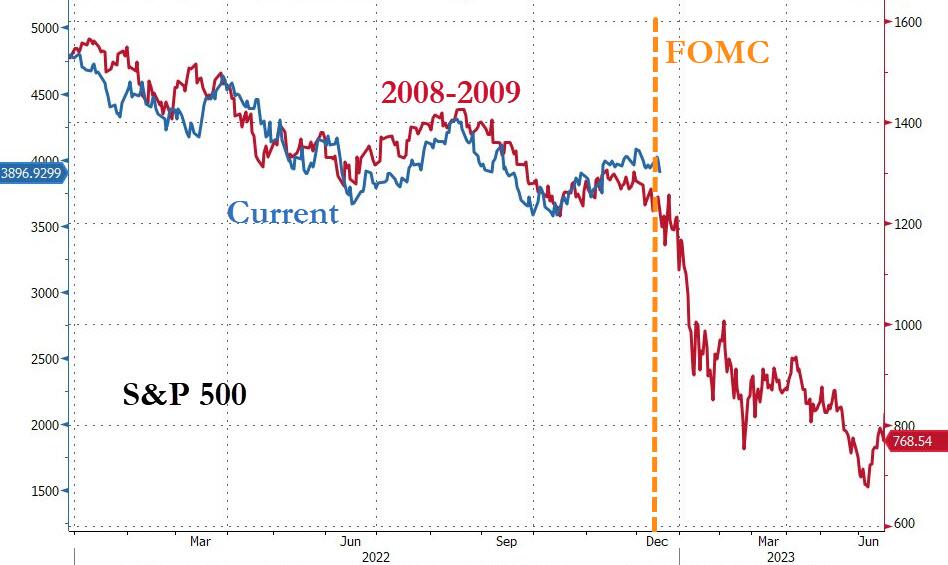
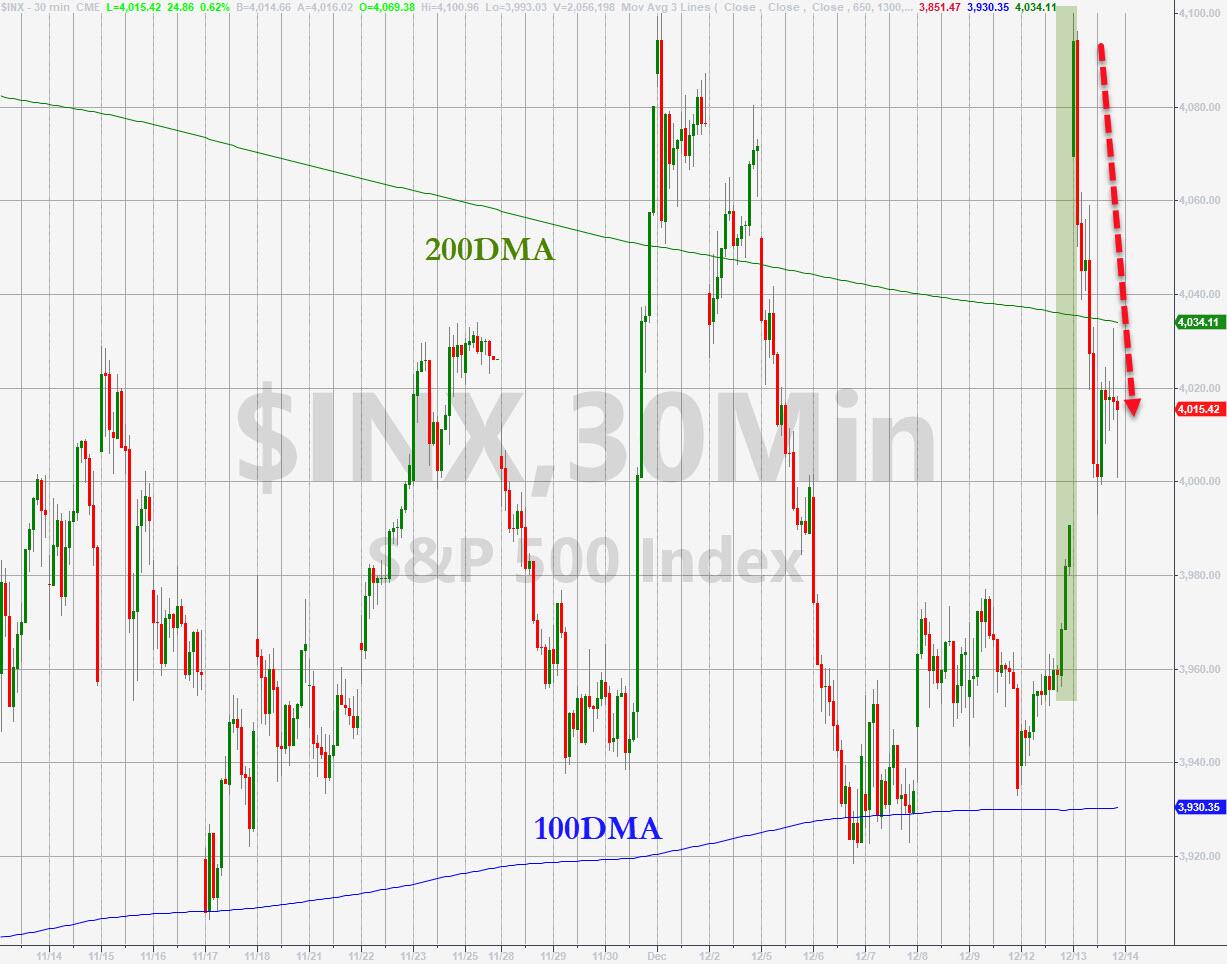
This second week of losses has the S&P 500 down about 6% for December, which now makes traders question whether this means the much hoped for Santa Claus rally has vanished. The story is far worse when looking at the FANG stocks, which not only have lost over 50% from their peak market cap from November 2021 but also tumbled over $600 billion this week alone.
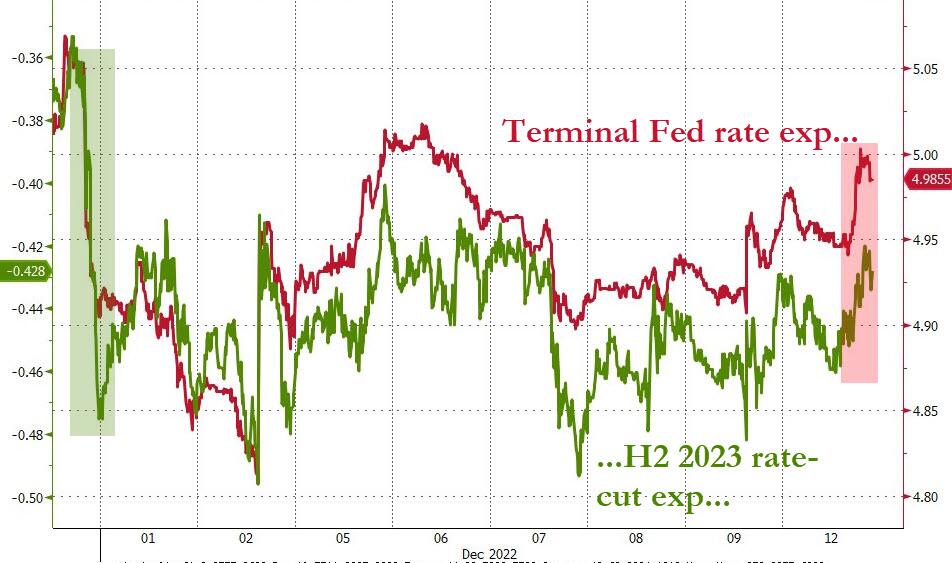
Recession fears, and the Fed’s commitment to continue its relentless rate hiking schedule for “higher and longer” through 2023, to combat inflation, means that any kind of pause or pivot is not on the horizon. That also implies future earnings will be affected, something that the Wall Street crowd seems to finally have acknowledged, hence the sell off.
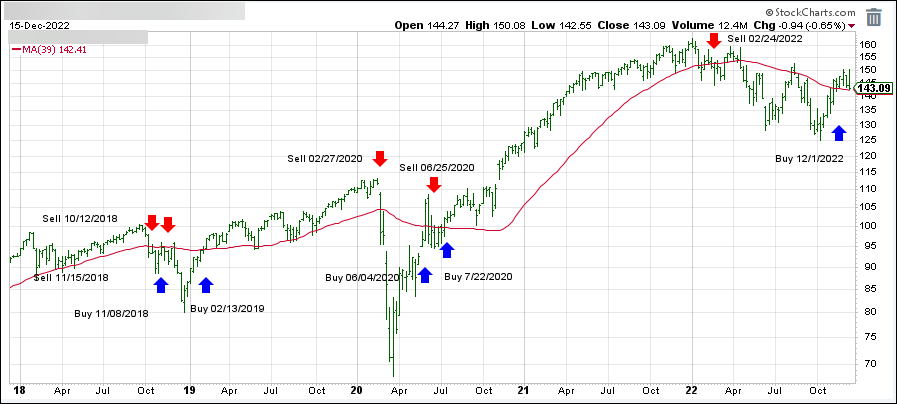
Those facts will not bode well for the markets as we enter 2023. While anything is possible, I believe that we will take out the October 2022 lows at some point. We must be prepared for the possibility of the bears taking over again. Case in point is today’s second straight weekly loss for the S&P 500, which pushed our TTI back into bear market territory (section 3).
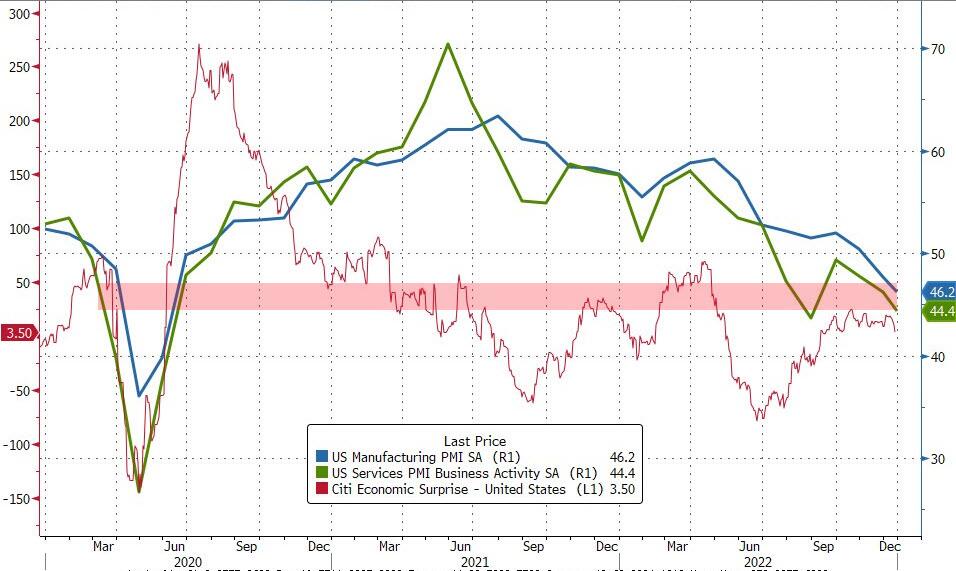
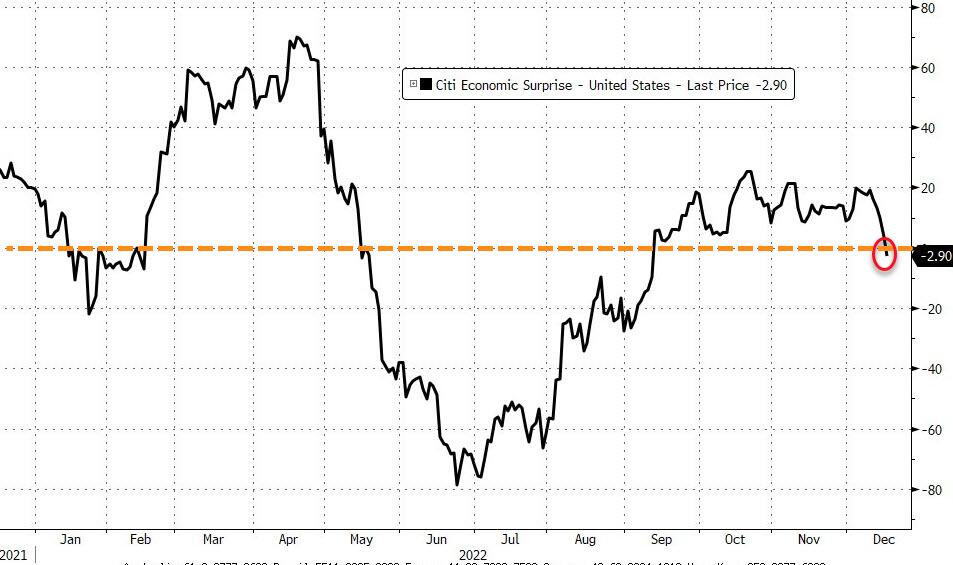
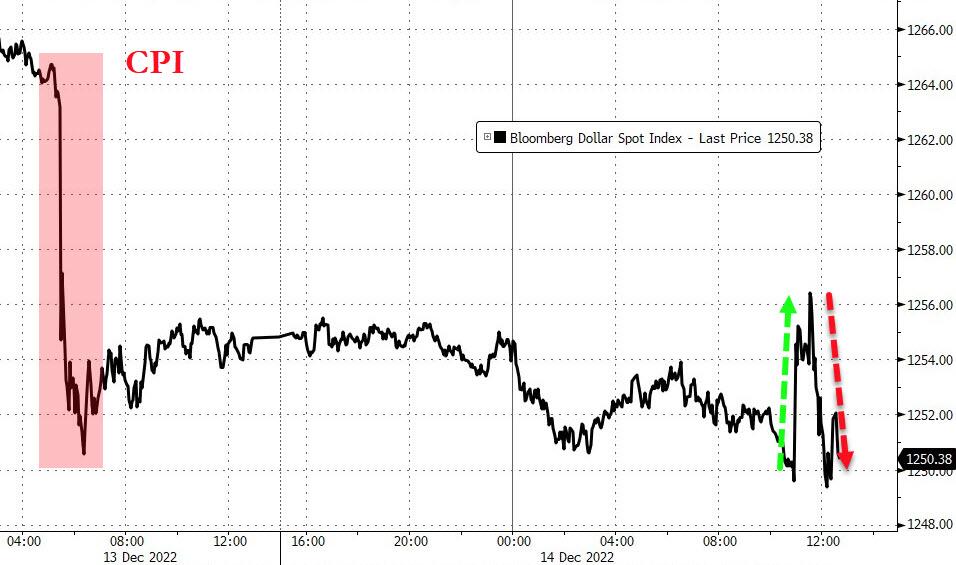
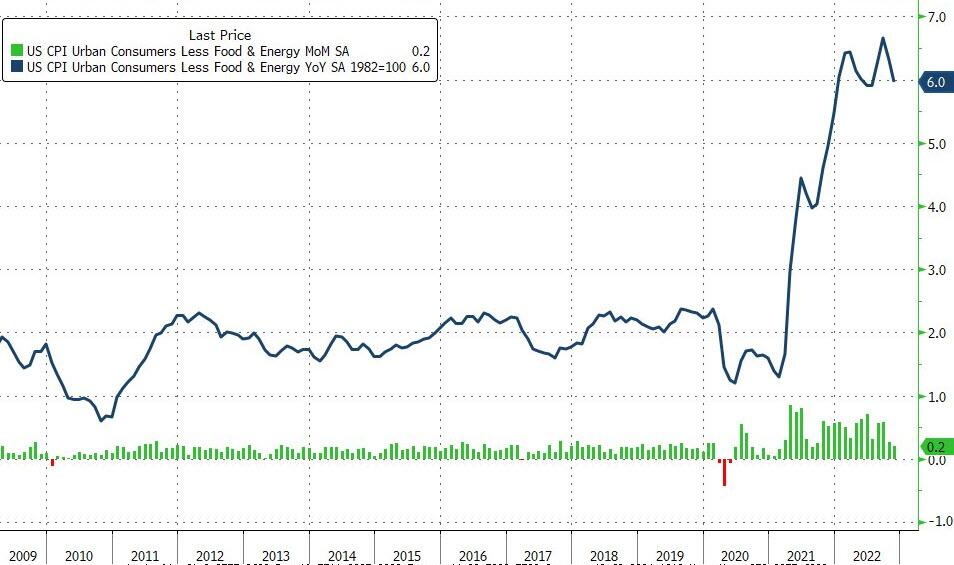
Adding to the current misery were a few data points, which seemed to support the view for a change in market direction. Both, US Manufacturing and US Services dropped not only into recession territory but also to their lowest since May 2020. As a result, the Economic Surprise index retreated to a level last seen in May.
And the final nail in the coffin came from two Fed mouthpieces, which reinforced their hawkish message, as ZeroHedge pointed out:
- DALY: “INFLATION IS TOXIC“, FED “IS FAR AWAY” FROM ITS PRICE-STABILITY GOAL, MAY NEED MID-4% OR MORE JOBLESS RATE FOR LABOR-MKT BALANCE
- MESTER: HAVEN’T SEEN IMPROVEMENT ON SERVICE-PRICE INFLATION
- DALY: DON’T KNOW WHY MARKETS ARE SO OPTIMISTIC ON INFLATION, PREPARED TO HOLD PEAK RATE MORE THAN 11 MONTHS IF NEEDED
- MESTER: NEED TO KEEP FUNDS RATE ABOVE 5% IN ’23 TO CURB PRICES, FED HAS `MORE WORK TO DO ON INFLATION,’ IT’S TOO HIGH
I have repeatedly pointed to similar comments over the past few months, which to me means only one thing, namely that equities will face severe headwinds in 2023. Hence, it’s important to follow the direction of the long-term trends and make investment decisions based on them and not wild guesses and predictions.
After all, only the trend is your friend.
Read More