
ETF Tracker StatSheet
You can view the latest version here.
STOCKS DUMP AS RATE-HIKE ODDS JUMP
- Moving the markets
The much-awaited speech by Fed head Powell, after the annual Jackson Hole symposium, lasted less than 10 minutes and left the front running traders and algos flabbergasted, because they did not pay attention to the events of the past couple of weeks, during which a host of Fed Presidents (like Bostic, Bullard and Harker) pounded the hawkish drum that higher interest rates were necessary to fight inflation.
Unless Powell wanted to throw his staff under the bus, it was very clear that, for the time being, he would be singing from the hawkish hymn book.
While he laid out his speech in three distinct lessons, as ZeroHedge put it, his warning at the end was finally heard loud and clear:
Restoring price stability will take some time and requires using our tools forcefully to bring demand and supply into better balance. Reducing inflation is likely to require a sustained period of below-trend growth. Moreover, there will very likely be some softening of labor market conditions. While higher interest rates, slower growth, and softer labor market conditions will bring down inflation, they will also bring some pain to households and businesses. These are the unfortunate costs of reducing inflation. But a failure to restore price stability would mean far greater pain.
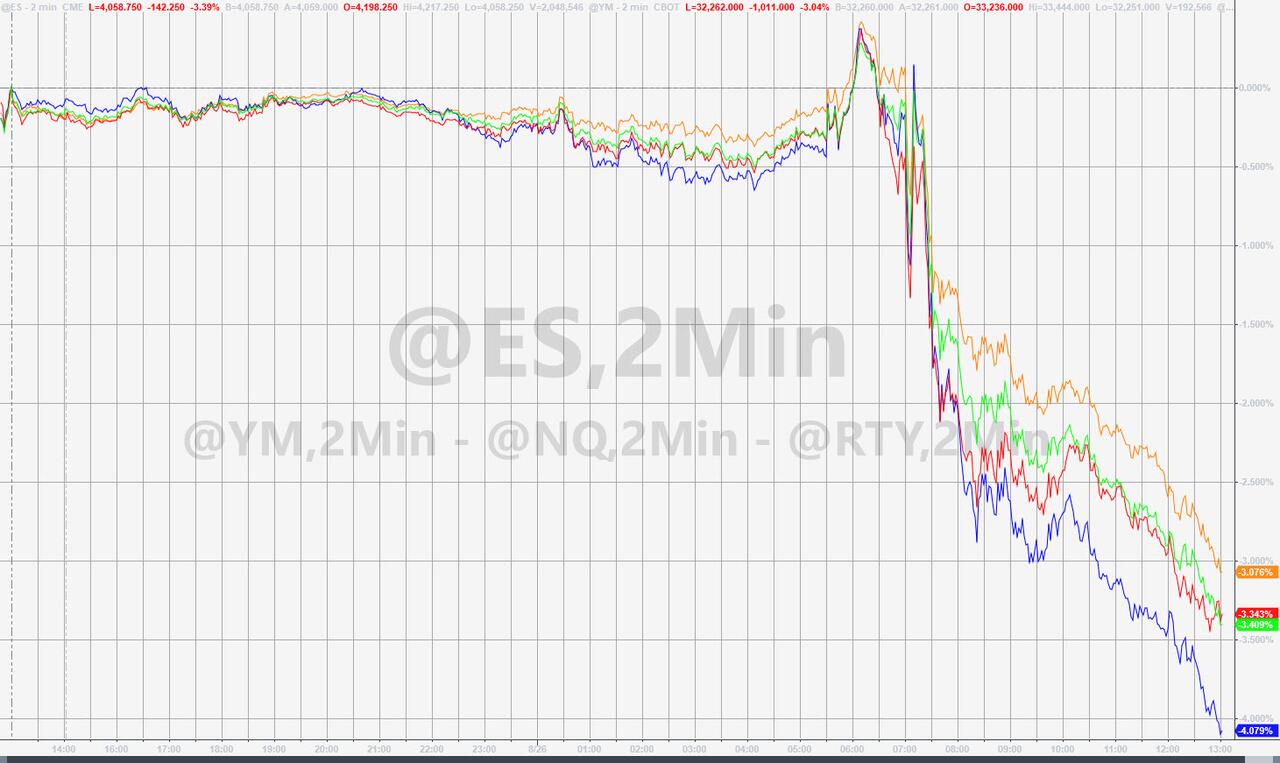
Finally, the markets reacted as one would expect, and the bullish meme got slammed, while the bears had reason to rejoice. And just like that, our Domestic Trend Tracking Index (TTI) finds itself back in bearish territory, after almost breaking out of it. As of today, the index sits at -3.49%.
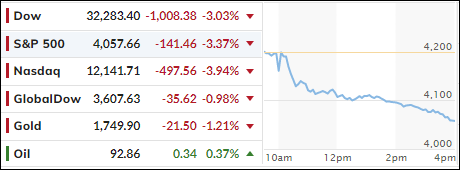
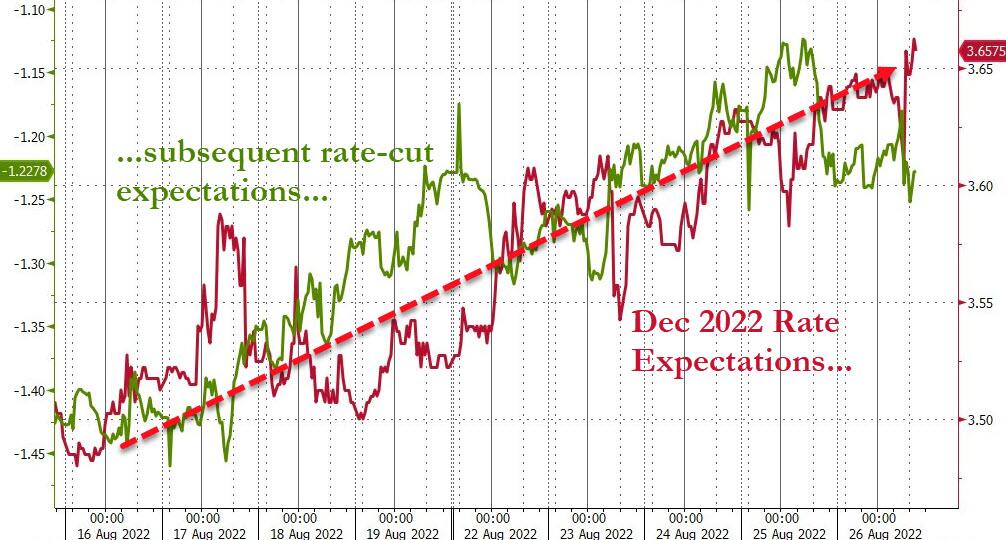
Rate hike expectations surged, and rate-hike odds shifted to a 66% chance of a 75bps hike in September vs. a 33% chance of a 50bps increase. As a result, the broad markets simply got hammered.
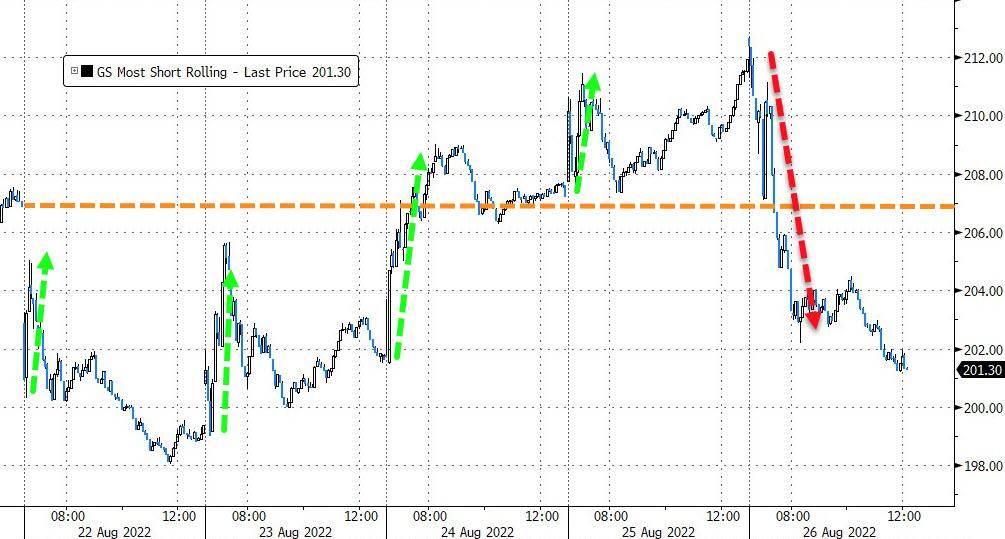
For the week, the Nasdaq was the downside leader with a loss of almost 5%, as the most shorted stocks did what was expected of them, namely tank big time.
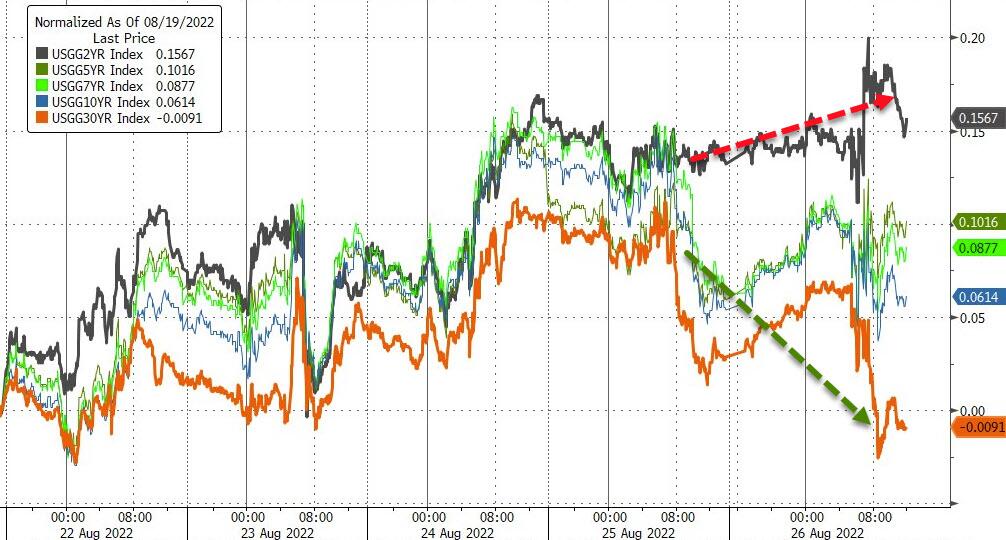
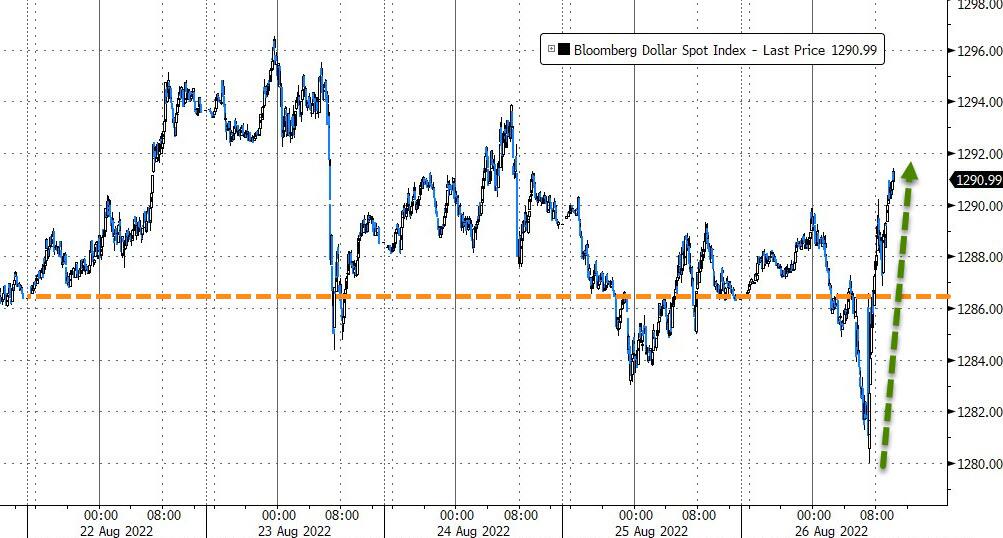
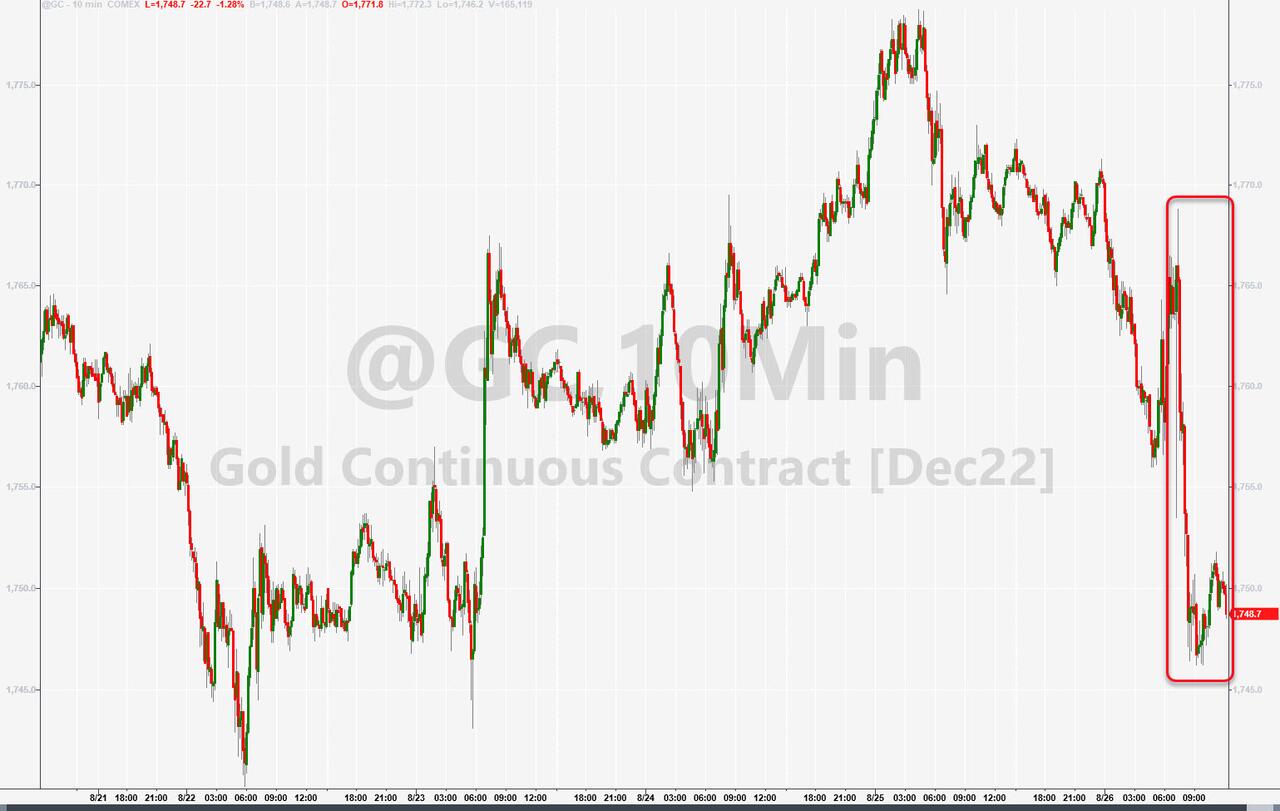
Bond yields provided a mixed picture for the past 5 trading days, in that the 2-year pumped while the 30-remained about unchanged. Higher yields gave the US Dollar a boost but took the steam out of gold’s mid-week rally.
What a better way to end the week looking at the 2008 analog, which shows an eerily similar trend as we’re seeing today. Tip of the hat to Bloomberg/ZeroHedge for this updated chart.
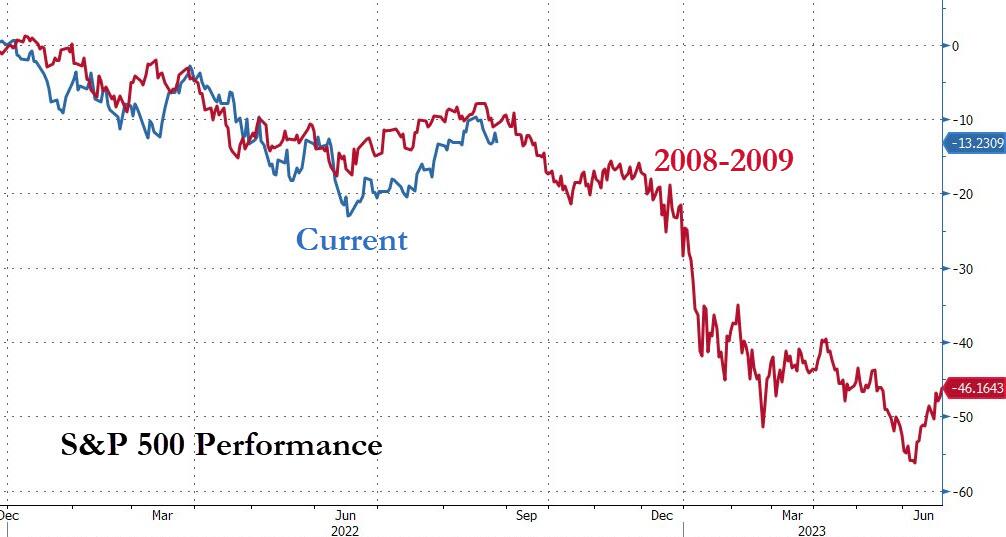
2. ETFs in the Spotlight
In case you missed the announcement and description of this section, you can read it here again.
It features some of the 10 broadly diversified domestic and sector ETFs from my HighVolume list as posted every Saturday. Furthermore, they are screened for the lowest MaxDD% number meaning they have been showing better resistance to temporary sell offs than all others over the past year.
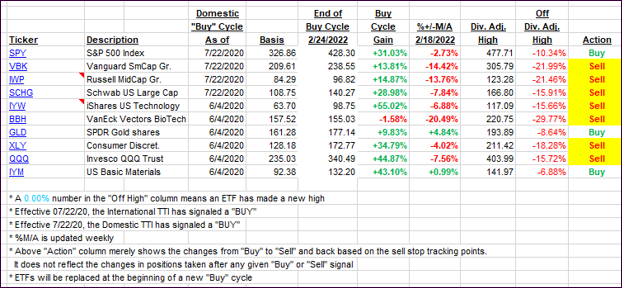
The below table simply demonstrates the magnitude with which these ETFs are fluctuating above or below their respective individual trend lines (%+/-M/A). A break below, represented by a negative number, shows weakness, while a break above, represented by a positive percentage, shows strength.
For hundreds of ETF choices, be sure to reference Thursday’s StatSheet.
For this closed-out domestic “Buy” cycle (2/24/2022), here’s how some of our candidates have fared. Keep in mind that our Domestic Trend Tracking Index (TTI) signaled a “Sell” on that date, which overrode the existing “Buys” shown for SPY and IYM:
Click image to enlarge.
Again, the %+/-M/A column above shows the position of the various ETFs in relation to their respective long-term trend lines, while the trailing sell stops are being tracked in the “Off High” column. The “Action” column will signal a “Sell” once the -12% point has been taken out in the “Off High” column, which has replaced the prior -8% to -10% limits.
3. Trend Tracking Indexes (TTIs)
Our TTIs dumped sharply, as all markets finally accepted the fact that Fed head Powell is not about to “pivot dovishly,” as had been expected, but he will continue his inflation fighting efforts (higher rates)—at least for the foreseeable future.
This is how we closed 08/26/2022:
Domestic TTI: -3.49% below its M/A (prior close -0.45%)—Sell signal effective 02/24/2022.
International TTI: -7.28% below its M/A (prior close -5.69%)—Sell signal effective 03/08/2022.
Disclosure: I am obliged to inform you that I, as well as my advisory clients, own some of the ETFs listed in the above table. Furthermore, they do not represent a specific investment recommendation for you, they merely show which ETFs from the universe I track are falling within the specified guidelines.
All linked charts above are courtesy of Bloomberg via ZeroHedge.
———————————————————-
WOULD YOU LIKE TO HAVE YOUR INVESTMENTS PROFESSIONALLY MANAGED?
Do you have the time to follow our investment plans yourself? If you are a busy professional who would like to have his portfolio managed using our methodology, please contact me directly to get more details.
Contact Ulli