
- Moving the markets
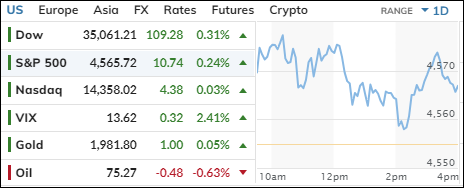
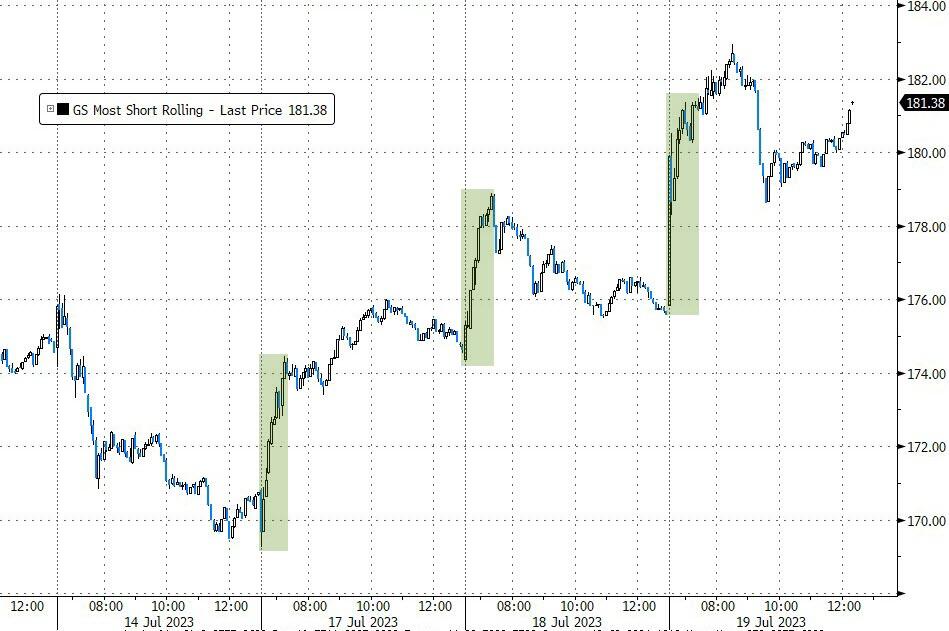
The Dow Jones Industrial Average had another good day on Wednesday, rising for the eighth day in a row with some help from the short squeeze crowd. That’s the longest streak of gains since September 2019, as investors celebrate the strong earnings season, ignoring the fact that the expectations were low to begin with.
The Dow didn’t care about Goldman Sachs’ disappointing earnings report, which showed losses in real estate. The bank had already warned that the quarter would suck, so no one was shocked.
Meanwhile, most of the companies in the S&P 500 that have reported results have beaten the low bar, according to FactSet data. This makes some people think that the economy is slowing down gently, rather than crashing hard.
The inflation data last week also calmed some nerves about rising prices, even though that might have been a fluke. Bank earnings have been less bad than expected and have helped us to forget the spring meltdown. The market is hoping that the banking sector is out of the woods, and that history won’t repeat itself. Yeah, right.
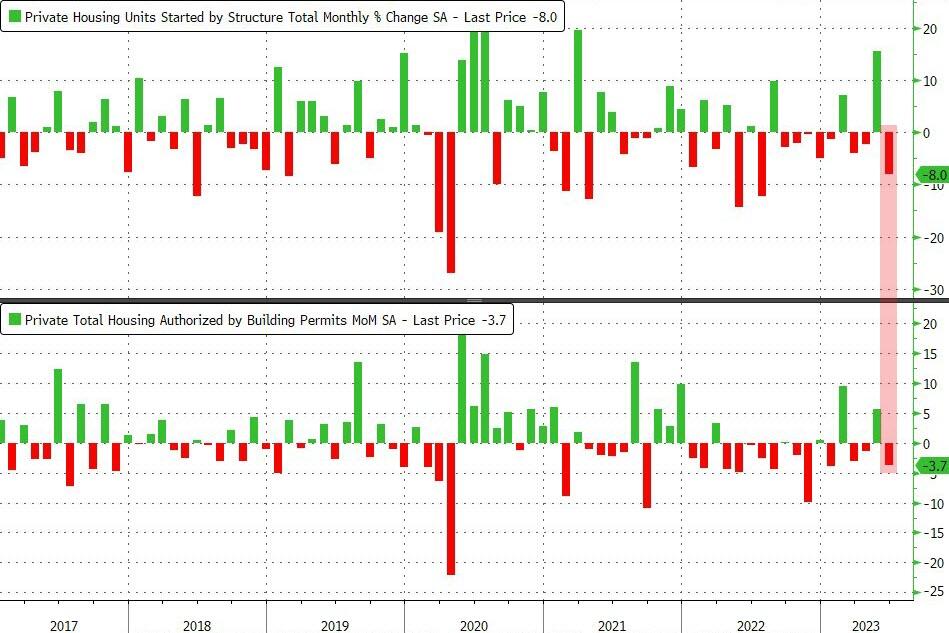
On the flip side, the housing market cooled off a bit in June, as both housing starts and building permits fell from May. Housing starts also got a downward revision for May. The only silver lining was single-family building permits, which rose for the sixth month in a row. Multi-family permits and starts, however, dropped in June.
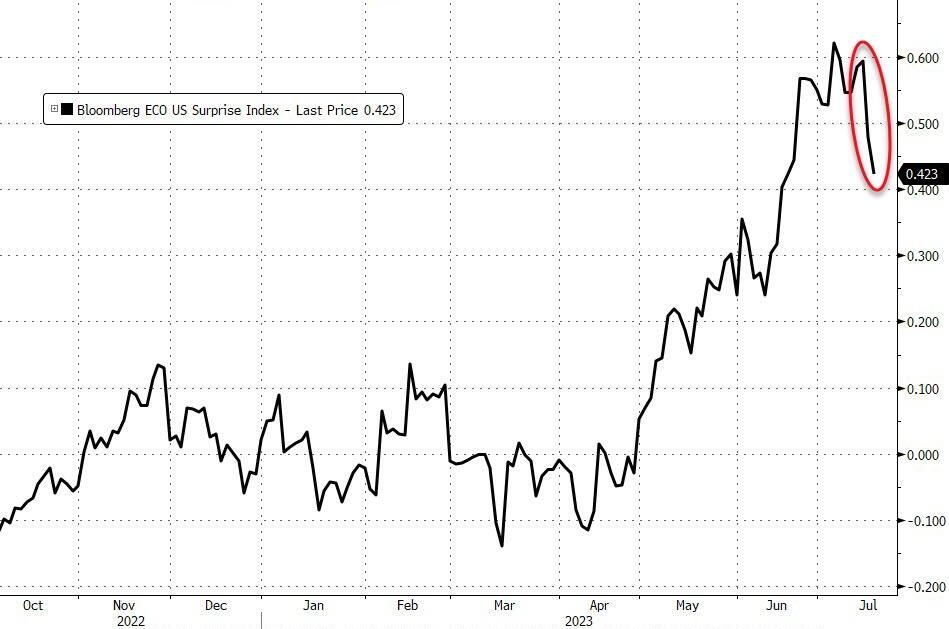
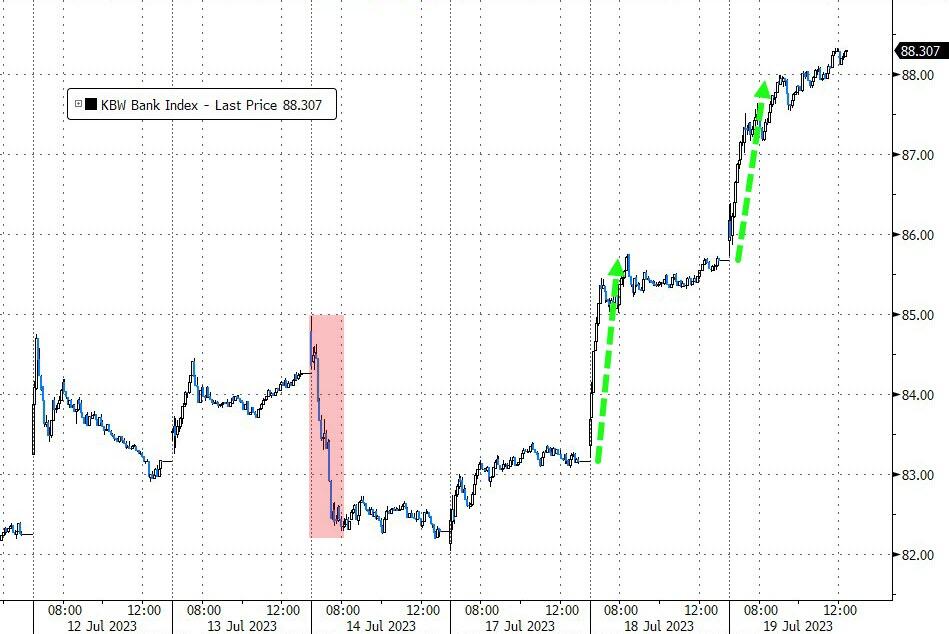
That dragged the US macro data index down another notch, which was the biggest 2-day drop since January 2022. But the KBW banking index kept climbing out of its hole and scored another win.
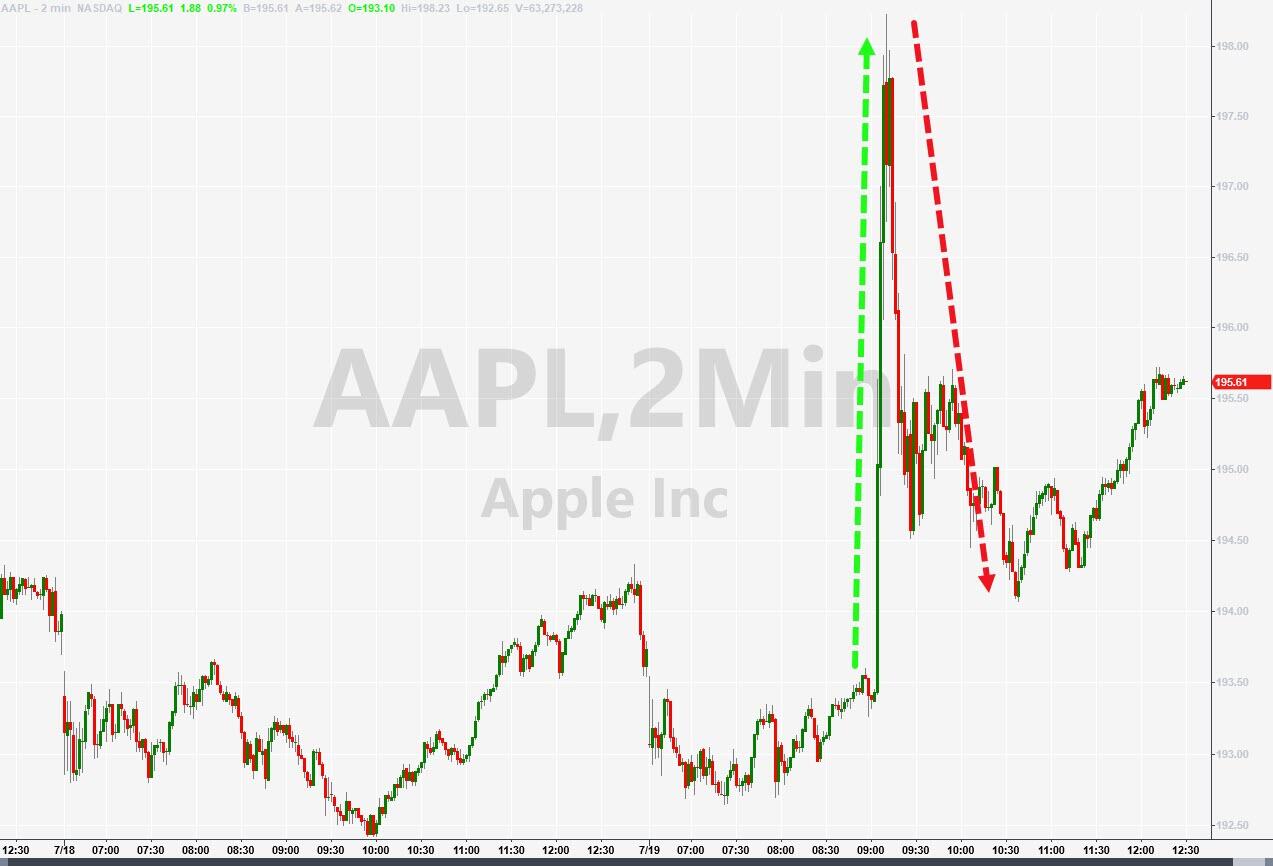
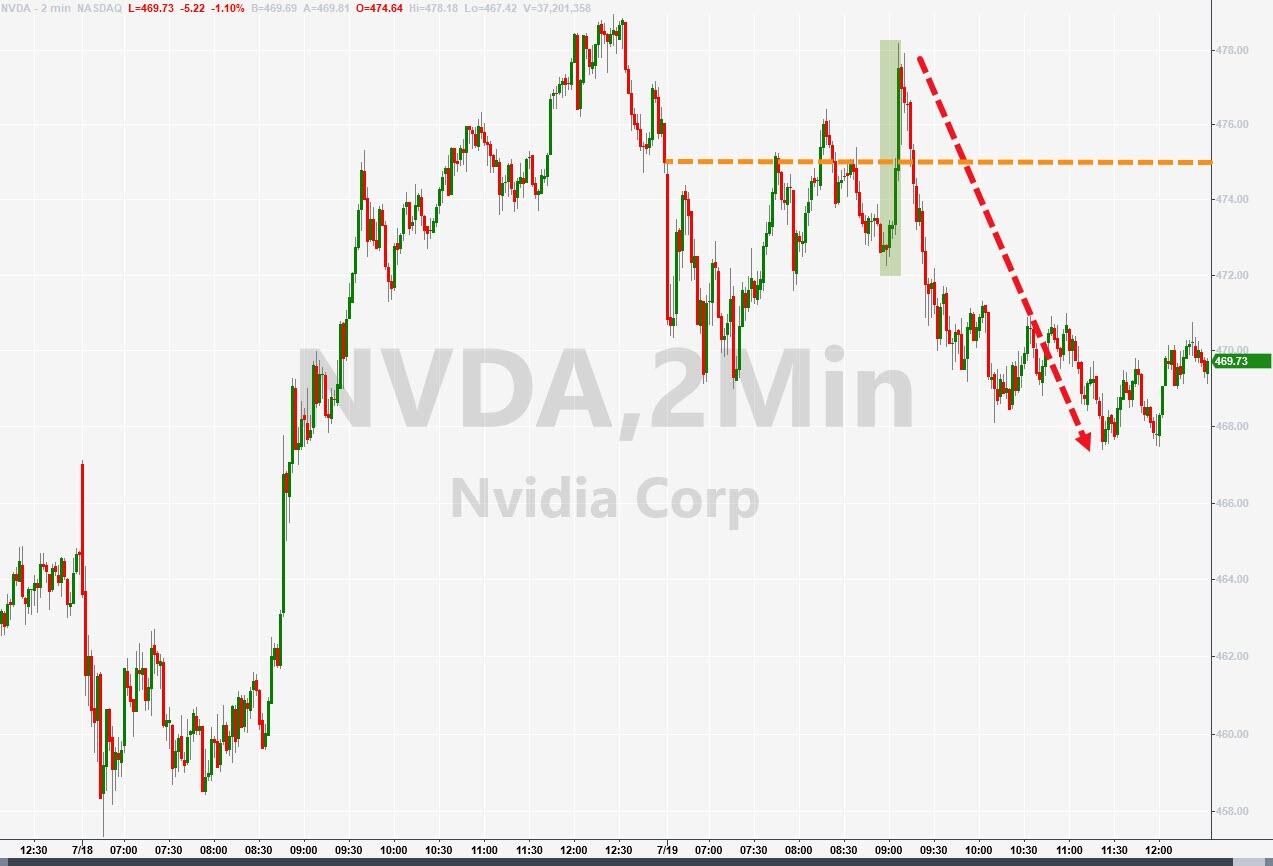
Both Apple and NVDA had a brief scare when news of Apple building an AI platform turned out to be a lame imitation. The stock ripped and dipped but recovered for the day. Sometimes you just have to laugh…
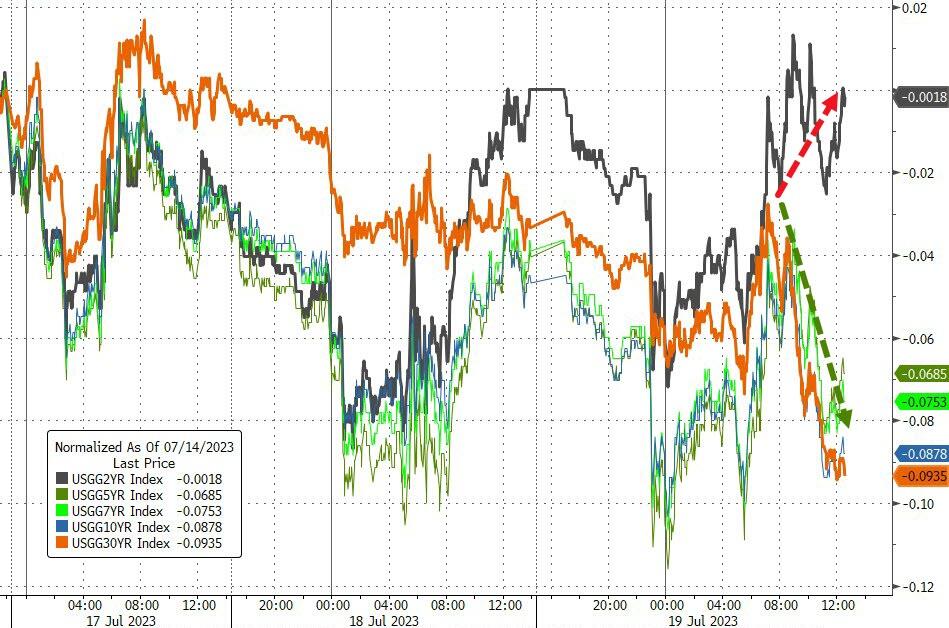
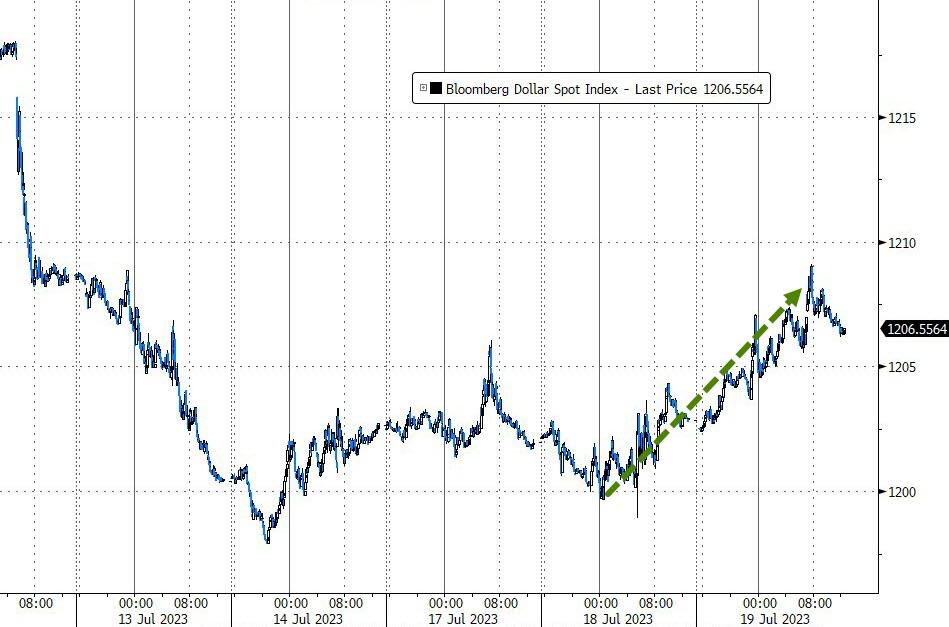
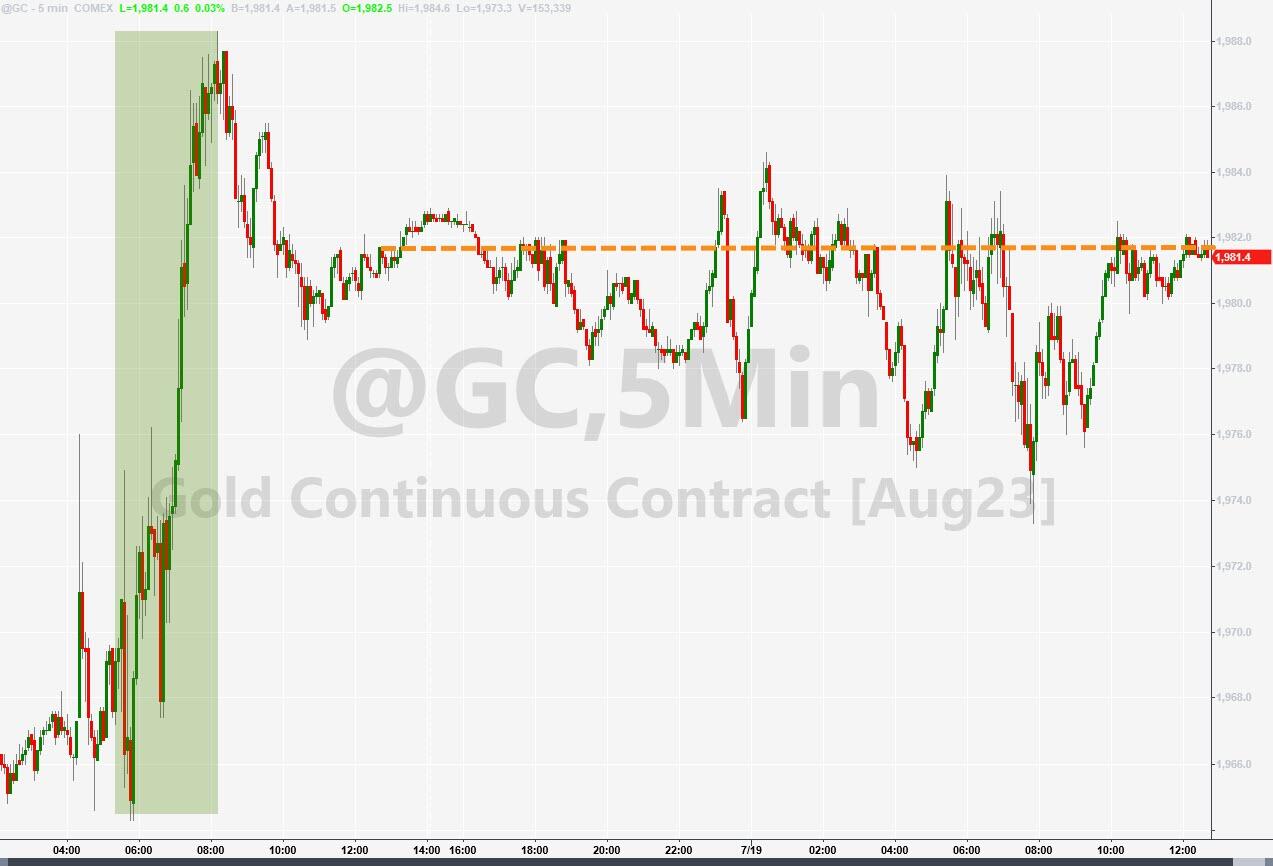
Bond yields were mostly lower, the dollar was stronger, and gold wandered around but ended up slightly higher.
The gap between the S&P 500 and High Yield Credit (HYG) has widened even more, as this chart shows.
What could possibly go wrong?
- “Buy” Cycle Suggestions
The current Buy cycle began on 12/1/2022, and I gave you some ETF tips based on my StatSheet back then. But if you joined me later, you might want to check out the latest StatSheet, which I update and post every Thursday at 6:30 pm PST.
You should also think about how much risk you can handle when picking your ETFs. If you are more cautious, you might want to go for the ones in the middle of the M-Index rankings. And if you don’t want to go all in, you can start with a 33% exposure and see how it goes.
We are in a crazy time, with the economy going downhill and some earnings taking a hit. That will eventually drag down stock prices too. So, in my advisor’s practice, we are looking for some value, growth and dividend ETFs that can weather the storm. And of course, gold is always a good friend.
Whatever you invest in, don’t forget to use a trailing sell stop of 8-12% to protect yourself from big losses.
- Trend Tracking Indexes (TTIs)
The major indexes overcame some midday swings and ended the day with modest gains, lifting our TTIs along the way. Both have now reached their highest level since the start of this cycle.
This is how we closed 07/19/2023:
Domestic TTI: +7.14% above its M/A (prior close +6.61%)—Buy signal effective 12/1/2022.
International TTI: +9.09% above its M/A (prior close +8.78%)—Buy signal effective 12/1/2022.
All linked charts above are courtesy of Bloomberg via ZeroHedge.
Contact Ulli