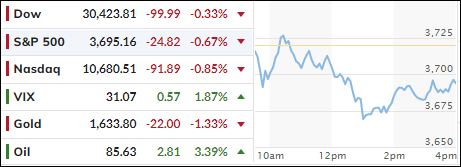
Plunging Bond Yields Support Bear Market Rally

Ulli Market Commentary Contact

[Chart courtesy of MarketWatch.com]

  1. Moving the markets

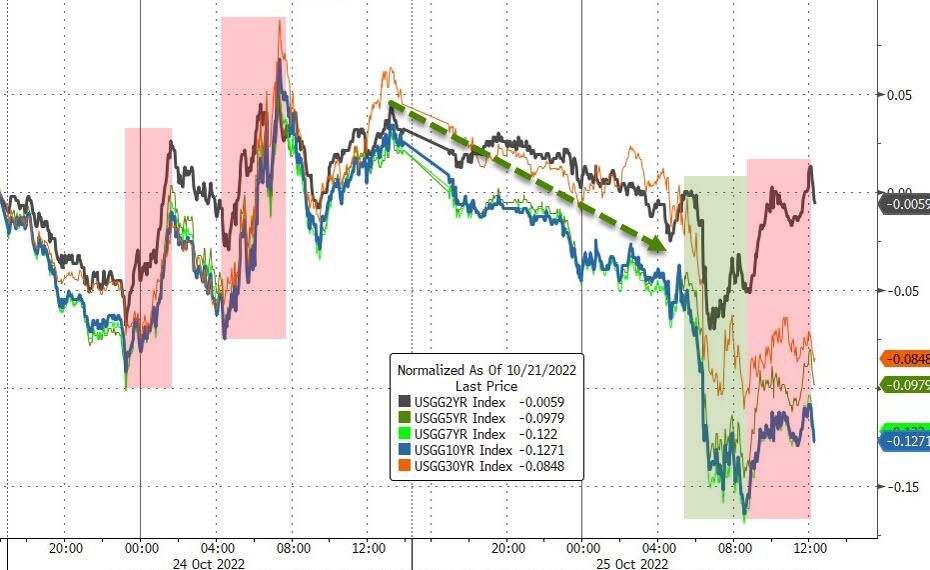
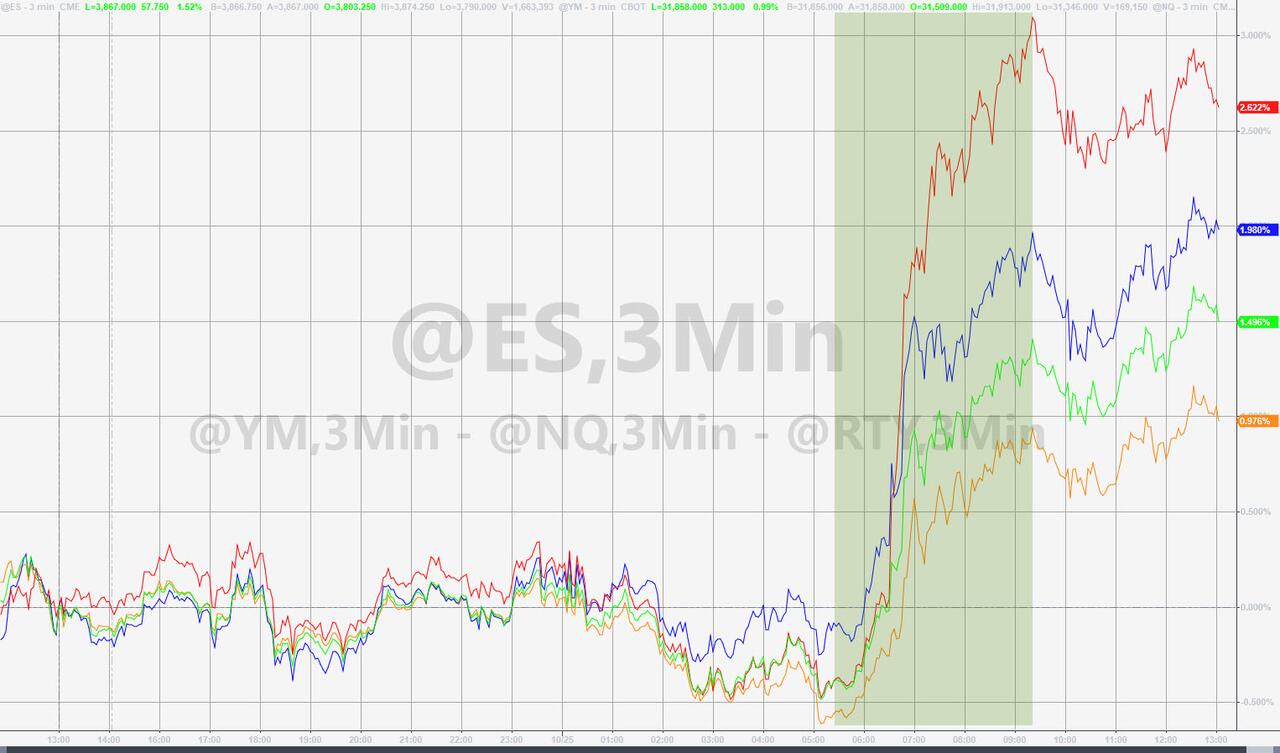
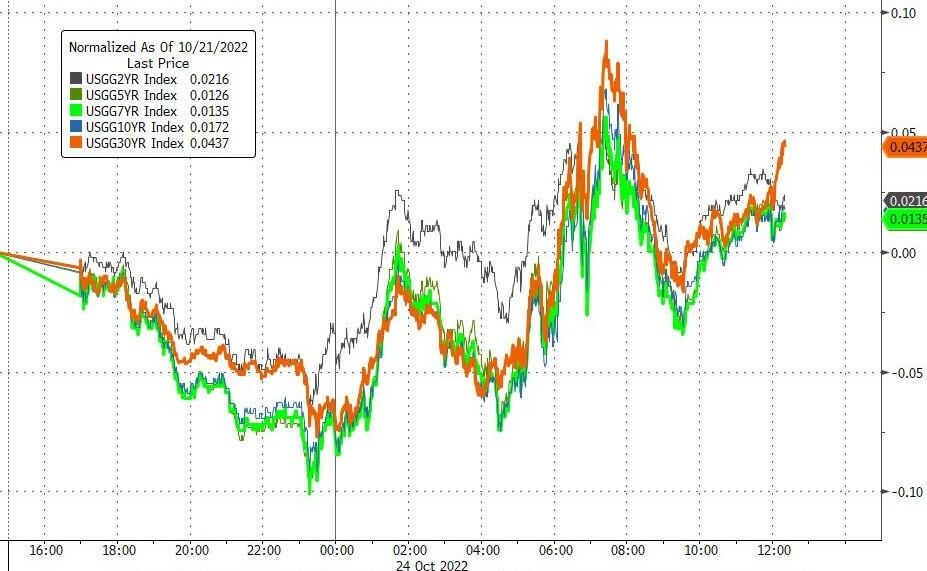
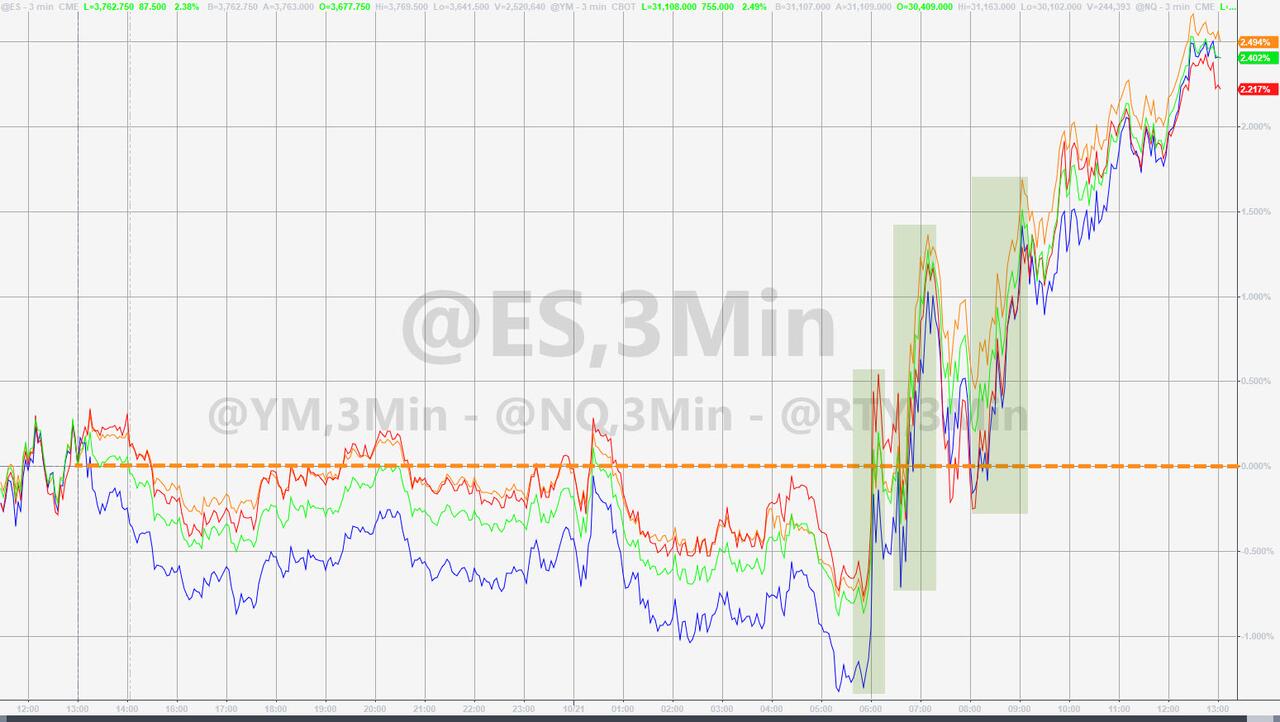
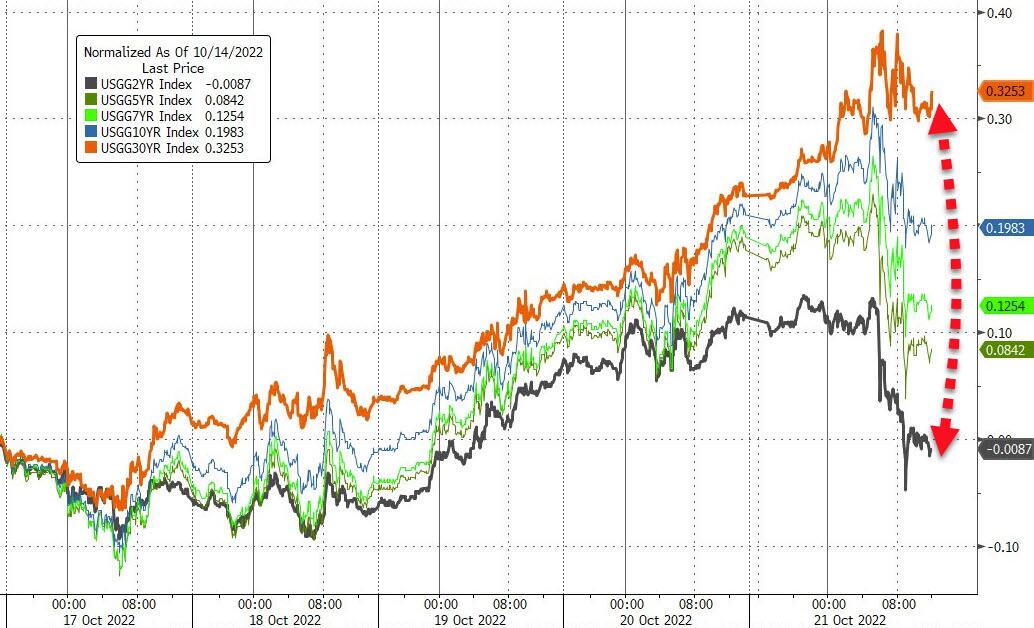
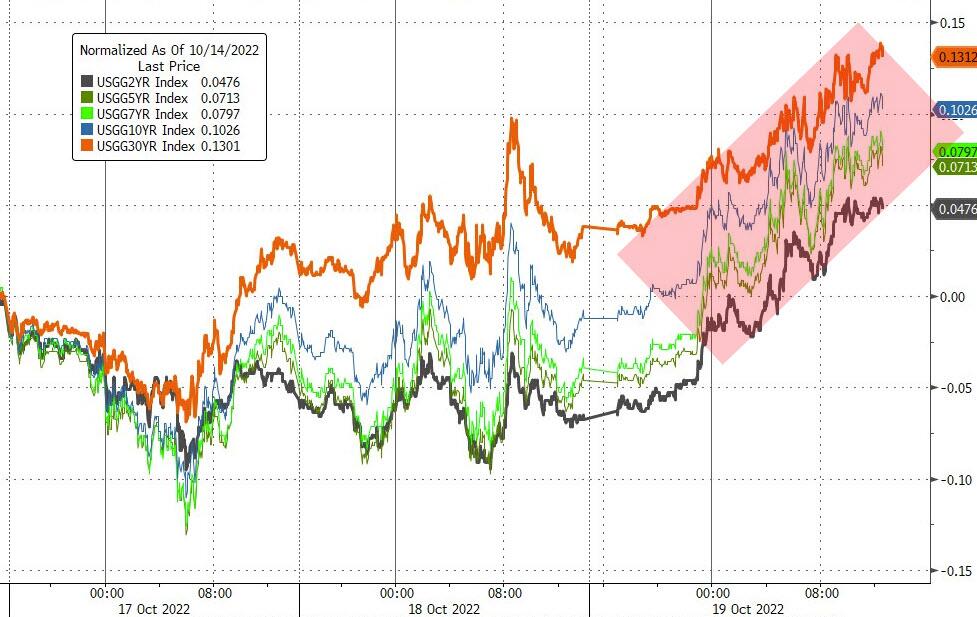
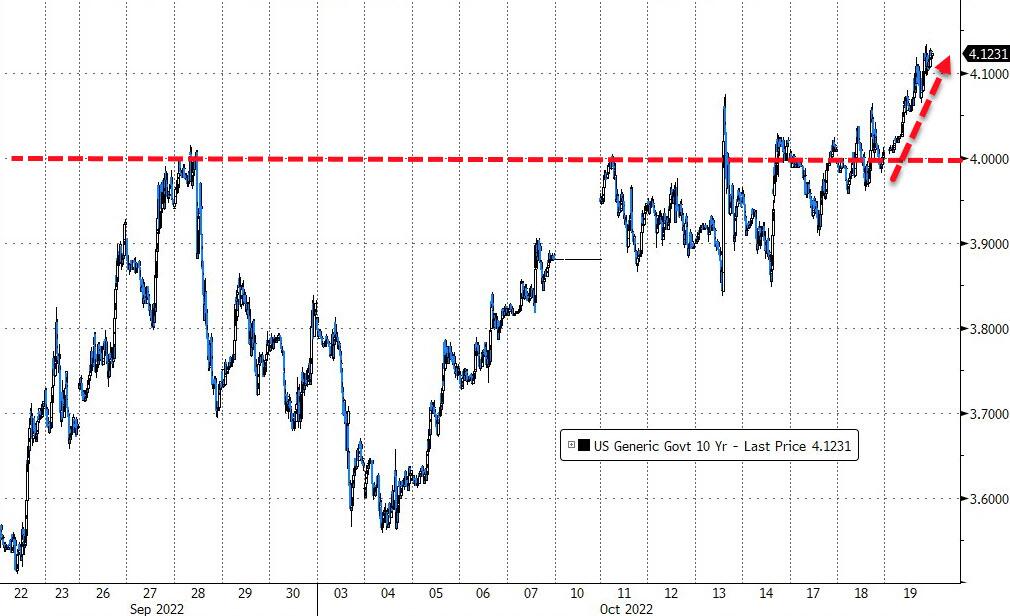
Plunging bond yields provided the perfect background to keep the bear market rally intact for the third day, a scenario we’ve witnessed several times this year. The largest drop and subsequent rebound happened in June, when the S&P 500 exploded off its bottom by 19.2% only to shift in reverse and surrender all gains:

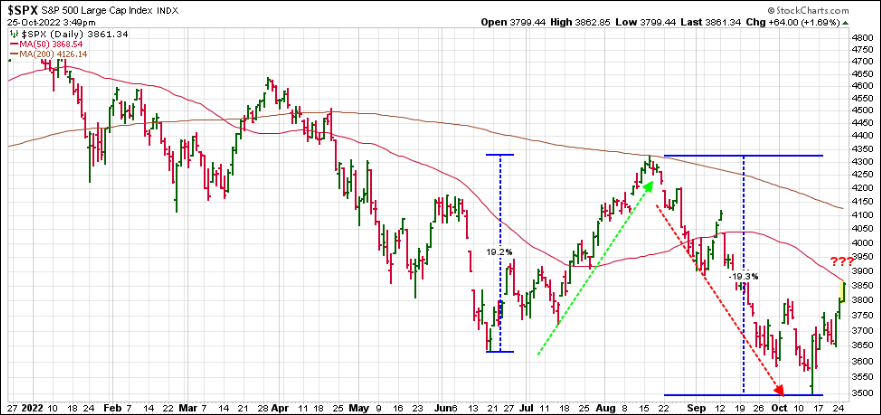
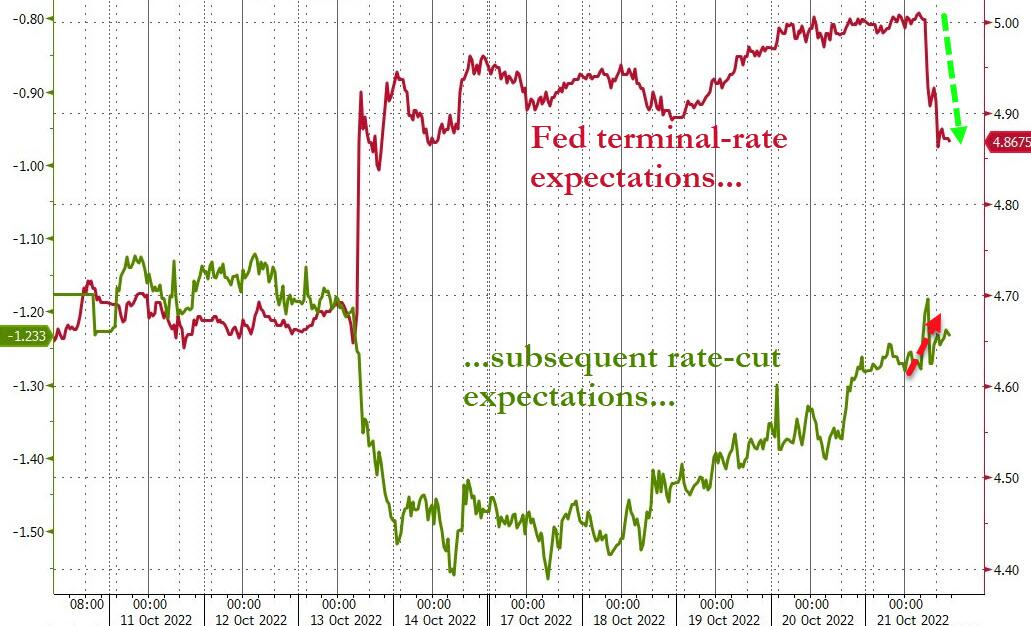
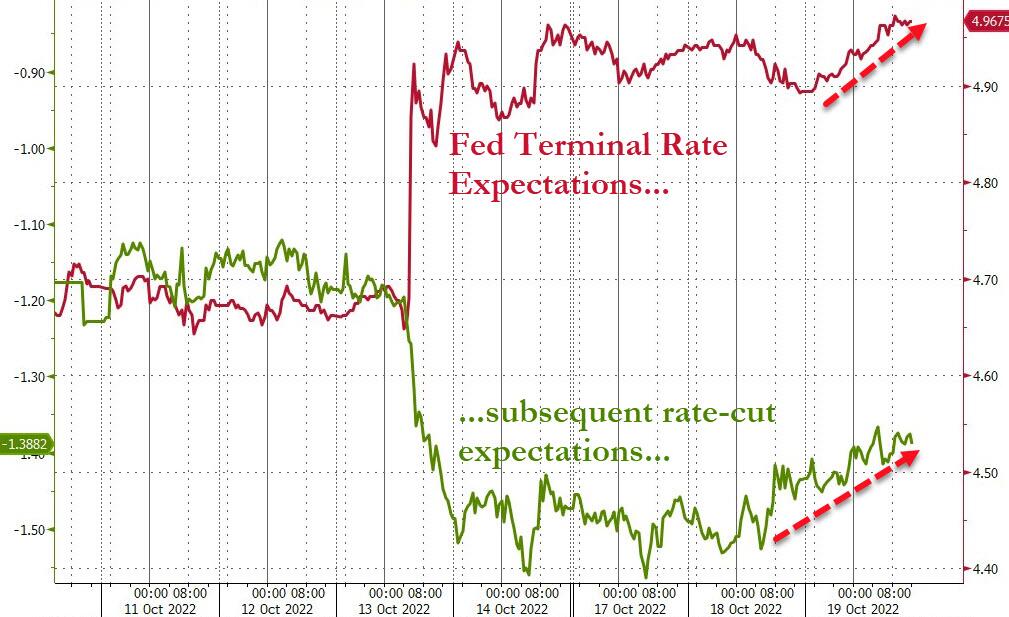
While we may see a similar pattern play out again, the big unknown here is the Fed and its “anticipated” (not announced) intentions. If in fact they pause or pivot, we will likely see this bear market rally turn into a new bull market, which will then get us trend trackers back into equities.

Jumping in any time prior to our Trend Tracking Index (TTI) breaking its trend line to the upside is like trying to catch a falling knife, and we’ve witnessed how that idea ended up in nothing but financial pain on six occasions this year. As tempting as it may be, it’s wiser to let a bullish trend establish itself before pushing the Buy button.

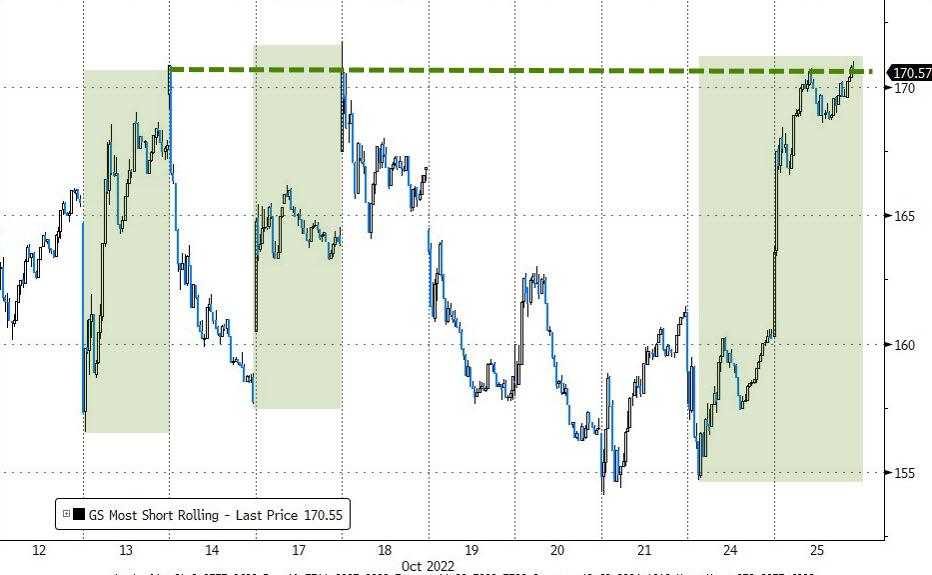
The fact that earnings estimates have been reduced by analysts allowed companies to fare better than anticipated, thereby proving some support for the current rally, despite decreases in 2023 forecasts. And, of course, a short-squeeze was activated and contributed to the melt-up.

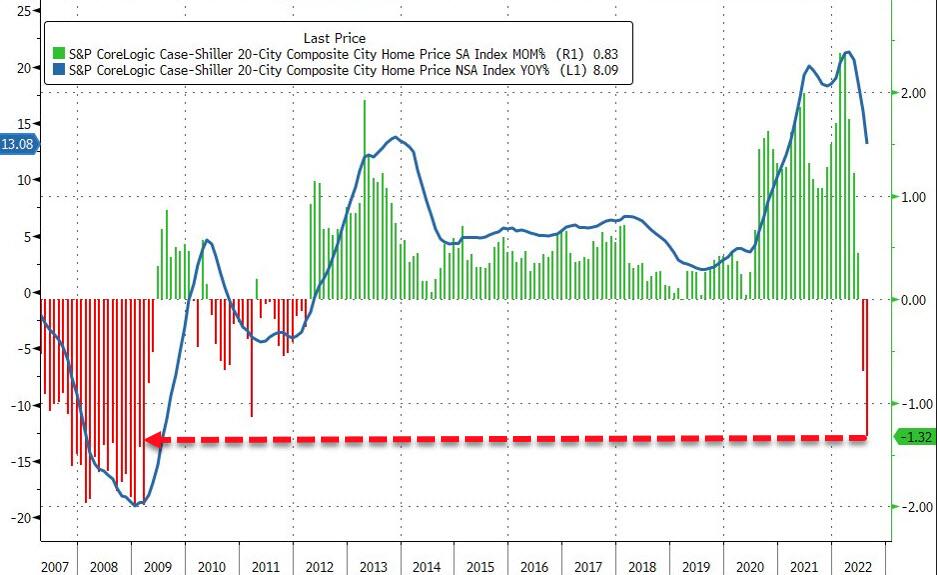
On the economic side, we learned that Consumer Sentiment tumbled with current conditions crashing to 18-month lows, as ZeroHedge reported. Real estate news was just as ugly, as home prices plunged the most since 2009, but fear not, any bad news was seen as good news for the markets—at least for this day.    

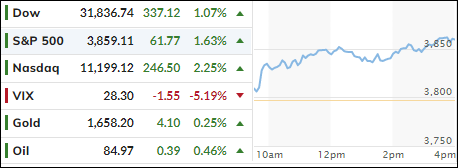
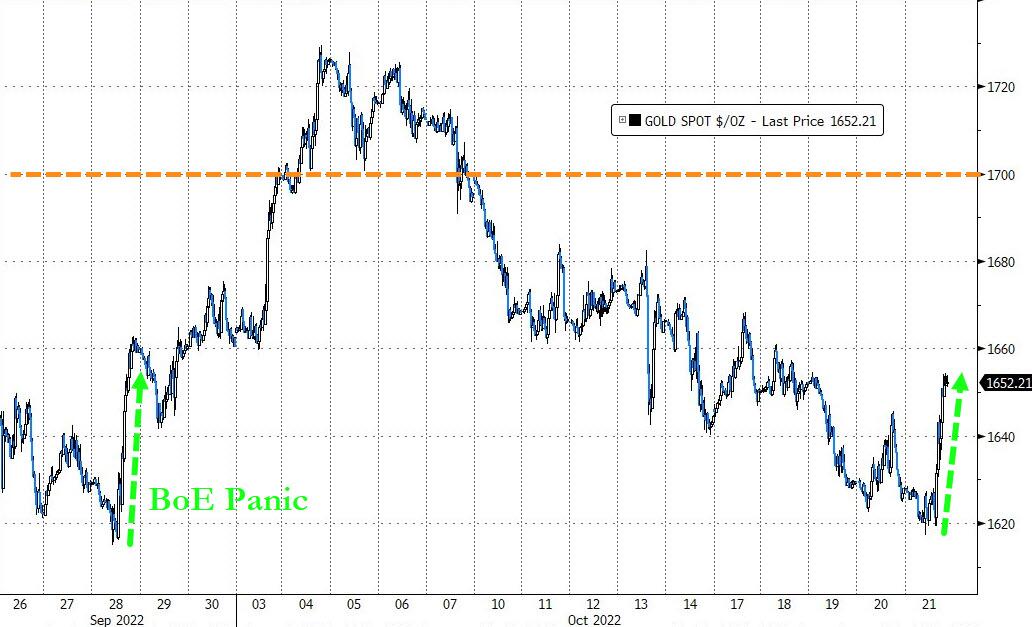
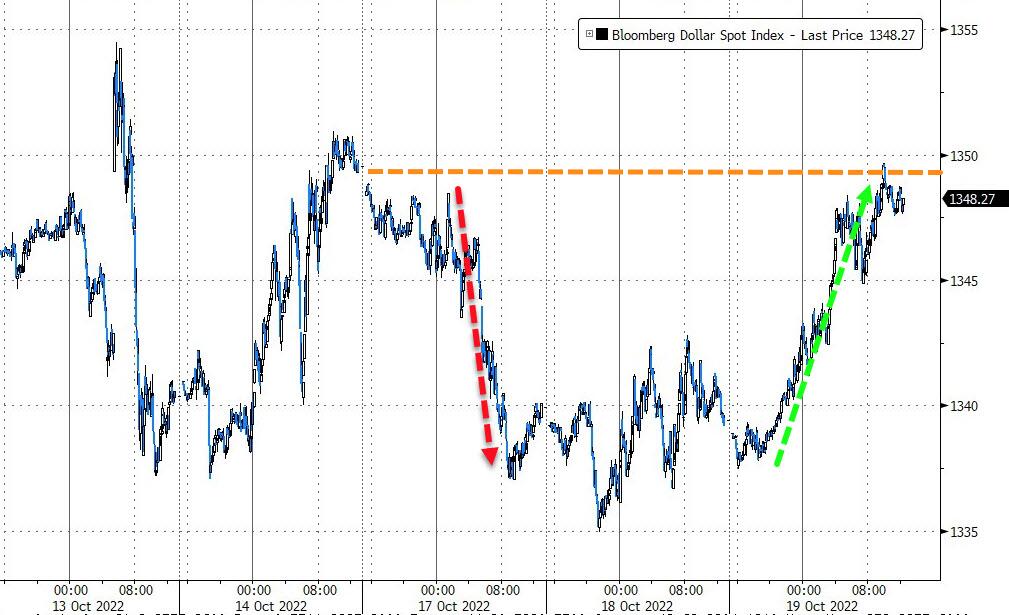
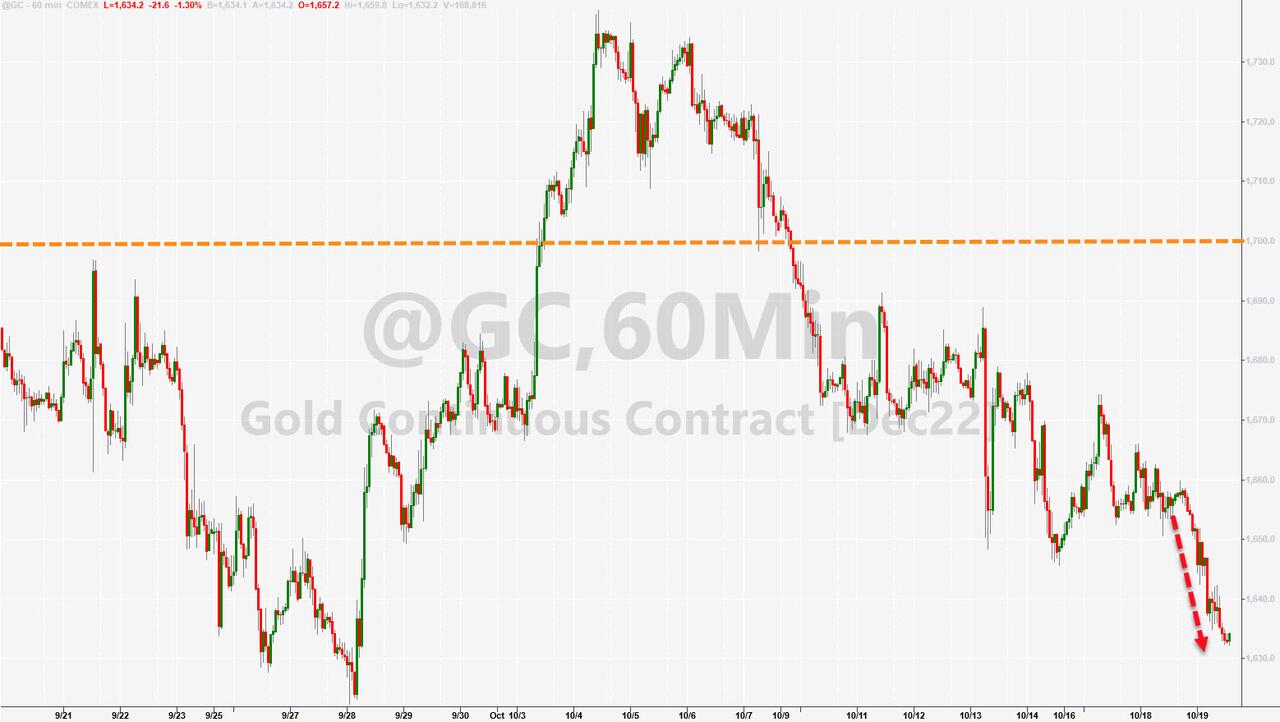
The US Dollar dropped to 3-week lows, which benefited gold, and the precious metal gained some ground but has a way to go get back to its old highs.

In terms of earnings, the big boys are on deck with Alphabet and Microsoft due out this afternoon, which is followed by Amazon’s and Apple’s report cards on Thursday.

Read More

Climbing A Wall Of Worry

Ulli Market Commentary Contact

[Chart courtesy of MarketWatch.com]

  1. Moving the markets

Despite a rollercoaster ride in the futures market overnight, and a plunge in the Chinese stock market of -6.4%, its largest one-day drop since 2008, US sentiment remained positive after the opening bell rang.

It’s all about earnings and forward guidance this week, with 46% of S&P members reporting. However, inflation data and bond yields will always be on centerstage with traders now “whispering” that the Fed might be stepping off the gas pedal regarding their hiking pace with a “pause” to be hopefully on deck.

All the above is not based on facts, but merely wishful thinking, but so far it has had the desired effect of keeping the bullish theme alive. We have seen this pattern numerous times this year, but all prior attempts eventually died on the vine, and new yearly lows were subsequently made. Only time will tell if this “melt up” has enough legs to eventually generate a new “Buy” signal (section 3).

Economically, things looked pretty dire as Manufactu9irng and Service PMIs, tumbled into contraction, as ZeroHedge reported:

  • US Manufacturing 49.9 (contraction), below 51.0 exp and down from 52.0 prior
  • US Services 46.6 (contraction), below 49.5 exp and down from 49.3 prior.

Of course, nobody calls it a recession anymore, so we’re in tune with the fact that bad news is good news for the markets, as the eventual “Powell Pivot” hope (from hawkish to dovish) is all that matters. Go figure…

Even higher bond yields could not keep equities down, as the 10-year swung wildly and closed at 4.255%, near its recent highs. The US Dollar meandered aimlessly and so did Gold, with neither having much to show for in the end.

Read More

ETFs On The Cutline – Updated Through 10/21/2022

Ulli ETFs on the Cutline Contact

Below, please find the latest High-Volume ETF Cutline report, which shows how far above or below their respective long-term trend lines (39-week SMA) my currently tracked ETFs are positioned.

This report covers the HV ETF Master List from Thursday’s StatSheet and includes 312 High Volume ETFs, defined as those with an average daily volume of more than $5 million, of which currently 22 (last week 16) are hovering in bullish territory. The yellow line separates those ETFs that are positioned above their trend line (%M/A) from those that have dropped below it.

Take a look:                                                                   

The HV ETF Master Cutline Report

In case you are not familiar with some of the terminology used in the reports, please read the Glossary of Terms. If you missed the original post about the Cutline approach, you can read it here.      

ETF Tracker Newsletter For October 21, 2022

Ulli ETF Tracker Contact

ETF Tracker StatSheet          

You can view the latest version here.

FINALLY—A WINNING WEEK

[Chart courtesy of MarketWatch.com]

  1. Moving the markets

After dropping into oversold territory last week, it was time a for a bounce back, and that is exactly what we got. Despite some mid-week weakness, the major indexes found some footing and propelled themselves to a solid green close.

Surging bond yields and some disappointing earnings reports did not help, yet bullish sentiment prevailed. However, like most bounces we have seen, none of them had staying power past a few days, which means that this rebound of hope is not guaranteed to continue next week.

Added Greenlight Capital’s David Einhorn:

As long as official policy is to make the stock market go down, so that people are less wealthy, so that they buy fewer things, so that prices stop going up, all while doing nothing about fiscal policy, we believe the correct posture is to be bearish on stocks and bullish on inflation.

However, helping the bullish cause today were the Fed’s mouthpieces offering a glimmer of dovish hope mixed in with some hawkishness:

*DALY: LITTLE BIT OF PENT-UP TIGHTENING WORKING THROUGH ECONOMY

*DALY: NEED TO WATCH HOW RESTRICTIVE; CAN’T OVERTIGHTEN EITHER; REQUIRES STEP DOWN INTO SMALLER INCREMENTS OF HIKES

*DALY: THINK HARD ABOUT STEP DOWN BUT WE’RE NOT THERE YET

*EVANS: EXPECT FED TO RAISE RATES FURTHER, HOLD STANCE A WHILE

*BULLARD: STRONG JOB MARKET GIVES FED LEEWAY TO FIGHT INFLATION

As ZeroHedge pointed out, the result was a dovish drop in terminal rate expectations, but a hawkish shift in subsequent rate-cut expectations, as this graph shows. In other words, the guesswork as to if/when the Fed will pivot continues, despite tightening financial conditions with accusations growing louder by the day that the Fed wants to “crash the economy.”

For a change, bond yields softened today, which contributed to the bullish meme, as the 10-year retreated slightly but remains firmly entrenched above its 4% level at 4.228%. The US Dollar dumped big time to its worst weekly drop since August, which helped Gold to a solid gain of +1.49% on the day.  

Despite this week’s comeback, I believe the Fed is not done hiking, as much as traders like to believe it, because Fed President Bullard made that abundantly clear when he stated that “I would not call lower equity prices financial stress.” (A tip of the hat to ZeroHedge for this reference)

This risk remains to the downside, as all indications are that dollar funding around the world remains problematic, which means something could very well break in the financial system and push equities considerably lower.

Therefore, it’s wise to be in safety mode on the sidelines by favoring the return of your capital than on your capital.  

Read More

Weekly StatSheet For The ETF Tracker Newsletter – Updated Through 10/20/2022

Ulli ETF StatSheet Contact

ETF Data updated through Thursday, October 20, 2022

Methodology/Use of this StatSheet:

1. From the universe of over 1,800 ETFs, I have selected only those with a trading volume of over $5 million per day (HV ETFs), so that liquidity and a small bid/ask spread are assured.

2. Trend Tracking Indexes (TTIs)

Buy or Sell decisions for Domestic and International ETFs (section 1 and 2), are made based on the respective TTI and its position either above or below its long-term M/A (Moving Average). A crossing of the trend line from below accompanied by some staying power above constitutes a “Buy” signal. Conversely, a clear break below the line constitutes a “Sell” signal. Additionally, I use a 12% trailing stop loss on all positions in these categories to control downside risk.

3. All other investment arenas do not have a TTI and should be traded based on the position of the individual ETF relative to its own respective trend line (%M/A). That’s why those signals are referred to as a “Selective Buy.” In other words, if an ETF crosses its own trendline to the upside, a “Buy” signal is generated. Here too, I recommend trailing sell stop of 12%, or less, depending on your risk tolerance.

If you are unfamiliar with some of the terminology, please see Glossary of Terms and new subscriber information in section 9.     

1. DOMESTIC EQUITY ETFs: SELL — since 02/24/2022

Click on chart to enlarge

Our main directional indicator, the Domestic Trend Tracking Index (TTI-green line in the above chart) has broken below its long-term trend line (red) by -10.11% and remains in “SELL” mode.  

Read More

Surging Bond Yields Punish Stocks

Ulli Market Commentary Contact

[Chart courtesy of MarketWatch.com]

  1. Moving the markets

Despite Netflix’s beating of earnings and revenue, and its shares rallying some 13%, it was simply not enough to overcome the negatives of surging bond yields, which indicated that inflation fears have not subsided and won’t soon.

As a result, the major indexes gave back some of their gains of the past two days, but they held up better than expected given the solid crossing of the 4% level by the 10-year yield, which closed higher by almost 12-bps to end the session at 4.128%, its highest point since July 2008.

For sure, today’s menu of bad news was not good news for the markets for a change, with UK inflation (back above 10%), Ukraine tensions, ugly housing starts, hawkish Kashkari comments and more UK government chaos could not get traders and algos to push the ‘Buy” buttons, as ZeroHedge lamented.  

Rate-hike expectations shifted into more hawkish mode (higher rates) followed by higher subsequent rate-cut expectations, meaning that the prior terminal rate, the moment in time when the Fed is expected to pivot, has been pushed up a notch to about 4.977%.

This also means that the market is now pricing in a full 75-bps increase for November with odds of a 75-bps hike having risen to 60%. Unless the Fed suddenly changes its mind and pauses, rates will continue to ratchet higher and exert more pain into the equity arena.  

9 out of the 10 S&P sectors ended the session in the red with the lowly exception of Energy, which advanced over 3%. The US Dollar reversed its recent slide punishing Gold in the process.

Read More