
- Moving the markets
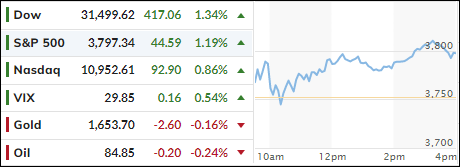
Despite a rollercoaster ride in the futures market overnight, and a plunge in the Chinese stock market of -6.4%, its largest one-day drop since 2008, US sentiment remained positive after the opening bell rang.
It’s all about earnings and forward guidance this week, with 46% of S&P members reporting. However, inflation data and bond yields will always be on centerstage with traders now “whispering” that the Fed might be stepping off the gas pedal regarding their hiking pace with a “pause” to be hopefully on deck.
All the above is not based on facts, but merely wishful thinking, but so far it has had the desired effect of keeping the bullish theme alive. We have seen this pattern numerous times this year, but all prior attempts eventually died on the vine, and new yearly lows were subsequently made. Only time will tell if this “melt up” has enough legs to eventually generate a new “Buy” signal (section 3).
Economically, things looked pretty dire as Manufactu9irng and Service PMIs, tumbled into contraction, as ZeroHedge reported:
- US Manufacturing 49.9 (contraction), below 51.0 exp and down from 52.0 prior
- US Services 46.6 (contraction), below 49.5 exp and down from 49.3 prior.
Of course, nobody calls it a recession anymore, so we’re in tune with the fact that bad news is good news for the markets, as the eventual “Powell Pivot” hope (from hawkish to dovish) is all that matters. Go figure…
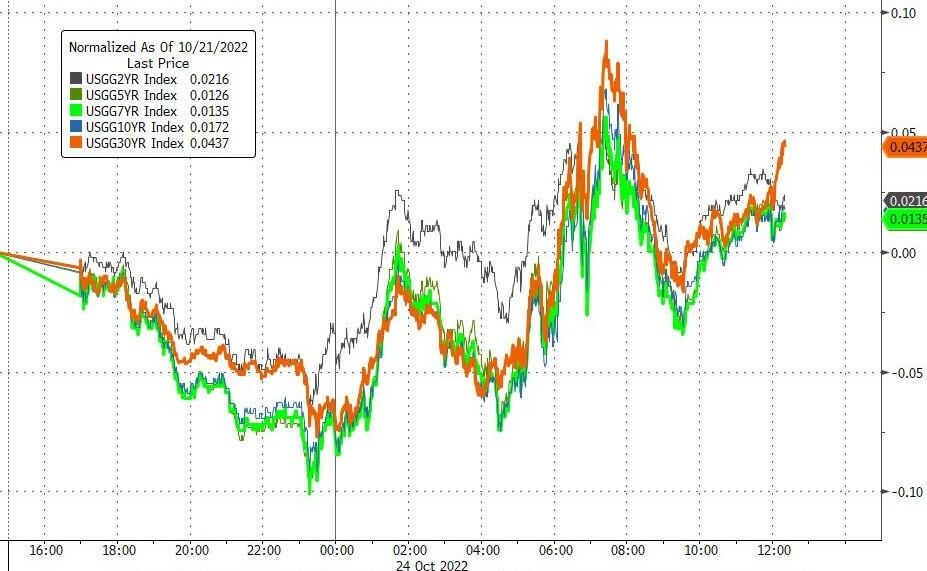
Even higher bond yields could not keep equities down, as the 10-year swung wildly and closed at 4.255%, near its recent highs. The US Dollar meandered aimlessly and so did Gold, with neither having much to show for in the end.
2. ETFs in the Spotlight
In case you missed the announcement and description of this section, you can read it here again.
It features some of the 10 broadly diversified domestic and sector ETFs from my HighVolume list as posted every Saturday. Furthermore, they are screened for the lowest MaxDD% number meaning they have been showing better resistance to temporary sell offs than all others over the past year.
The below table simply demonstrates the magnitude with which these ETFs are fluctuating above or below their respective individual trend lines (%+/-M/A). A break below, represented by a negative number, shows weakness, while a break above, represented by a positive percentage, shows strength.
For hundreds of ETF choices, be sure to reference Thursday’s StatSheet.
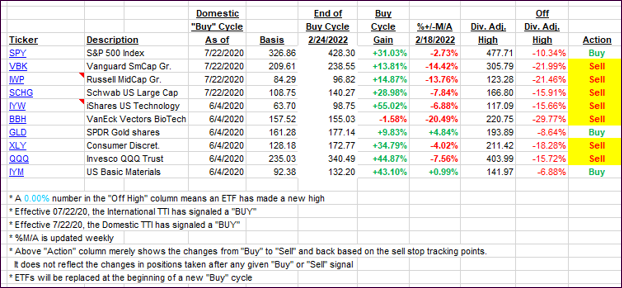
For this closed-out domestic “Buy” cycle (2/24/2022), here’s how some of our candidates have fared. Keep in mind that our Domestic Trend Tracking Index (TTI) signaled a “Sell” on that date, which overrode the existing “Buys” shown for SPY and IYM:
Click image to enlarge.
Again, the %+/-M/A column above shows the position of the various ETFs in relation to their respective long-term trend lines, while the trailing sell stops are being tracked in the “Off High” column. The “Action” column will signal a “Sell” once the -12% point has been taken out in the “Off High” column, which has replaced the prior -8% to -10% limits.
3. Trend Tracking Indexes (TTIs)
Our TTIs advanced with last week’s bullish tone continuing.
This is how we closed 10/24/2022:
Domestic TTI: -6.73% below its M/A (prior close -7.76%)—Sell signal effective 02/24/2022.
International TTI: -10.17% below its M/A (prior close -10.55%)—Sell signal effective 03/08/2022.
Disclosure: I am obliged to inform you that I, as well as my advisory clients, own some of the ETFs listed in the above table. Furthermore, they do not represent a specific investment recommendation for you, they merely show which ETFs from the universe I track are falling within the specified guidelines.
All linked charts above are courtesy of Bloomberg via ZeroHedge.
Contact Ulli