
- Moving the markets
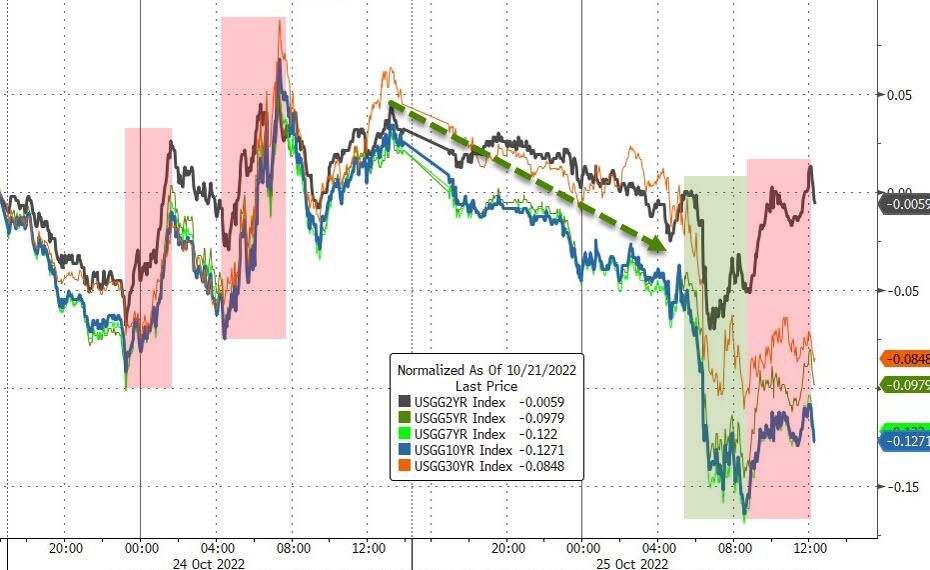
Plunging bond yields provided the perfect background to keep the bear market rally intact for the third day, a scenario we’ve witnessed several times this year. The largest drop and subsequent rebound happened in June, when the S&P 500 exploded off its bottom by 19.2% only to shift in reverse and surrender all gains:
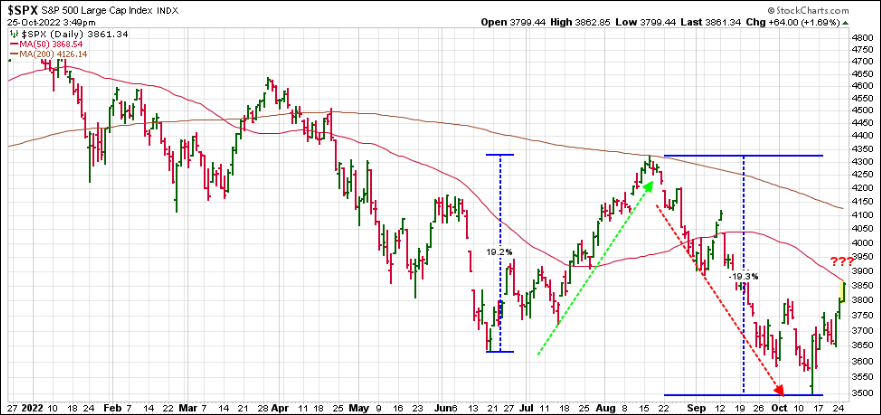
While we may see a similar pattern play out again, the big unknown here is the Fed and its “anticipated” (not announced) intentions. If in fact they pause or pivot, we will likely see this bear market rally turn into a new bull market, which will then get us trend trackers back into equities.
Jumping in any time prior to our Trend Tracking Index (TTI) breaking its trend line to the upside is like trying to catch a falling knife, and we’ve witnessed how that idea ended up in nothing but financial pain on six occasions this year. As tempting as it may be, it’s wiser to let a bullish trend establish itself before pushing the Buy button.
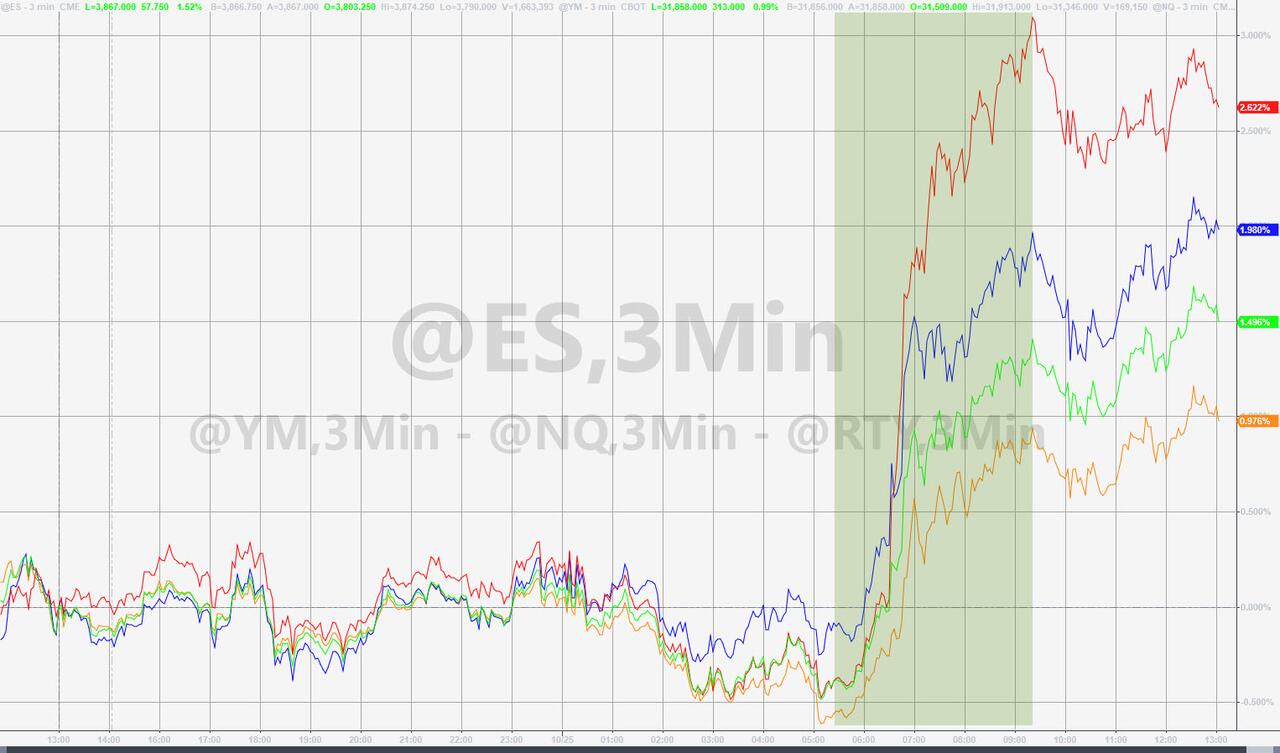
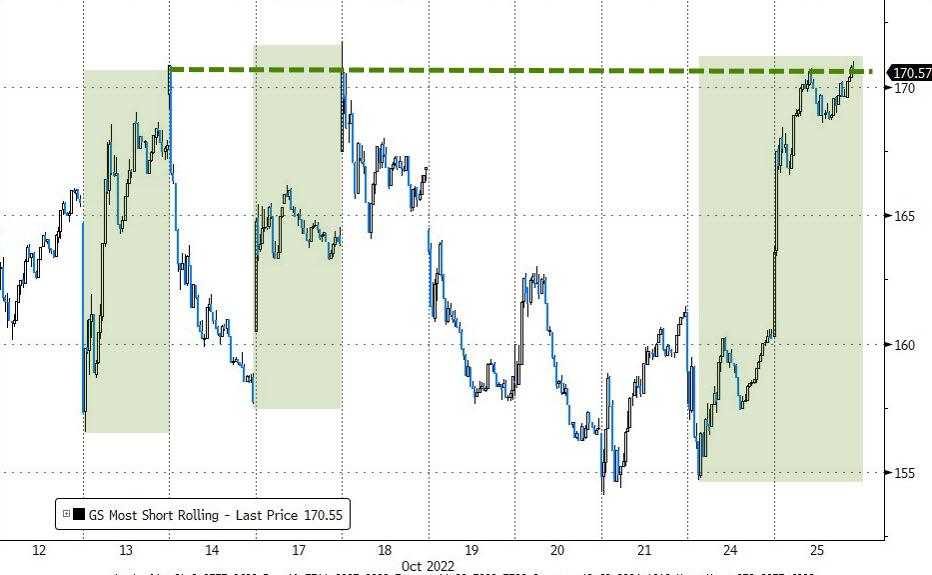
The fact that earnings estimates have been reduced by analysts allowed companies to fare better than anticipated, thereby proving some support for the current rally, despite decreases in 2023 forecasts. And, of course, a short-squeeze was activated and contributed to the melt-up.
On the economic side, we learned that Consumer Sentiment tumbled with current conditions crashing to 18-month lows, as ZeroHedge reported. Real estate news was just as ugly, as home prices plunged the most since 2009, but fear not, any bad news was seen as good news for the markets—at least for this day.
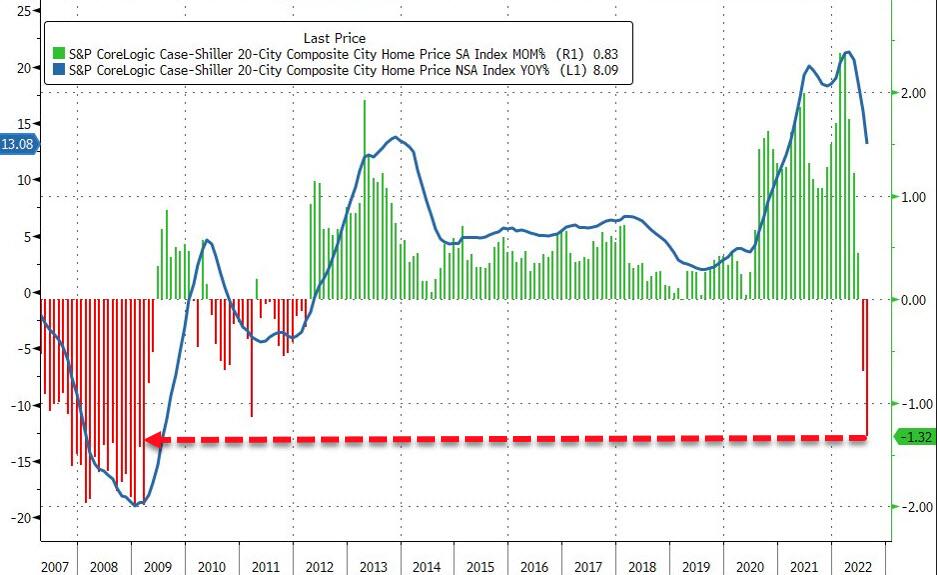
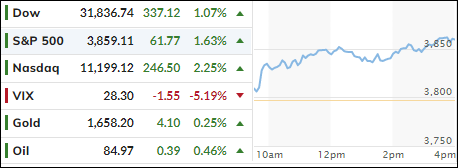
The US Dollar dropped to 3-week lows, which benefited gold, and the precious metal gained some ground but has a way to go get back to its old highs.
In terms of earnings, the big boys are on deck with Alphabet and Microsoft due out this afternoon, which is followed by Amazon’s and Apple’s report cards on Thursday.
2. ETFs in the Spotlight
In case you missed the announcement and description of this section, you can read it here again.
It features some of the 10 broadly diversified domestic and sector ETFs from my HighVolume list as posted every Saturday. Furthermore, they are screened for the lowest MaxDD% number meaning they have been showing better resistance to temporary sell offs than all others over the past year.
The below table simply demonstrates the magnitude with which these ETFs are fluctuating above or below their respective individual trend lines (%+/-M/A). A break below, represented by a negative number, shows weakness, while a break above, represented by a positive percentage, shows strength.
For hundreds of ETF choices, be sure to reference Thursday’s StatSheet.
For this closed-out domestic “Buy” cycle (2/24/2022), here’s how some of our candidates have fared. Keep in mind that our Domestic Trend Tracking Index (TTI) signaled a “Sell” on that date, which overrode the existing “Buys” shown for SPY and IYM:
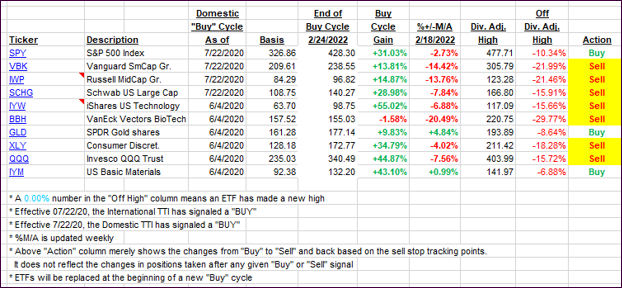
Click image to enlarge.
Again, the %+/-M/A column above shows the position of the various ETFs in relation to their respective long-term trend lines, while the trailing sell stops are being tracked in the “Off High” column. The “Action” column will signal a “Sell” once the -12% point has been taken out in the “Off High” column, which has replaced the prior -8% to -10% limits.
3. Trend Tracking Indexes (TTIs)
Our TTIs made progress by moving closer to their respective trend lines. We are seeing a strong bear market rally but need to see more upside momentum before moving back into the market. After all, bear market bounces can end just as quickly as they started.
This is how we closed 10/25/2022:
Domestic TTI: -4.94% below its M/A (prior close -6.73%)—Sell signal effective 02/24/2022.
International TTI: -8.81% below its M/A (prior close -10.17%)—Sell signal effective 03/08/2022.
Disclosure: I am obliged to inform you that I, as well as my advisory clients, own some of the ETFs listed in the above table. Furthermore, they do not represent a specific investment recommendation for you, they merely show which ETFs from the universe I track are falling within the specified guidelines.
All linked charts above are courtesy of Bloomberg via ZeroHedge.
Contact Ulli