
- Moving the markets
Despite Netflix’s beating of earnings and revenue, and its shares rallying some 13%, it was simply not enough to overcome the negatives of surging bond yields, which indicated that inflation fears have not subsided and won’t soon.
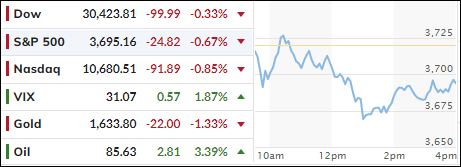
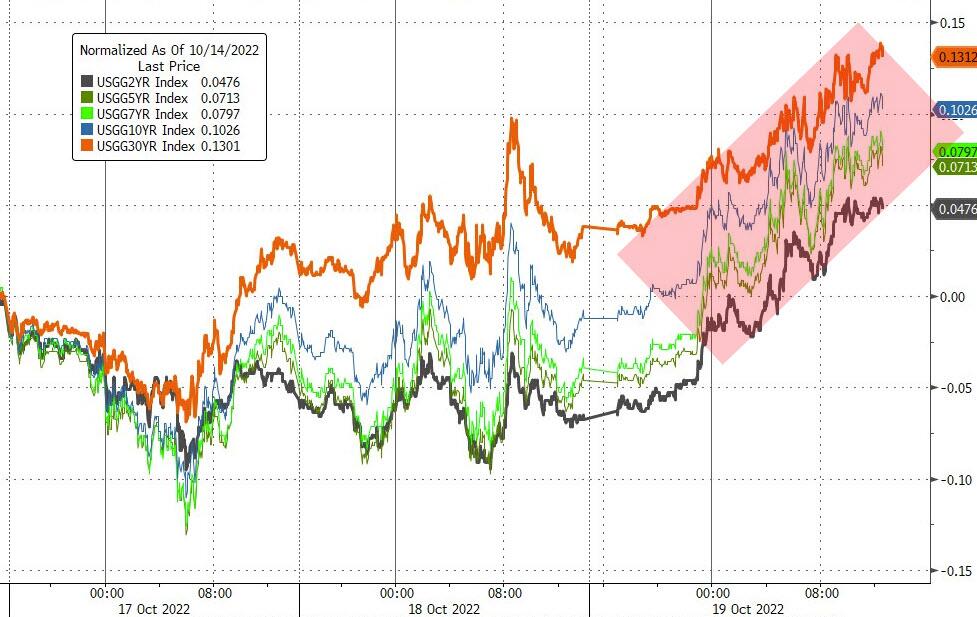
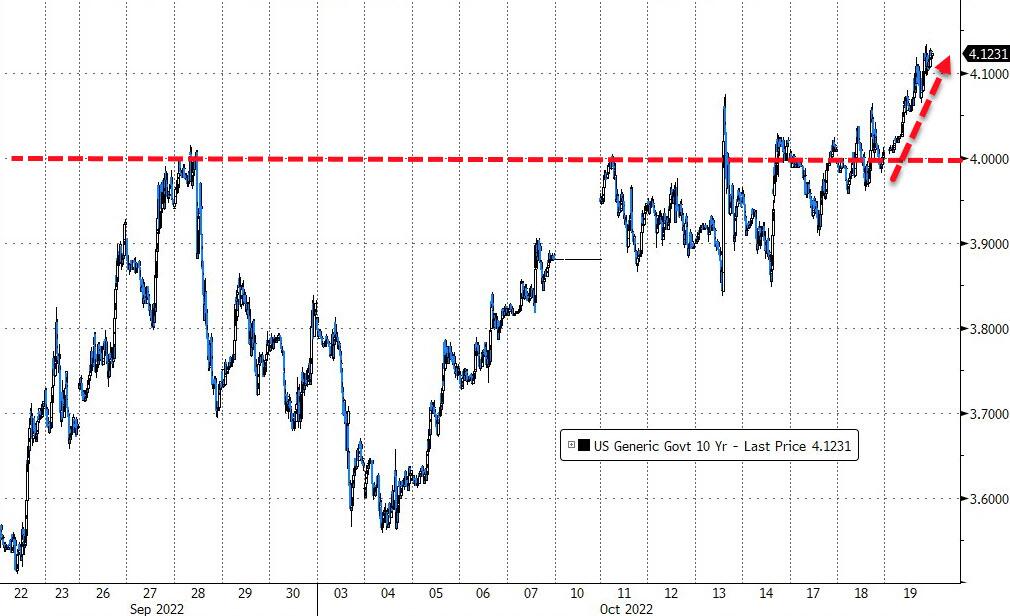
As a result, the major indexes gave back some of their gains of the past two days, but they held up better than expected given the solid crossing of the 4% level by the 10-year yield, which closed higher by almost 12-bps to end the session at 4.128%, its highest point since July 2008.
For sure, today’s menu of bad news was not good news for the markets for a change, with UK inflation (back above 10%), Ukraine tensions, ugly housing starts, hawkish Kashkari comments and more UK government chaos could not get traders and algos to push the ‘Buy” buttons, as ZeroHedge lamented.
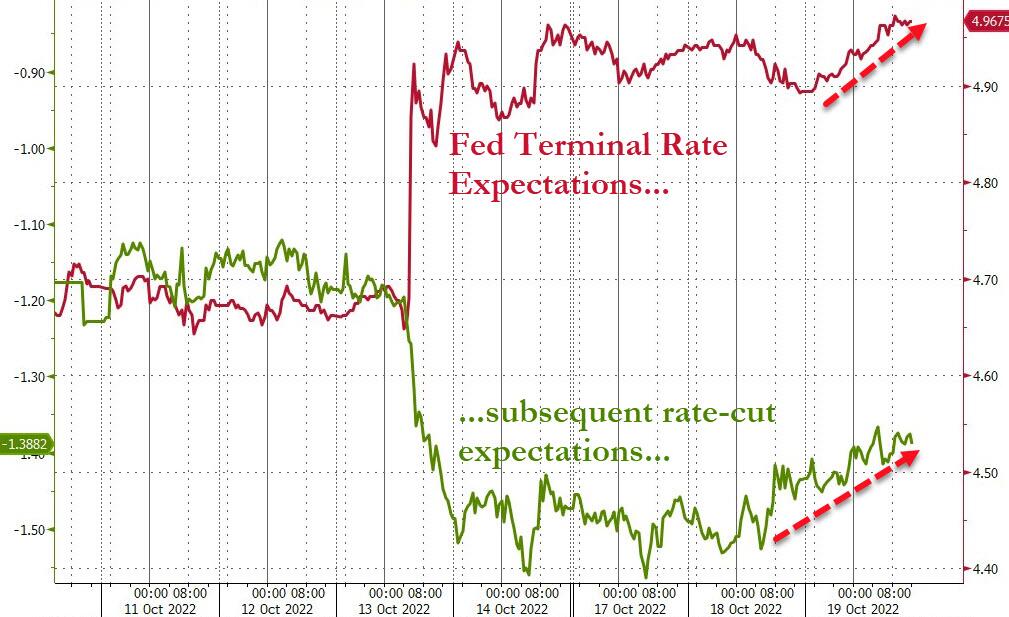
Rate-hike expectations shifted into more hawkish mode (higher rates) followed by higher subsequent rate-cut expectations, meaning that the prior terminal rate, the moment in time when the Fed is expected to pivot, has been pushed up a notch to about 4.977%.
This also means that the market is now pricing in a full 75-bps increase for November with odds of a 75-bps hike having risen to 60%. Unless the Fed suddenly changes its mind and pauses, rates will continue to ratchet higher and exert more pain into the equity arena.
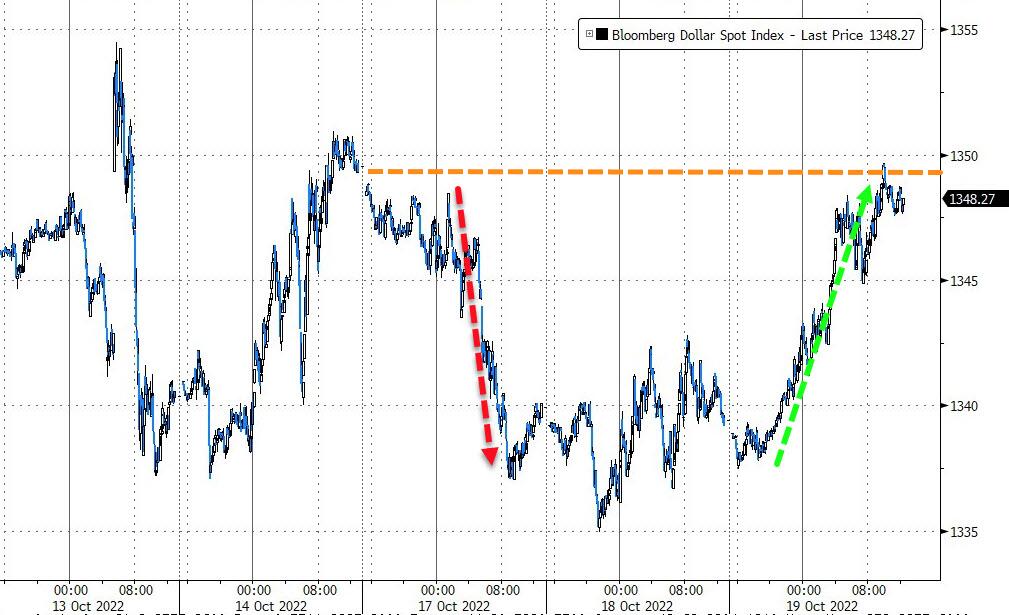
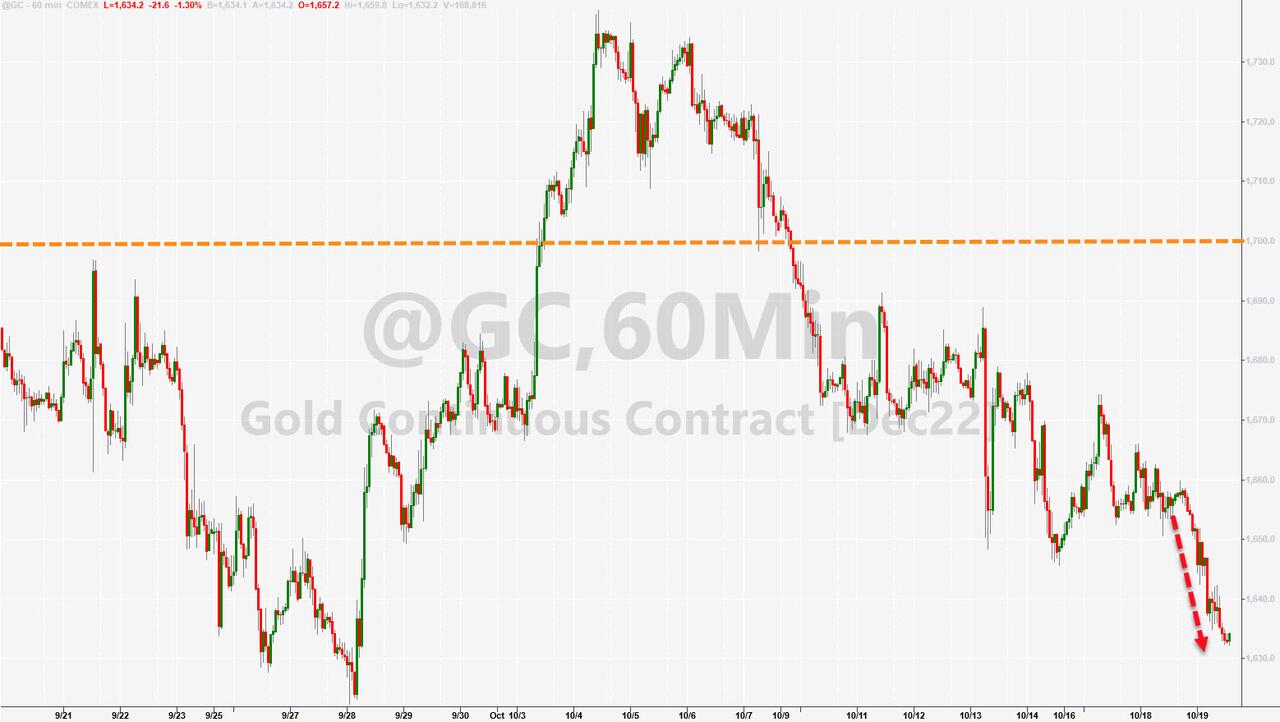
9 out of the 10 S&P sectors ended the session in the red with the lowly exception of Energy, which advanced over 3%. The US Dollar reversed its recent slide punishing Gold in the process.
2. ETFs in the Spotlight
In case you missed the announcement and description of this section, you can read it here again.
It features some of the 10 broadly diversified domestic and sector ETFs from my HighVolume list as posted every Saturday. Furthermore, they are screened for the lowest MaxDD% number meaning they have been showing better resistance to temporary sell offs than all others over the past year.
The below table simply demonstrates the magnitude with which these ETFs are fluctuating above or below their respective individual trend lines (%+/-M/A). A break below, represented by a negative number, shows weakness, while a break above, represented by a positive percentage, shows strength.
For hundreds of ETF choices, be sure to reference Thursday’s StatSheet.
For this closed-out domestic “Buy” cycle (2/24/2022), here’s how some of our candidates have fared. Keep in mind that our Domestic Trend Tracking Index (TTI) signaled a “Sell” on that date, which overrode the existing “Buys” shown for SPY and IYM:

Click image to enlarge.
Again, the %+/-M/A column above shows the position of the various ETFs in relation to their respective long-term trend lines, while the trailing sell stops are being tracked in the “Off High” column. The “Action” column will signal a “Sell” once the -12% point has been taken out in the “Off High” column, which has replaced the prior -8% to -10% limits.
3. Trend Tracking Indexes (TTIs)
Our TTIs reversed again and slipped deeper into bear market territory.
This is how we closed 10/19/2022:
Domestic TTI: -9.10% below its M/A (prior close -8.01%)—Sell signal effective 02/24/2022.
International TTI: -12.24% below its M/A (prior close -11.79%)—Sell signal effective 03/08/2022.
Disclosure: I am obliged to inform you that I, as well as my advisory clients, own some of the ETFs listed in the above table. Furthermore, they do not represent a specific investment recommendation for you, they merely show which ETFs from the universe I track are falling within the specified guidelines.
All linked charts above are courtesy of Bloomberg via ZeroHedge.
Contact Ulli