
ETF Tracker StatSheet
You can view the latest version here.
FINALLY—A WINNING WEEK
- Moving the markets
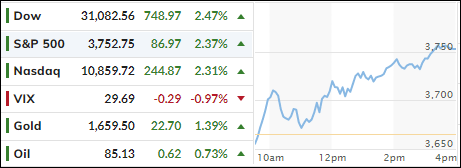
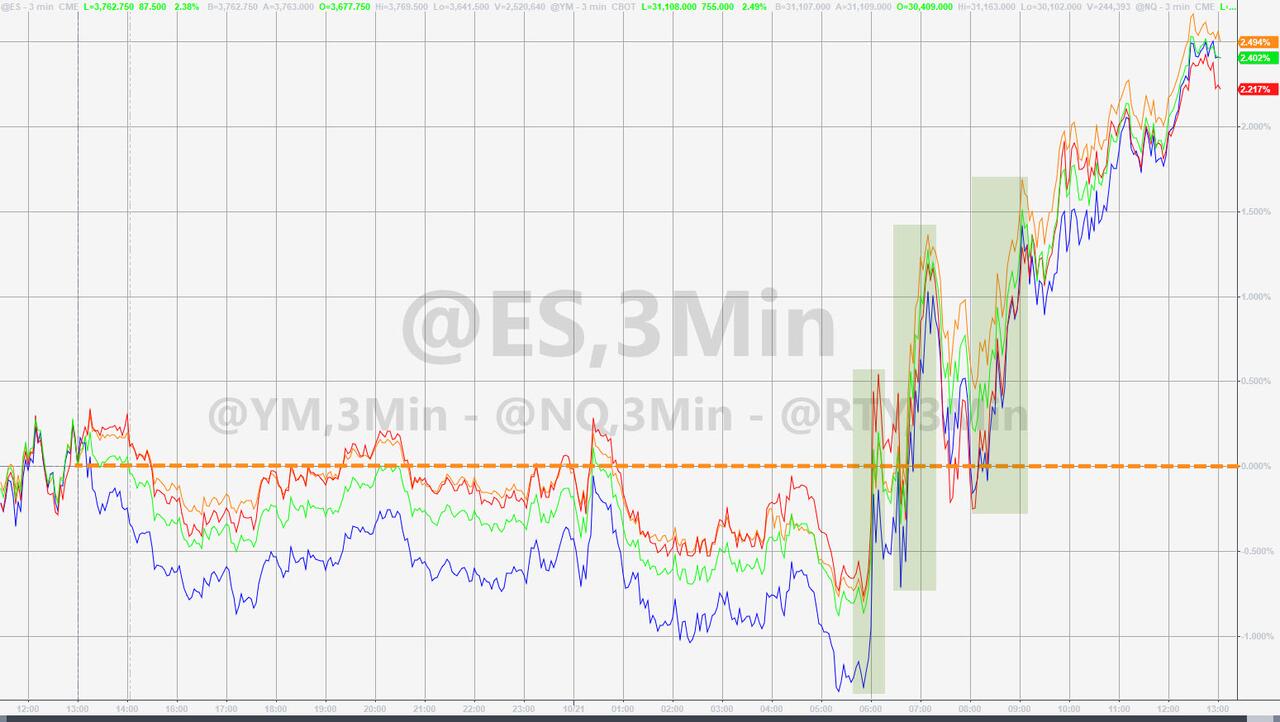
After dropping into oversold territory last week, it was time a for a bounce back, and that is exactly what we got. Despite some mid-week weakness, the major indexes found some footing and propelled themselves to a solid green close.
Surging bond yields and some disappointing earnings reports did not help, yet bullish sentiment prevailed. However, like most bounces we have seen, none of them had staying power past a few days, which means that this rebound of hope is not guaranteed to continue next week.
Added Greenlight Capital’s David Einhorn:
As long as official policy is to make the stock market go down, so that people are less wealthy, so that they buy fewer things, so that prices stop going up, all while doing nothing about fiscal policy, we believe the correct posture is to be bearish on stocks and bullish on inflation.
However, helping the bullish cause today were the Fed’s mouthpieces offering a glimmer of dovish hope mixed in with some hawkishness:
*DALY: LITTLE BIT OF PENT-UP TIGHTENING WORKING THROUGH ECONOMY
*DALY: NEED TO WATCH HOW RESTRICTIVE; CAN’T OVERTIGHTEN EITHER; REQUIRES STEP DOWN INTO SMALLER INCREMENTS OF HIKES
*DALY: THINK HARD ABOUT STEP DOWN BUT WE’RE NOT THERE YET
*EVANS: EXPECT FED TO RAISE RATES FURTHER, HOLD STANCE A WHILE
*BULLARD: STRONG JOB MARKET GIVES FED LEEWAY TO FIGHT INFLATION
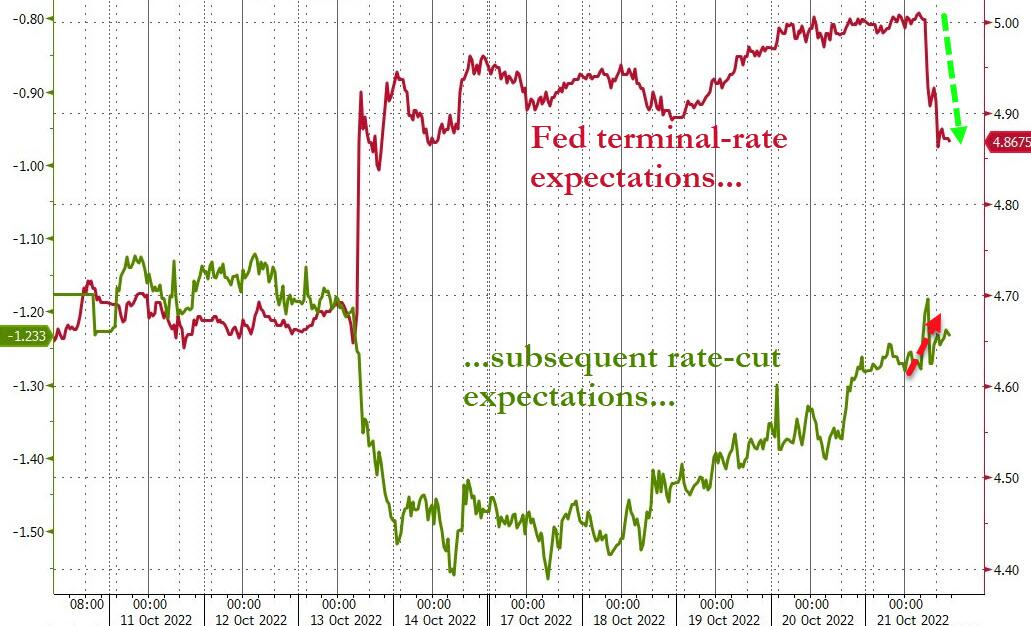
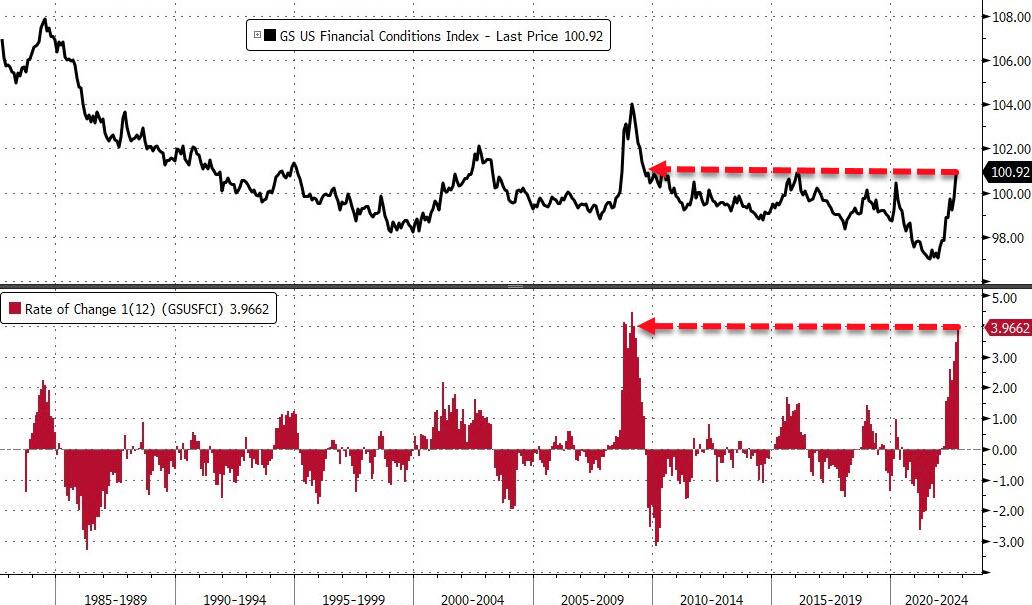
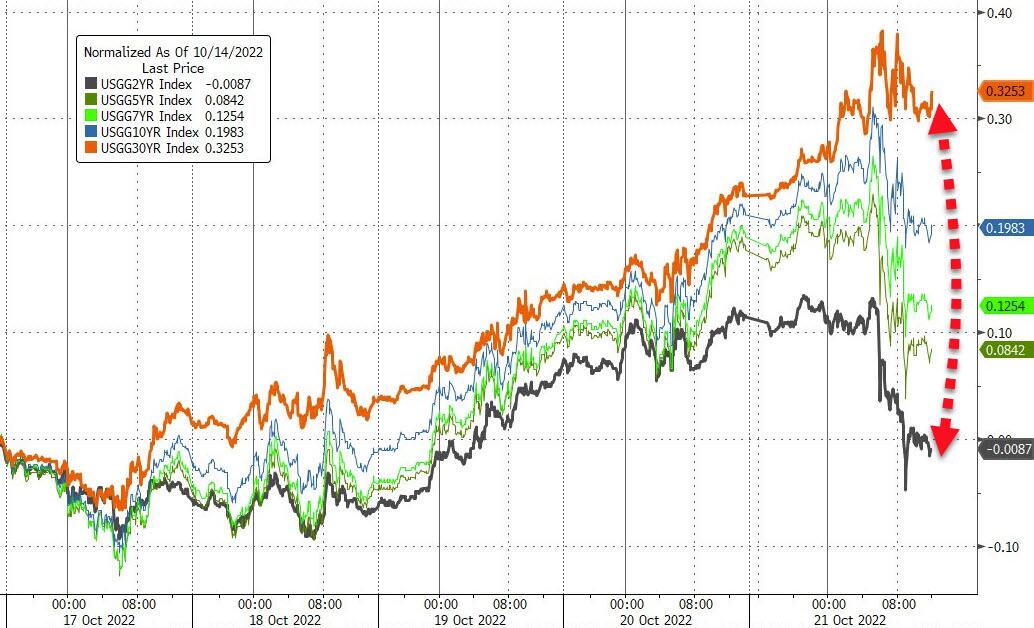
As ZeroHedge pointed out, the result was a dovish drop in terminal rate expectations, but a hawkish shift in subsequent rate-cut expectations, as this graph shows. In other words, the guesswork as to if/when the Fed will pivot continues, despite tightening financial conditions with accusations growing louder by the day that the Fed wants to “crash the economy.”
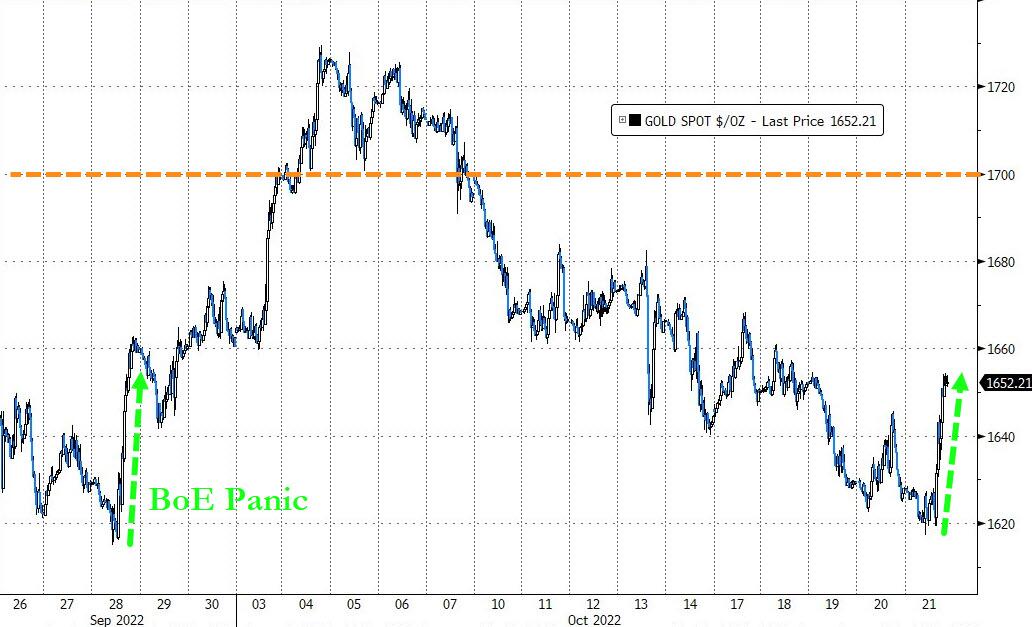
For a change, bond yields softened today, which contributed to the bullish meme, as the 10-year retreated slightly but remains firmly entrenched above its 4% level at 4.228%. The US Dollar dumped big time to its worst weekly drop since August, which helped Gold to a solid gain of +1.49% on the day.
Despite this week’s comeback, I believe the Fed is not done hiking, as much as traders like to believe it, because Fed President Bullard made that abundantly clear when he stated that “I would not call lower equity prices financial stress.” (A tip of the hat to ZeroHedge for this reference)
This risk remains to the downside, as all indications are that dollar funding around the world remains problematic, which means something could very well break in the financial system and push equities considerably lower.
Therefore, it’s wise to be in safety mode on the sidelines by favoring the return of your capital than on your capital.
2. ETFs in the Spotlight
In case you missed the announcement and description of this section, you can read it here again.
It features some of the 10 broadly diversified domestic and sector ETFs from my HighVolume list as posted every Saturday. Furthermore, they are screened for the lowest MaxDD% number meaning they have been showing better resistance to temporary sell offs than all others over the past year.
The below table simply demonstrates the magnitude with which these ETFs are fluctuating above or below their respective individual trend lines (%+/-M/A). A break below, represented by a negative number, shows weakness, while a break above, represented by a positive percentage, shows strength.
For hundreds of ETF choices, be sure to reference Thursday’s StatSheet.
For this closed-out domestic “Buy” cycle (2/24/2022), here’s how some of our candidates have fared. Keep in mind that our Domestic Trend Tracking Index (TTI) signaled a “Sell” on that date, which overrode the existing “Buys” shown for SPY and IYM:
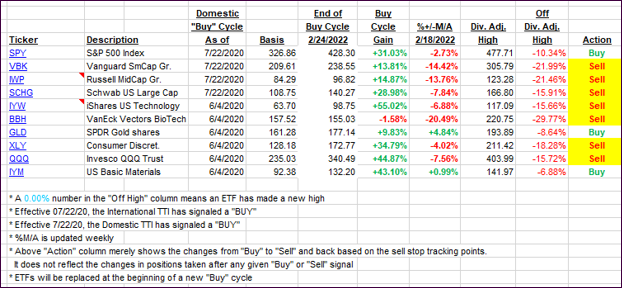
Click image to enlarge.
Again, the %+/-M/A column above shows the position of the various ETFs in relation to their respective long-term trend lines, while the trailing sell stops are being tracked in the “Off High” column. The “Action” column will signal a “Sell” once the -12% point has been taken out in the “Off High” column, which has replaced the prior -8% to -10% limits.
3. Trend Tracking Indexes (TTIs)
Our TTIs jumped as the bulls prevailed this week.
This is how we closed 10/21/2022:
Domestic TTI: -7.76% below its M/A (prior close -10.11%)—Sell signal effective 02/24/2022.
International TTI: -10.55% below its M/A (prior close -12.53%)—Sell signal effective 03/08/2022.
Disclosure: I am obliged to inform you that I, as well as my advisory clients, own some of the ETFs listed in the above table. Furthermore, they do not represent a specific investment recommendation for you, they merely show which ETFs from the universe I track are falling within the specified guidelines.
All linked charts above are courtesy of Bloomberg via ZeroHedge.
———————————————————-
WOULD YOU LIKE TO HAVE YOUR INVESTMENTS PROFESSIONALLY MANAGED?
Do you have the time to follow our investment plans yourself? If you are a busy professional who would like to have his portfolio managed using our methodology, please contact me directly to get more details.
Contact Ulli