
- Moving the markets
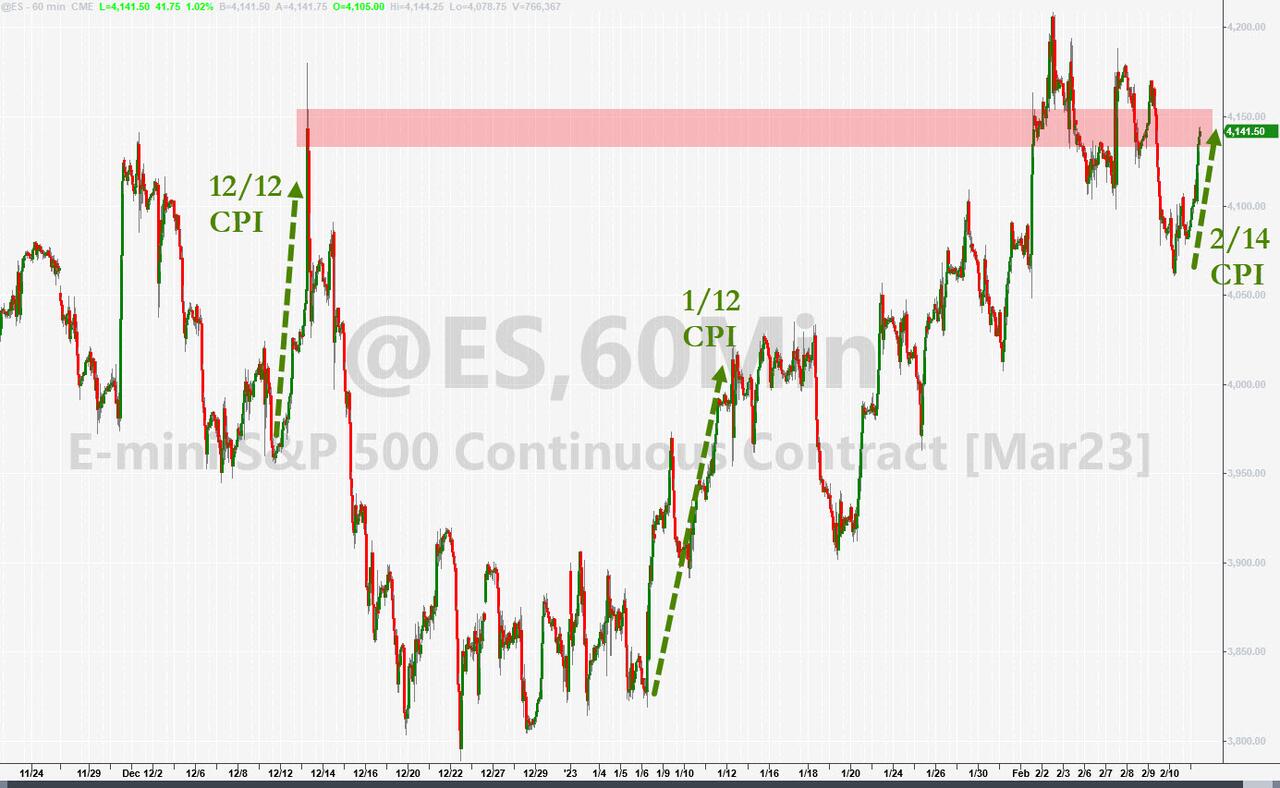
As we witnessed last month, traders maintained the same theme, namely front running the CPI report, on hopes that a weaker number will appear, which would persuade the Fed to take the foot of the hiking pedal, and that a more dovish stance towards interest rates would be appropriate.
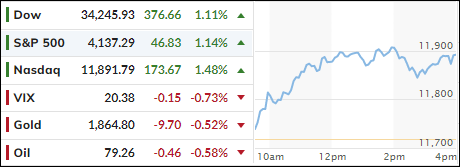
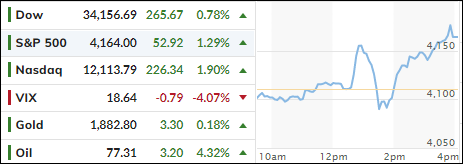
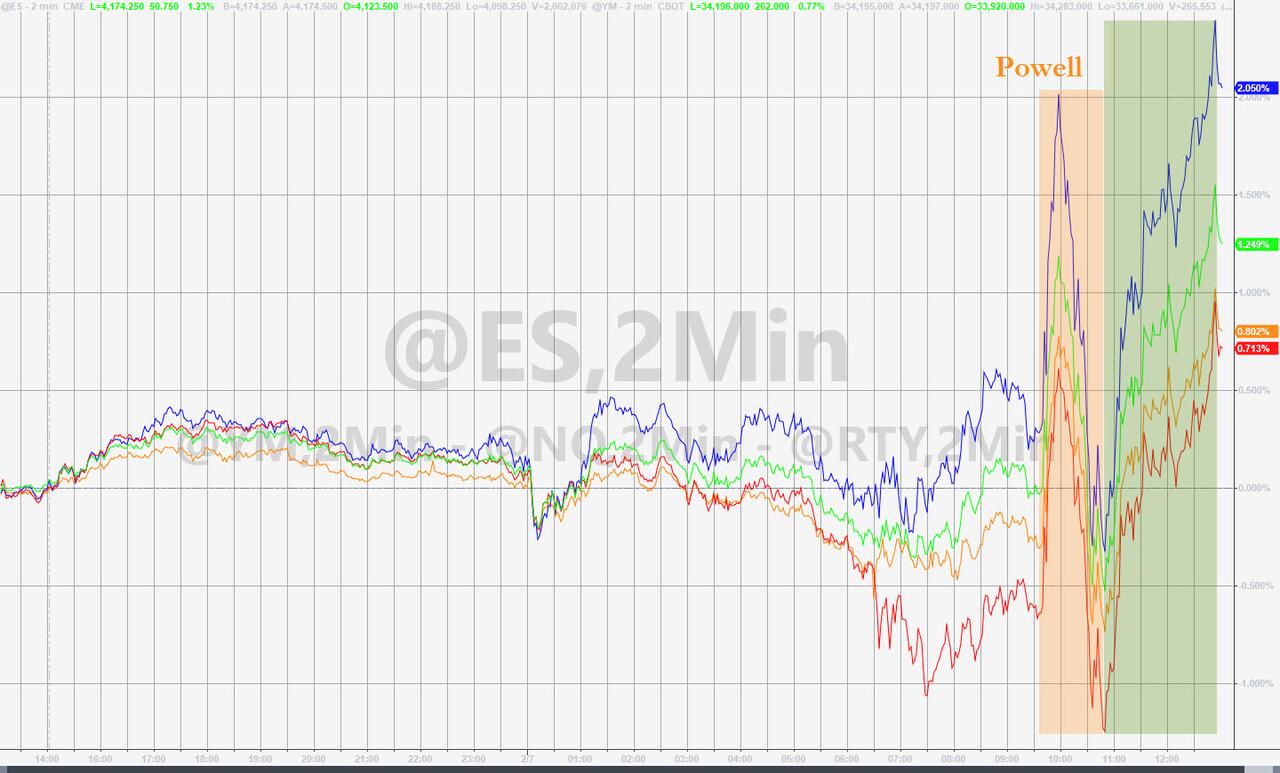
The major indexes tried to regain their footing after the S&P and Nasdaq suffered their worst weekly declines in the past 2 months, so some bottom fishing contributed to today’s bullish sentiment.
All eyes are on tomorrow’s CPI report, which will shed some light on whether price increases have continued or slowed down because of the Fed’s hiking policy. As today’s action showed, traders are betting that inflation is cooling and that the Fed will finally relent and pause or pivot. I don’t think they are even close to that.
Any CPI surprise to the upside will pull the rug out from under the bulls and bring bearish forces back into play. Also, the earnings season will wind down later this week, and it has shown that, according to Credit Suisse, this was the worst earnings season in more than two decades when not counting recessionary periods.
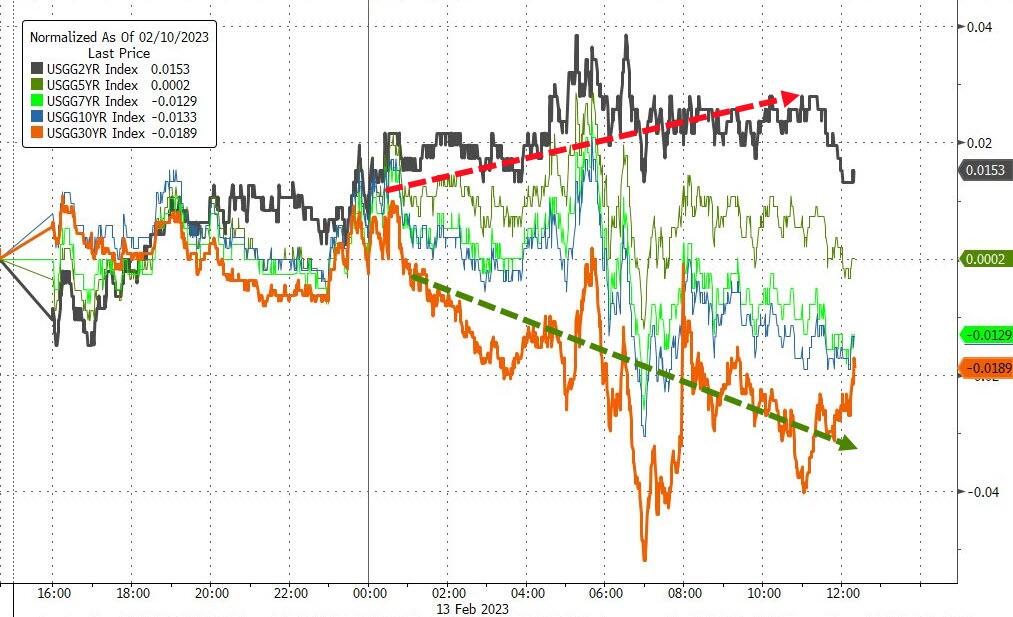
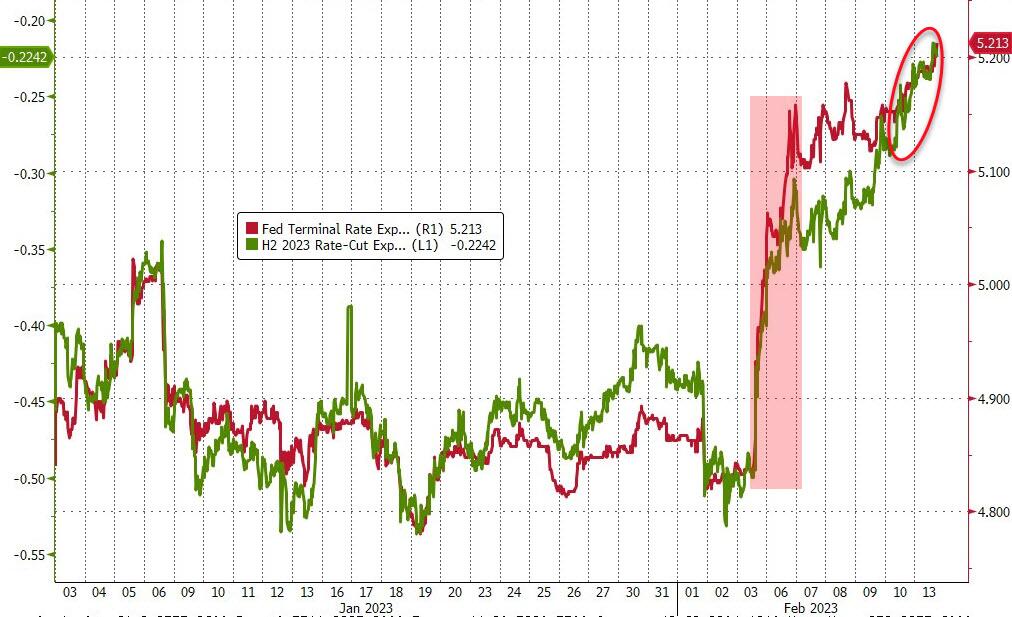
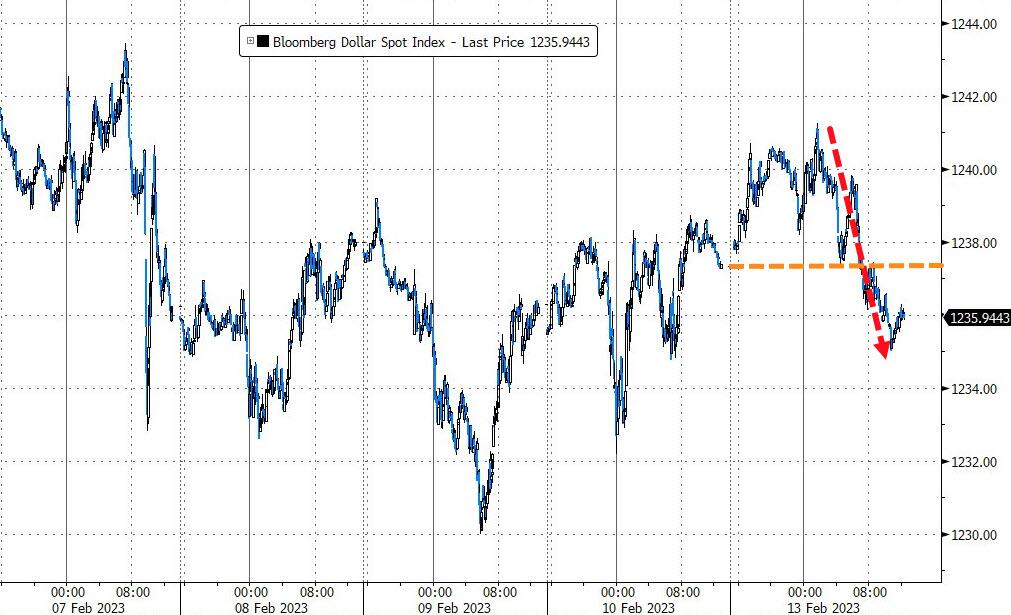
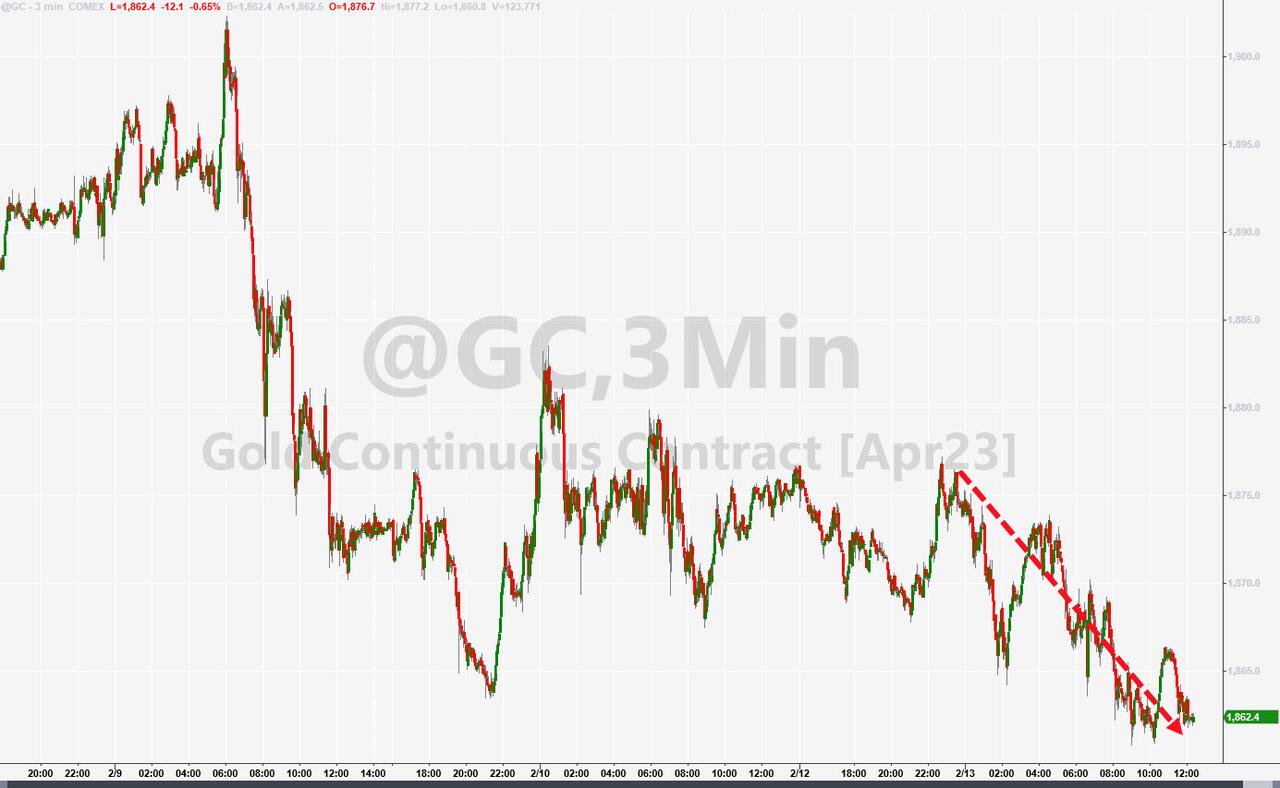
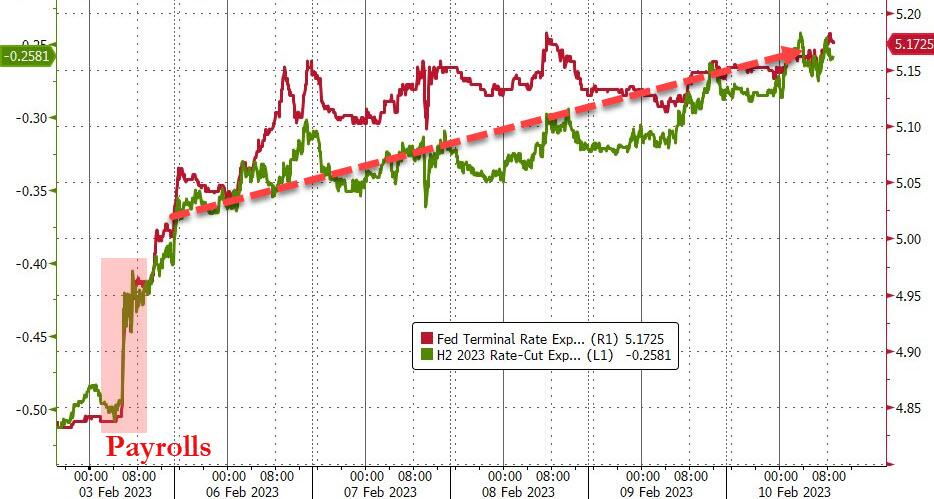
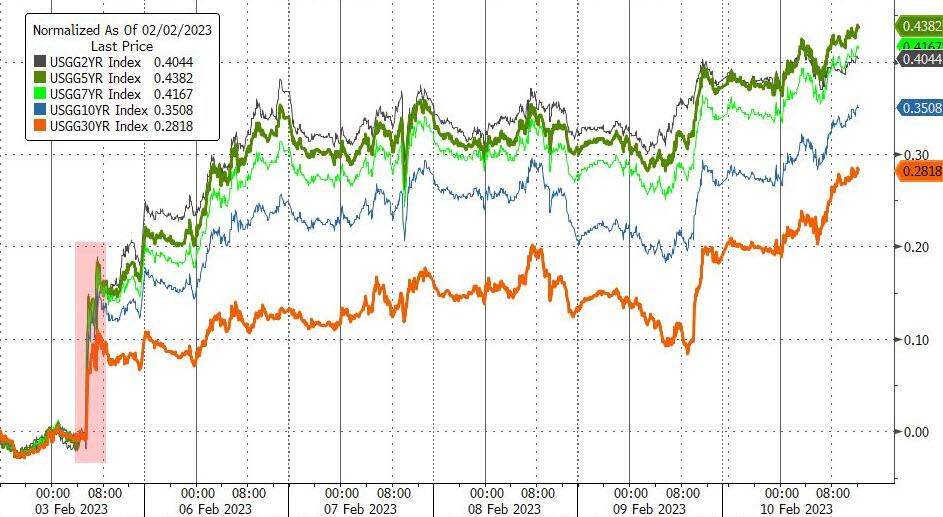
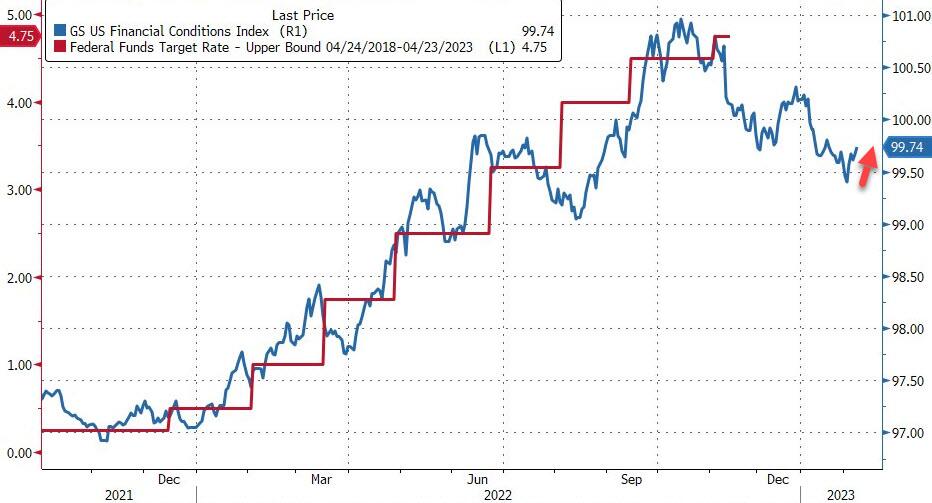
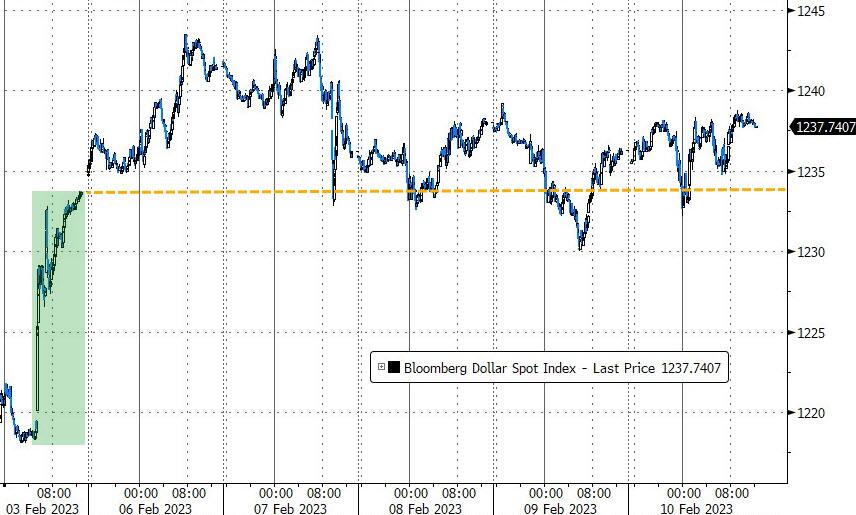
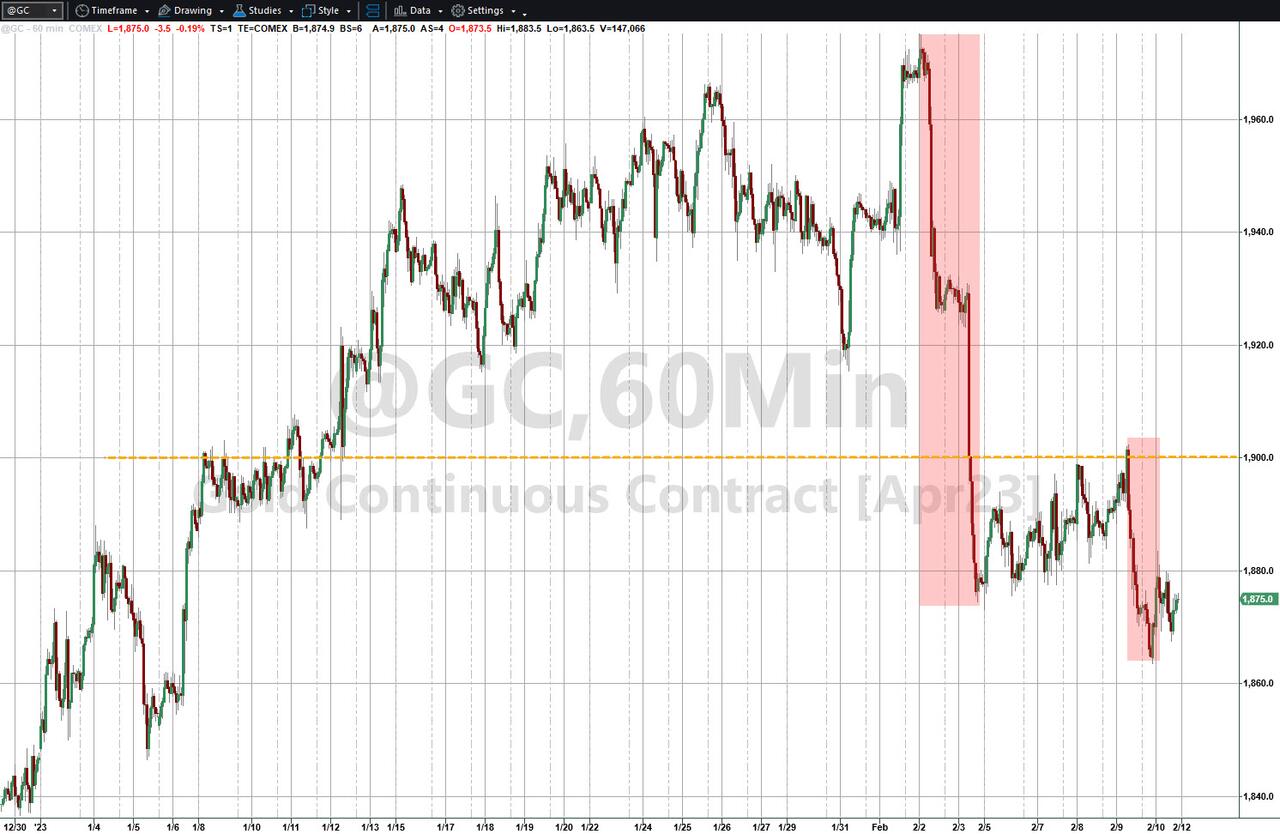
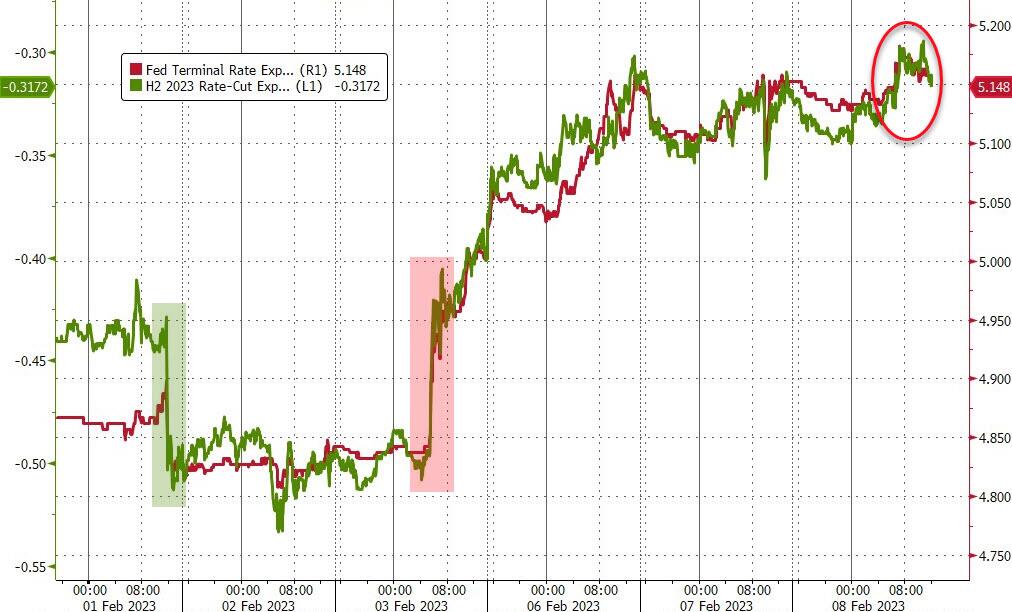
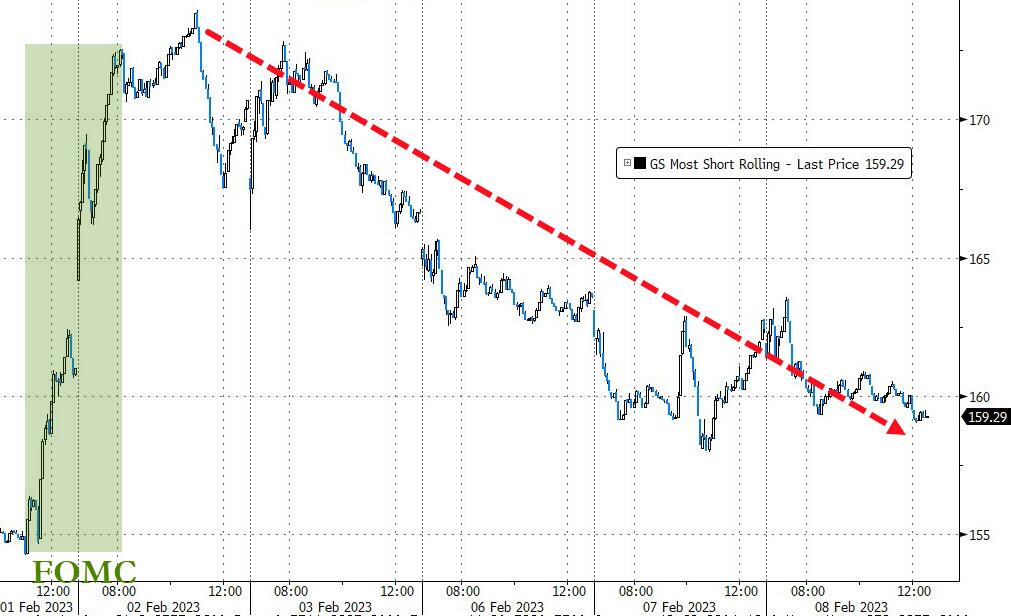
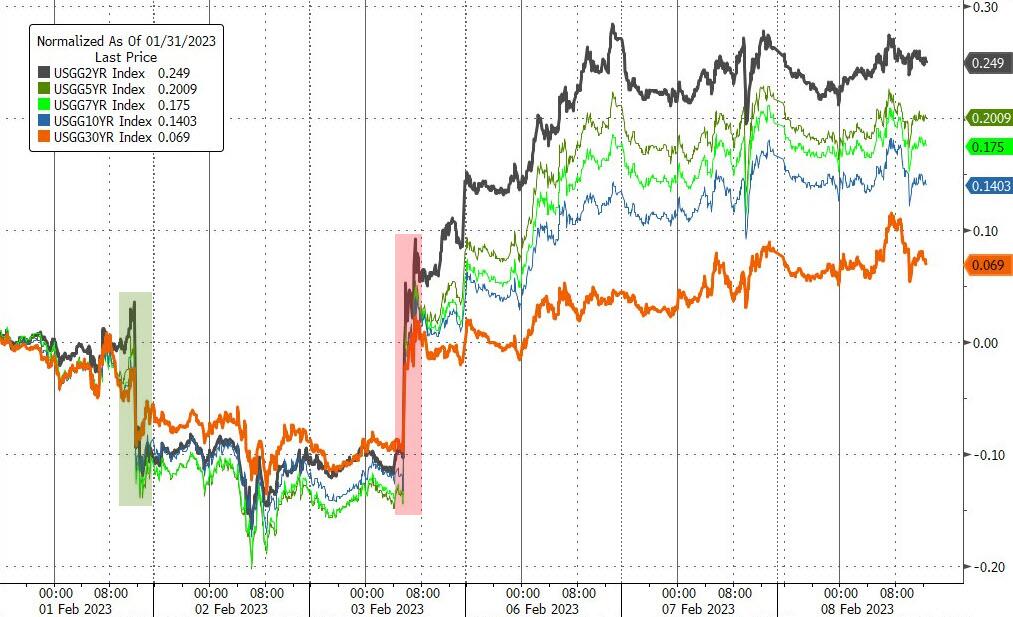
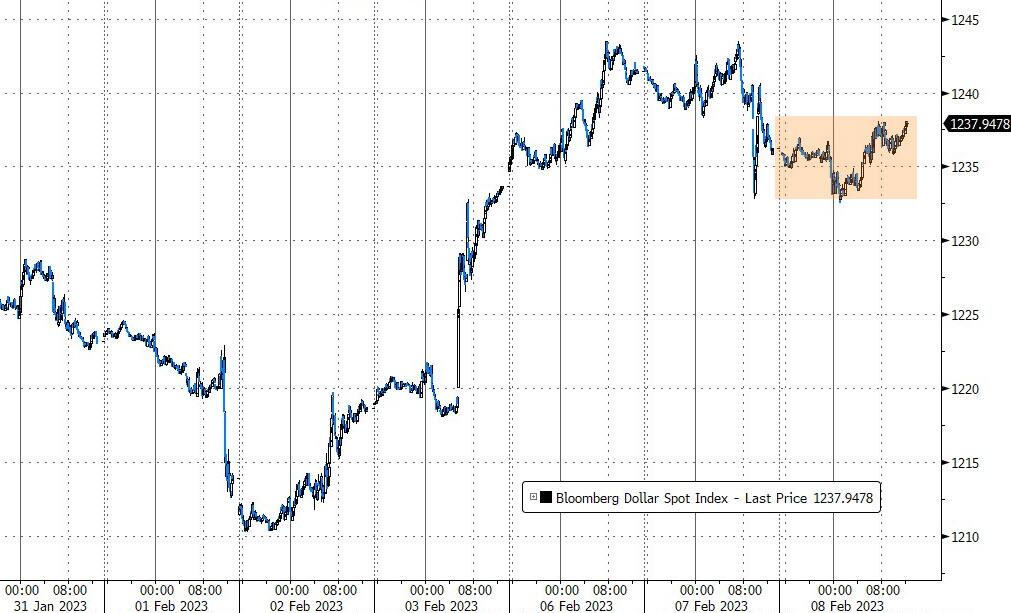
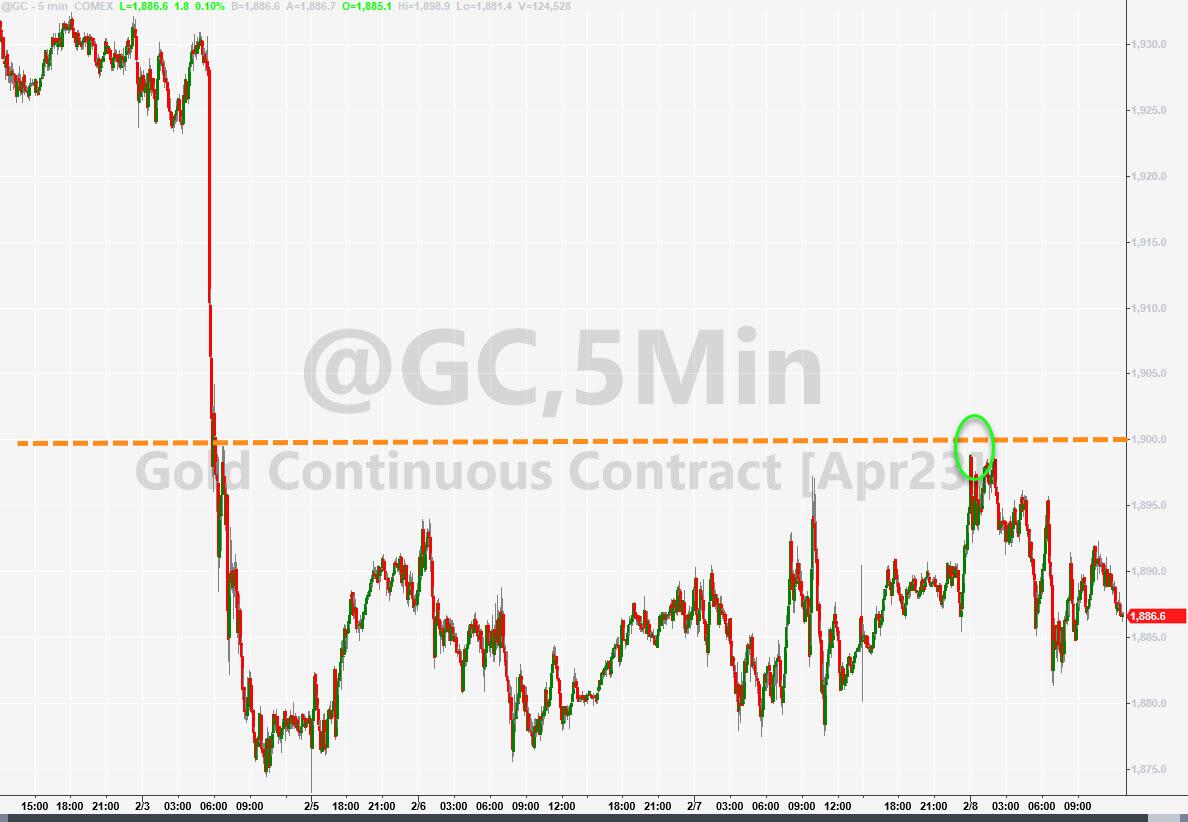
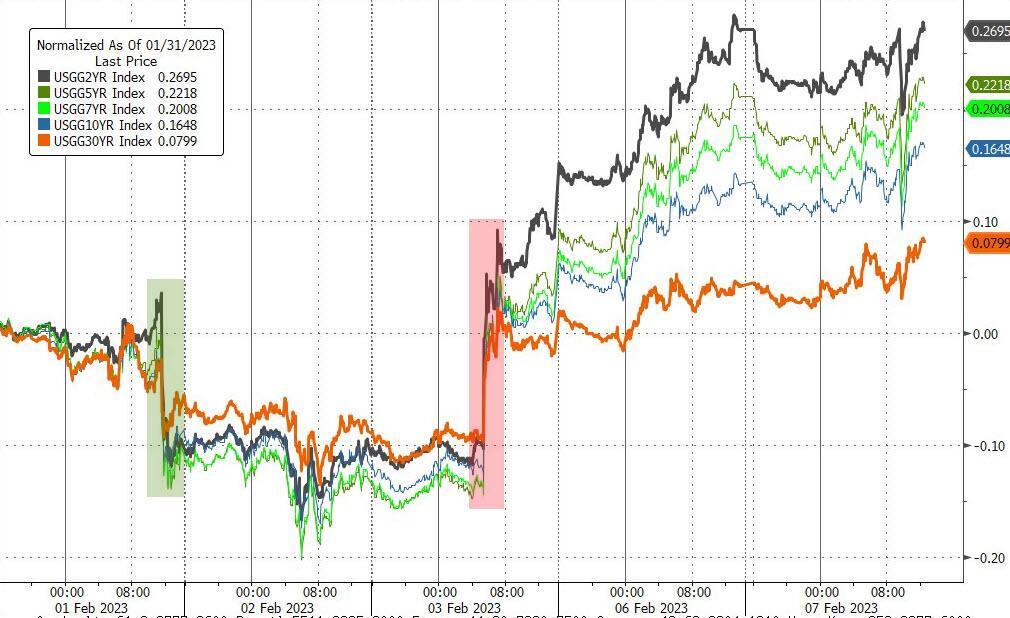
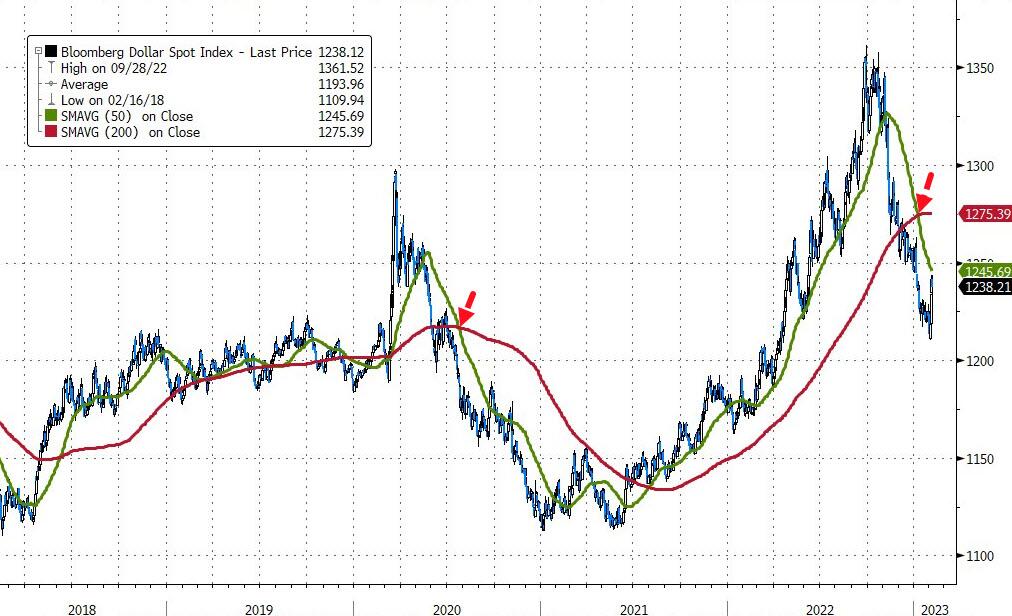
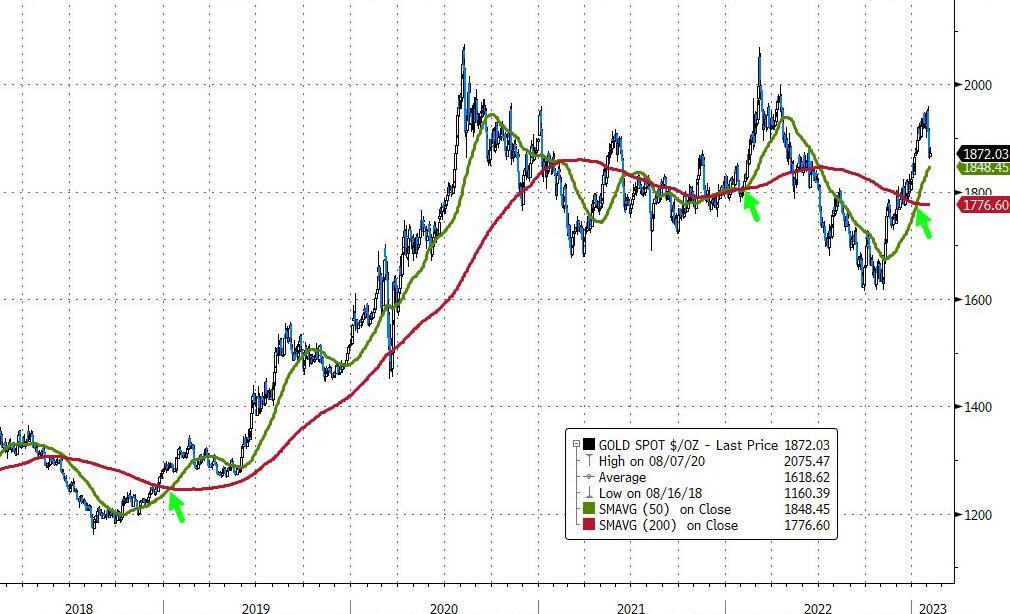
Bond yields were mixed, but terminal rate expectations continued to rise, and financial conditions have started to tighten recently, as ZeroHedge noted. The US Dollar pumped and dumped, but it was not enough to keep Gold in the green, so the precious metal slipped.
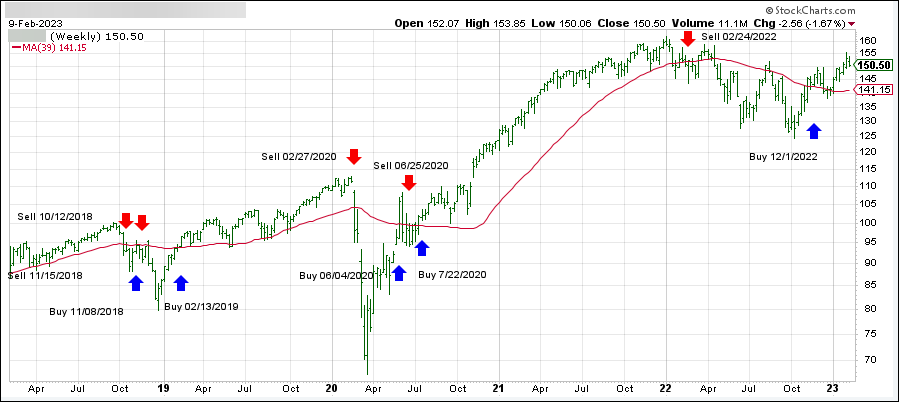
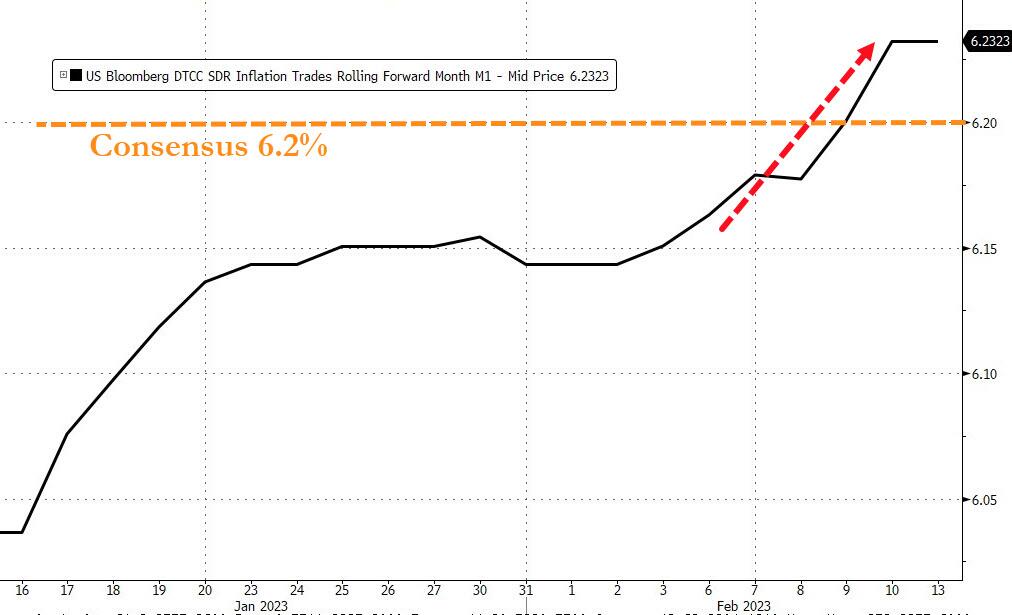
Since everything gets charted these days, the consensus CPI forecast of 6.2% may very well be too conservative, if this forecast is spot on. Should recent history repeat itself, we should see a pullback tomorrow.
Read More
