
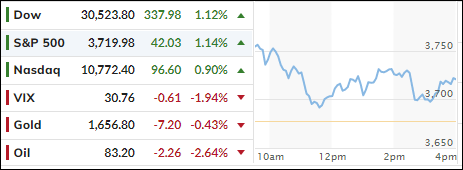
- Moving the markets
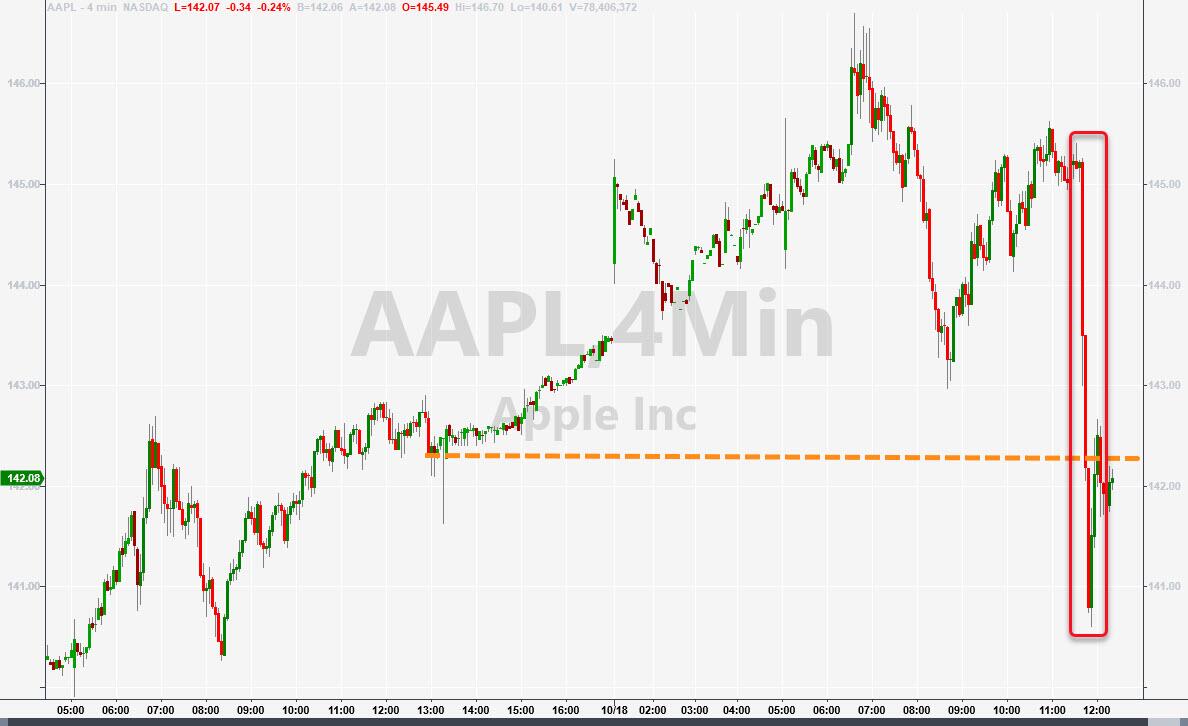
Despite an early 500-point jump in the Dow, supported by strong earnings reports (Goldman Sachs, Lockheed Martin), volatility set in with the major indexes tumbling off their lofty levels. The cause was Apple reporting that it will be cutting iPhone 14 production less than 2 weeks after its debut.
Added ZeroHedge:
The news that there is just not enough demand for the trinkets and beads of the world’s largest company makes one wonder if the consumer is really as strong as the talking heads would like everyone to believe.
Uncertainty reigned and trading was choppy, as many investors seem to lack conviction that this rally has legs. According to my count, we have seen 5 occurrences when, after a rebound, the indexes dumped to make lower lows each time, which is a hallmark of bear market behavior.
This SPY chart demonstrates what the bulls had to put up with in 2022:
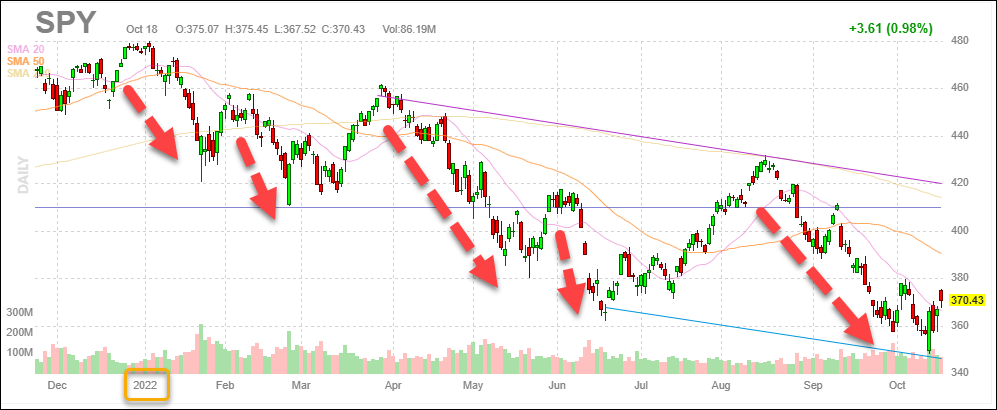
Will this current rebound be different?
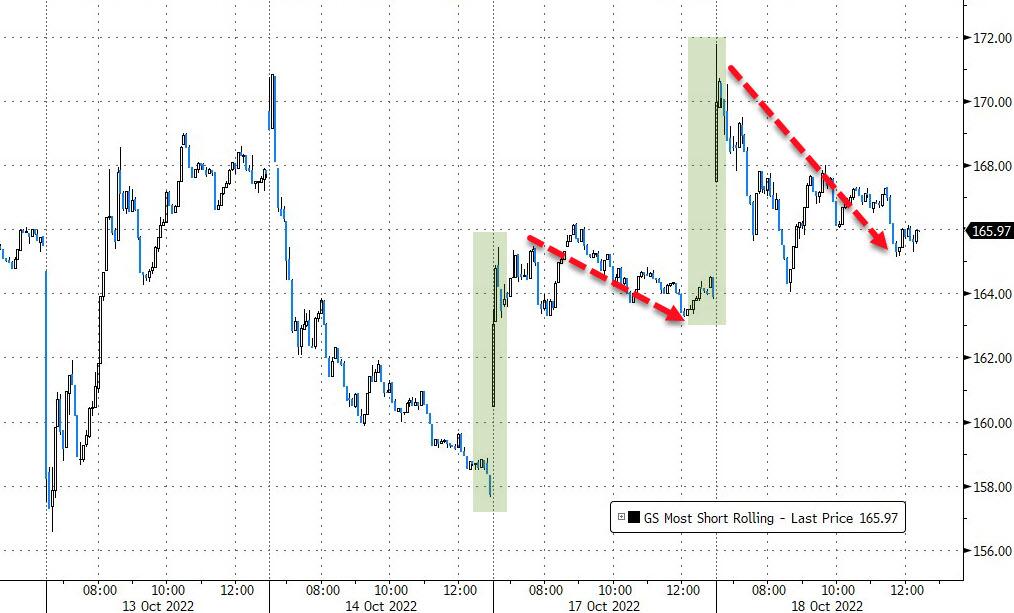
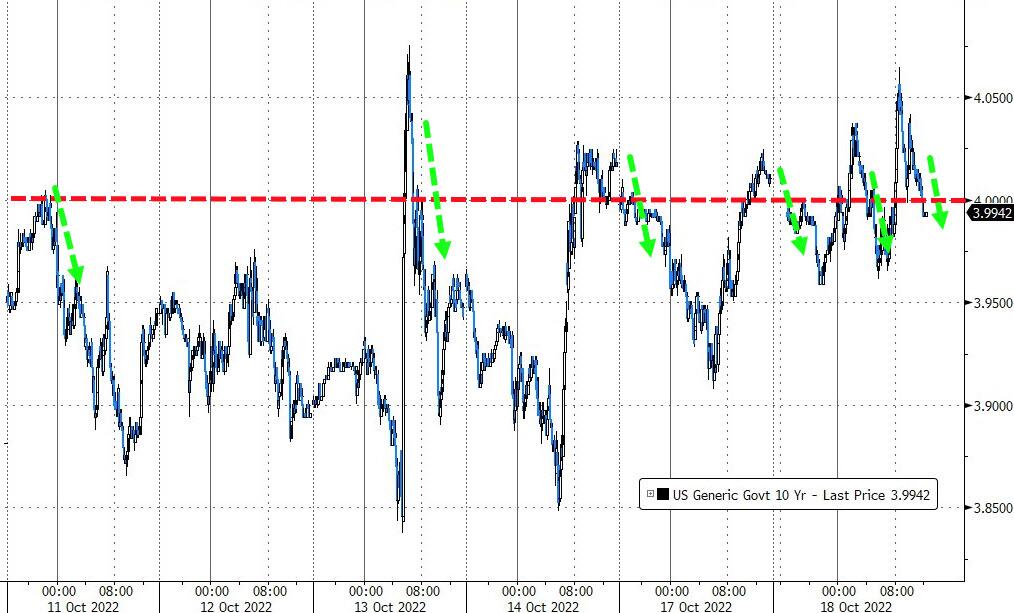
Today, another short squeeze helped the bullish cause with the major indexes closing in the green. Bond yields chopped around and ended slightly lower with the 10-year losing its 4% level by closing at 3.99%.
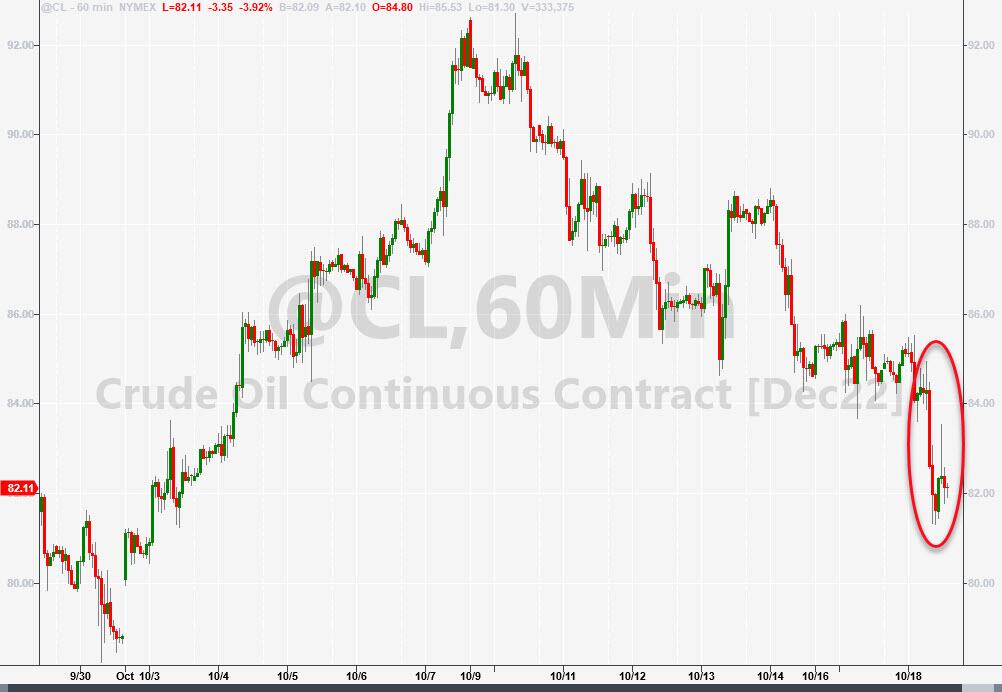
Gold retreated a tad, but Crude Oil stumbled and is threatening to break the $80 barrier to the downside. With the current administration’s plan to announce more SPR releases to lower the price of gasoline at the pump, and a weakening economy, we could see the black gold take a dump into $70s.
2. ETFs in the Spotlight
In case you missed the announcement and description of this section, you can read it here again.
It features some of the 10 broadly diversified domestic and sector ETFs from my HighVolume list as posted every Saturday. Furthermore, they are screened for the lowest MaxDD% number meaning they have been showing better resistance to temporary sell offs than all others over the past year.
The below table simply demonstrates the magnitude with which these ETFs are fluctuating above or below their respective individual trend lines (%+/-M/A). A break below, represented by a negative number, shows weakness, while a break above, represented by a positive percentage, shows strength.
For hundreds of ETF choices, be sure to reference Thursday’s StatSheet.
For this closed-out domestic “Buy” cycle (2/24/2022), here’s how some of our candidates have fared. Keep in mind that our Domestic Trend Tracking Index (TTI) signaled a “Sell” on that date, which overrode the existing “Buys” shown for SPY and IYM:
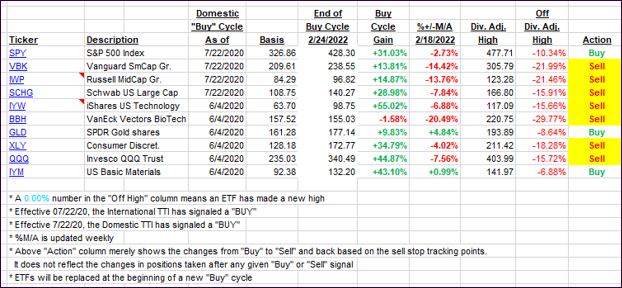
Click image to enlarge.
Again, the %+/-M/A column above shows the position of the various ETFs in relation to their respective long-term trend lines, while the trailing sell stops are being tracked in the “Off High” column. The “Action” column will signal a “Sell” once the -12% point has been taken out in the “Off High” column, which has replaced the prior -8% to -10% limits.
3. Trend Tracking Indexes (TTIs)
Our TTIs made more progress but are nowhere near of signaling a new “Buy” for equities.
This is how we closed 10/18/2022:
Domestic TTI: -8.01% below its M/A (prior close -9.36%)—Sell signal effective 02/24/2022.
International TTI: -11.79% below its M/A (prior close -12.64%)—Sell signal effective 03/08/2022.
Disclosure: I am obliged to inform you that I, as well as my advisory clients, own some of the ETFs listed in the above table. Furthermore, they do not represent a specific investment recommendation for you, they merely show which ETFs from the universe I track are falling within the specified guidelines.
All linked charts above are courtesy of Bloomberg via ZeroHedge.
Contact Ulli