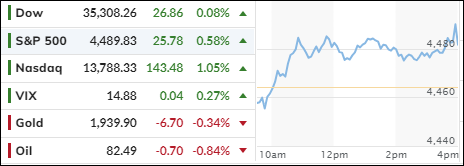
Markets Await Clarity From Retail Reports Amid Choppy August Trading

Ulli Market Commentary Contact

[Chart courtesy of MarketWatch.com]

  1. Moving the markets

The U.S. consumer is in the spotlight this week, as three retail giants – Home Depot, Target, and Walmart – are set to report their earnings. We’ll also get a glimpse of how shoppers spent their money in July, with the retail sales data coming out on Tuesday morning.

These reports come on the heels of last week’s inflation data, which showed that prices are still rising faster than the Fed’s 2% target but not as fast as they did in the previous months. Is this a sign that inflation is cooling off, or just a temporary blip?

Two weeks ago, I asked ‘What’s next?’ for the markets, and the answer was ‘not much’. The markets have been choppy and directionless, waiting for more clarity on the economy and the Fed’s next move. That hasn’t changed much this month.

But in the dog days of August, when investors have more time to daydream, some are starting to wonder if there are other scenarios besides a Goldilocks soft landing. Maybe the news flow isn’t as rosy as it was earlier this summer. Maybe there are some risks lurking in the shadows?

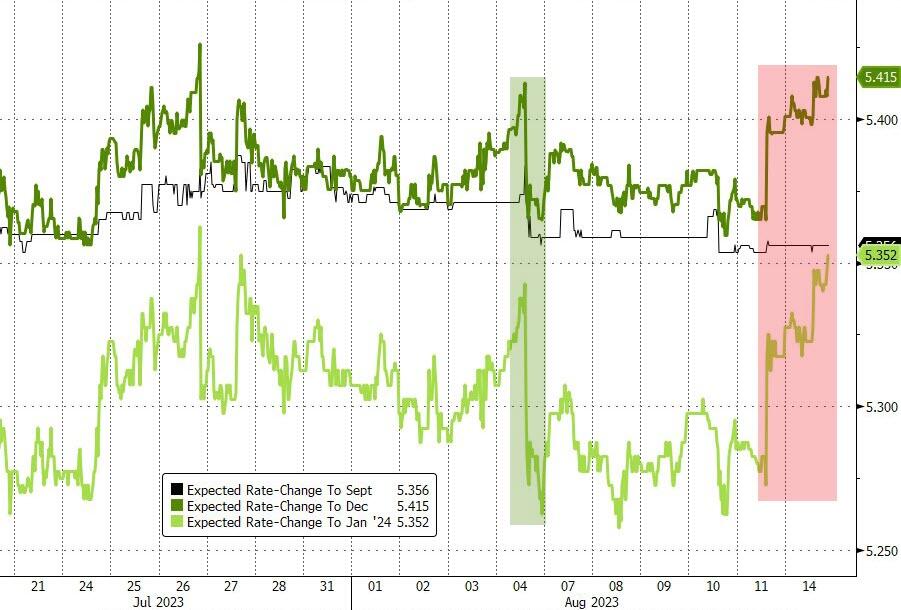
Some traders are trying to brush off the August slump by saying that it’s healthy and normal, and that it doesn’t mean the end of the bull market. They seem to forget that the rally was based on a lot of speculation and hope that the Fed would cut interest rates soon. But today’s data showed that rate hike expectations are rising, not falling, as this chart shows.

The chart shows the implied probability of a rate hike by December 2023 based on fed funds futures contracts.

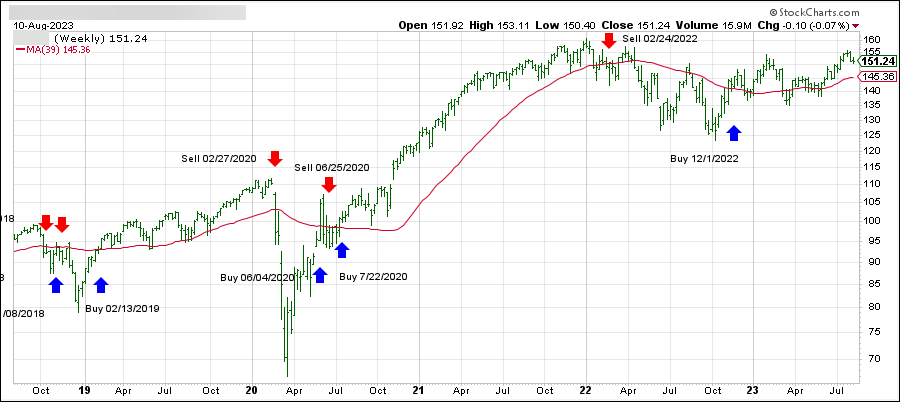
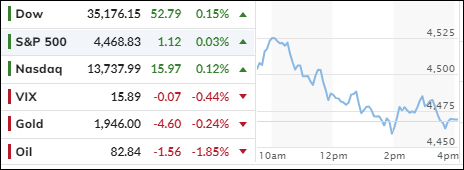
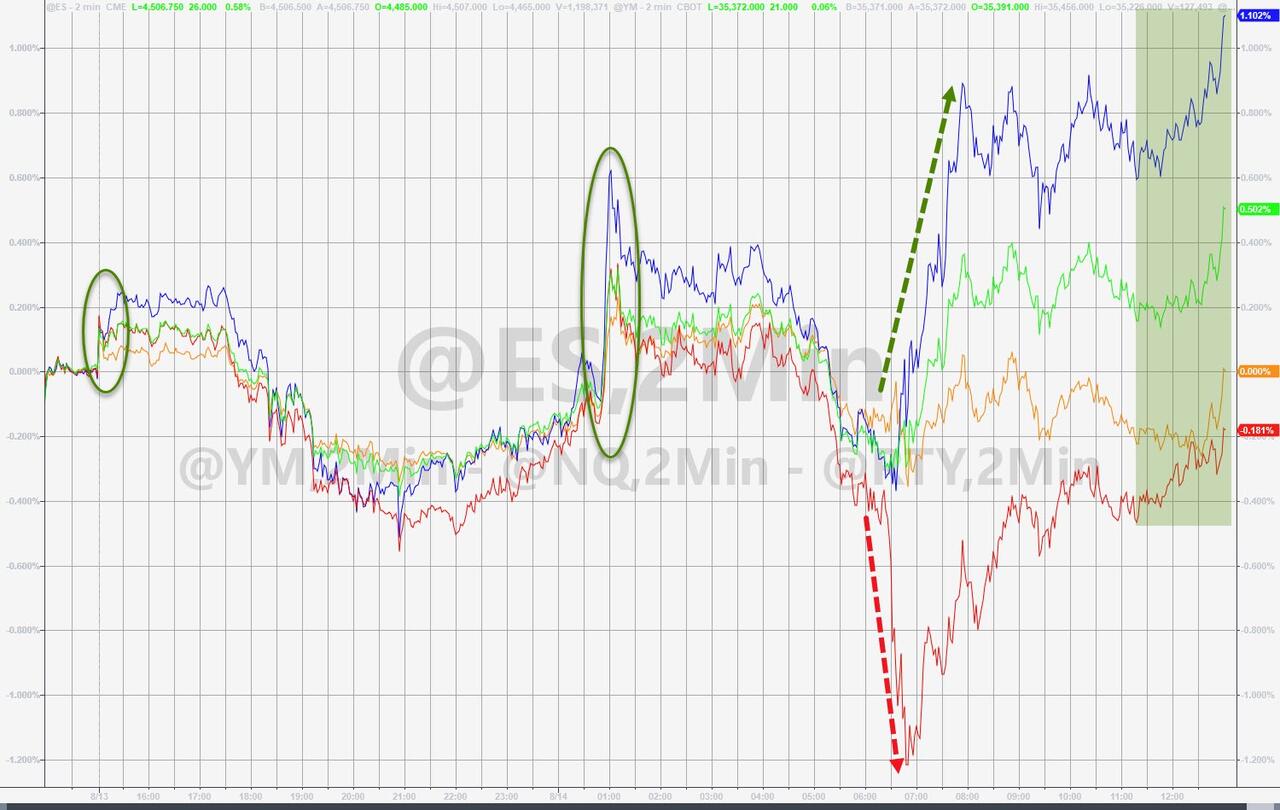
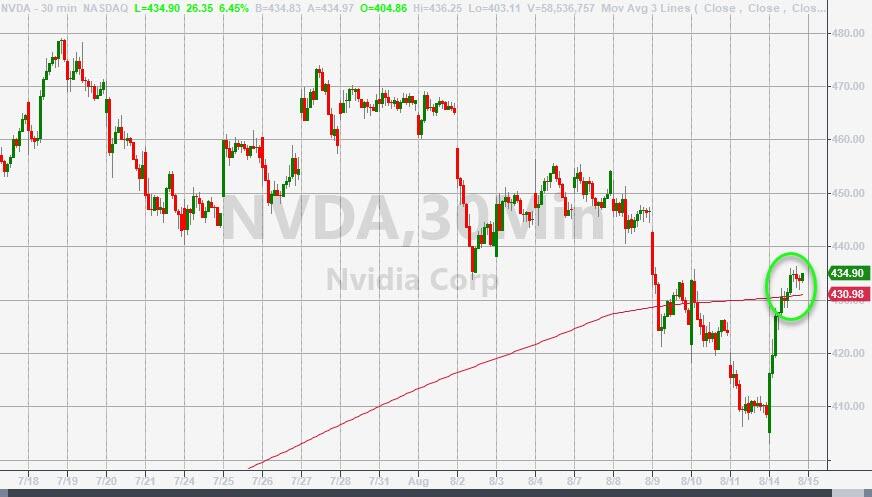
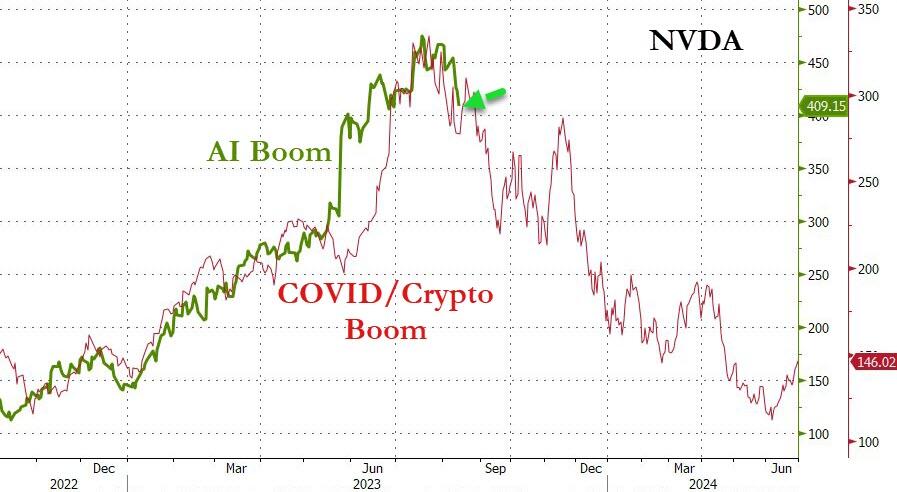
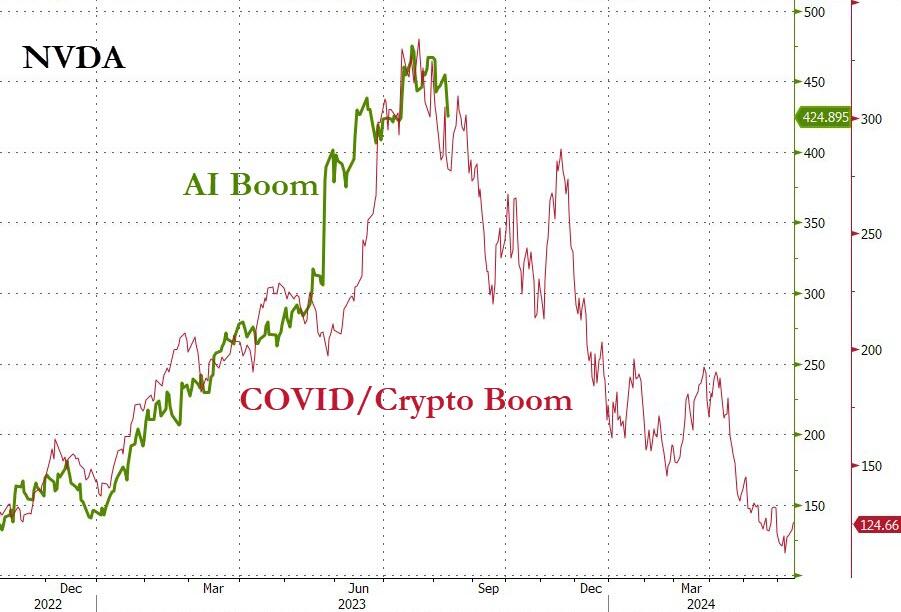
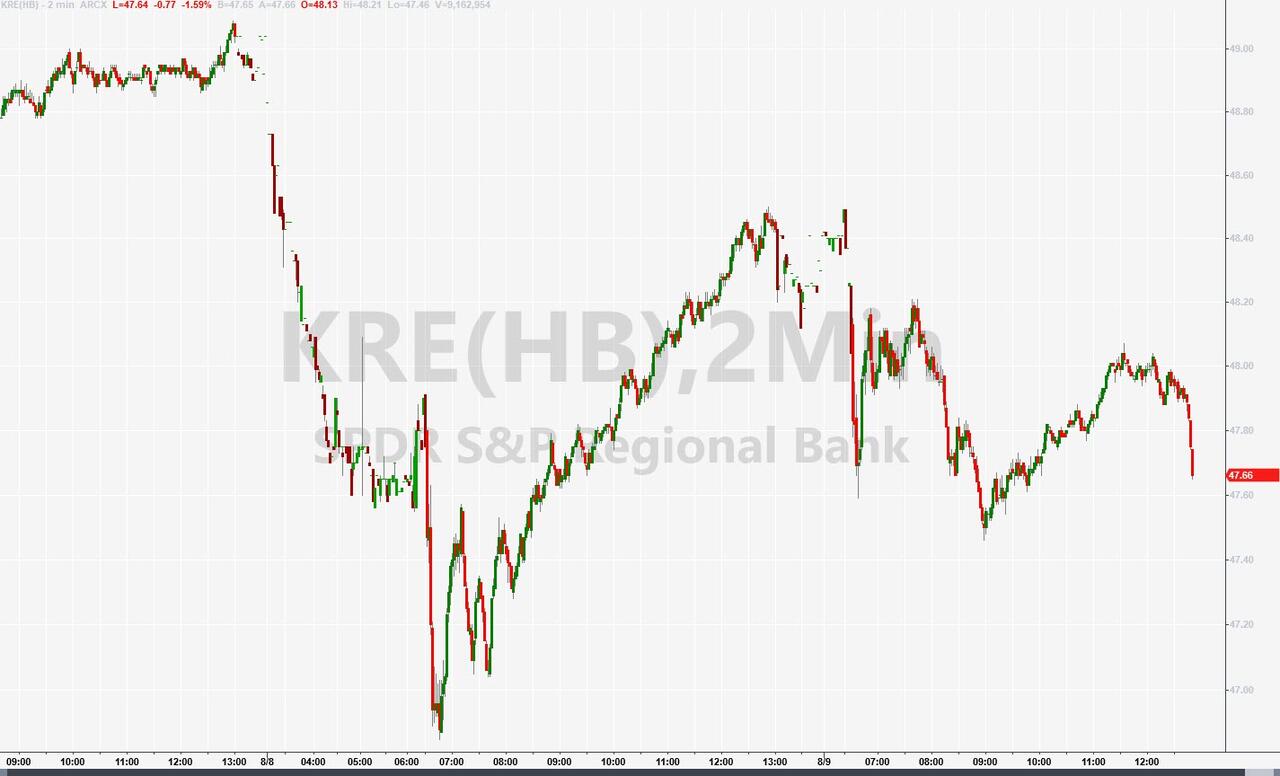
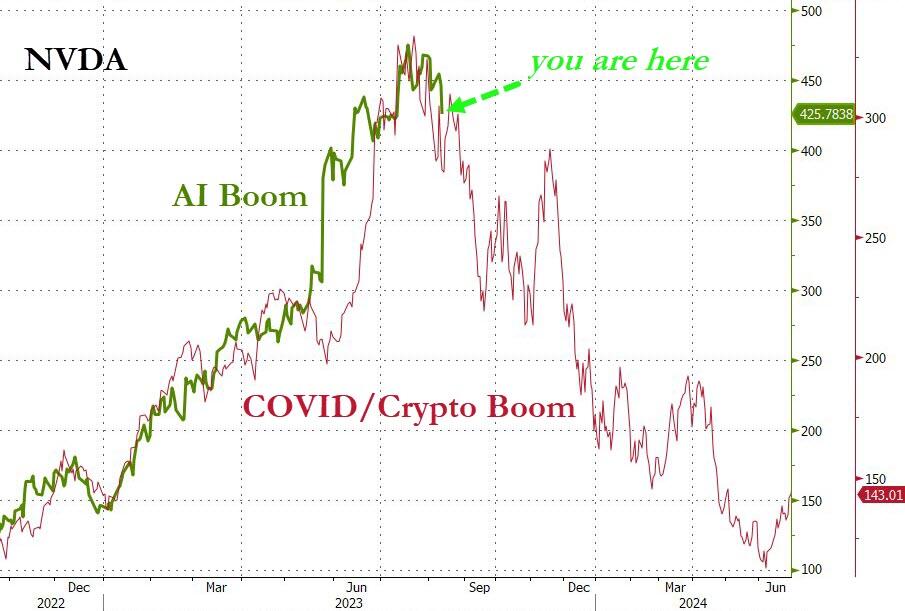
The major indexes managed to close slightly higher today, but the small caps were left behind. NVDA had a rough start, but recovered and crossed its 50-day moving average, just in time for the AI boom downturn. Look at this chart.

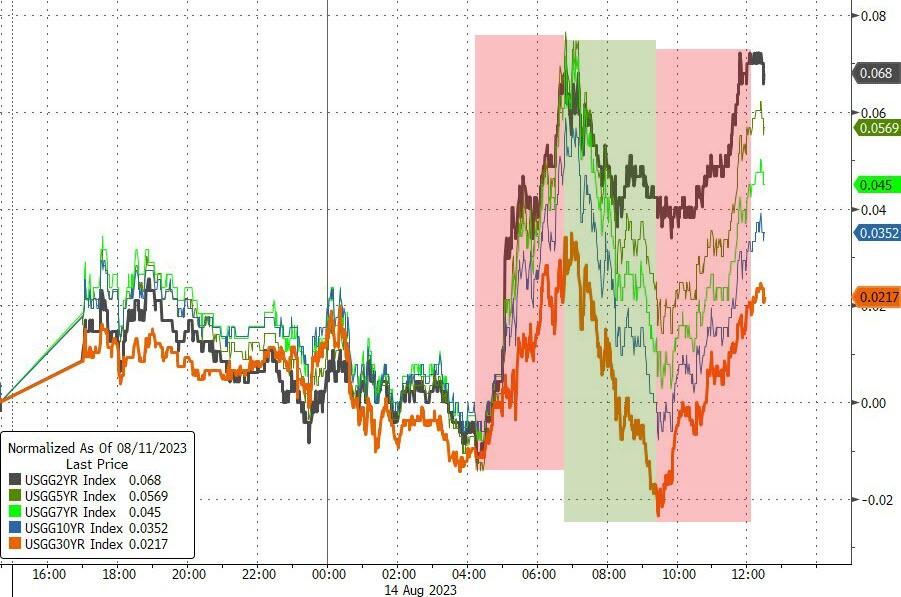
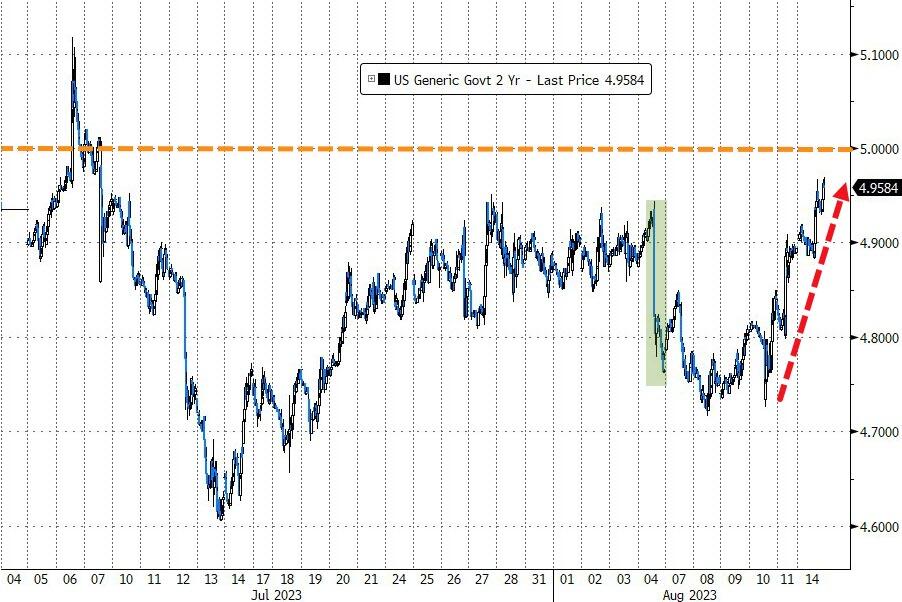
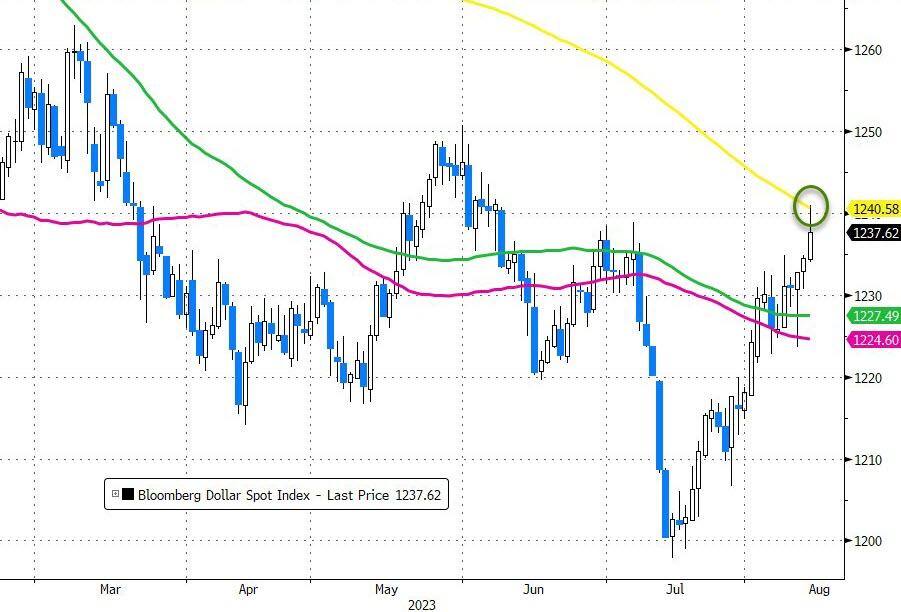
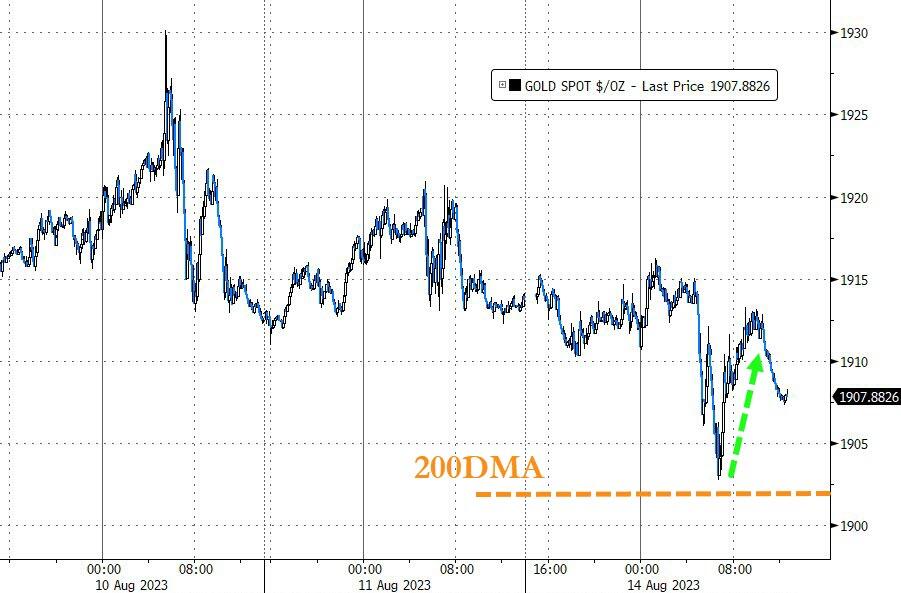
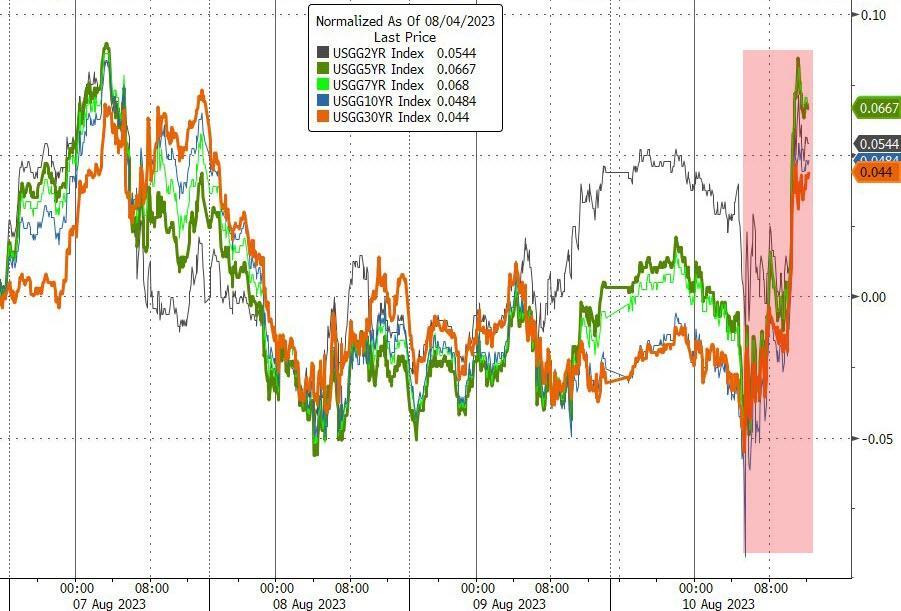
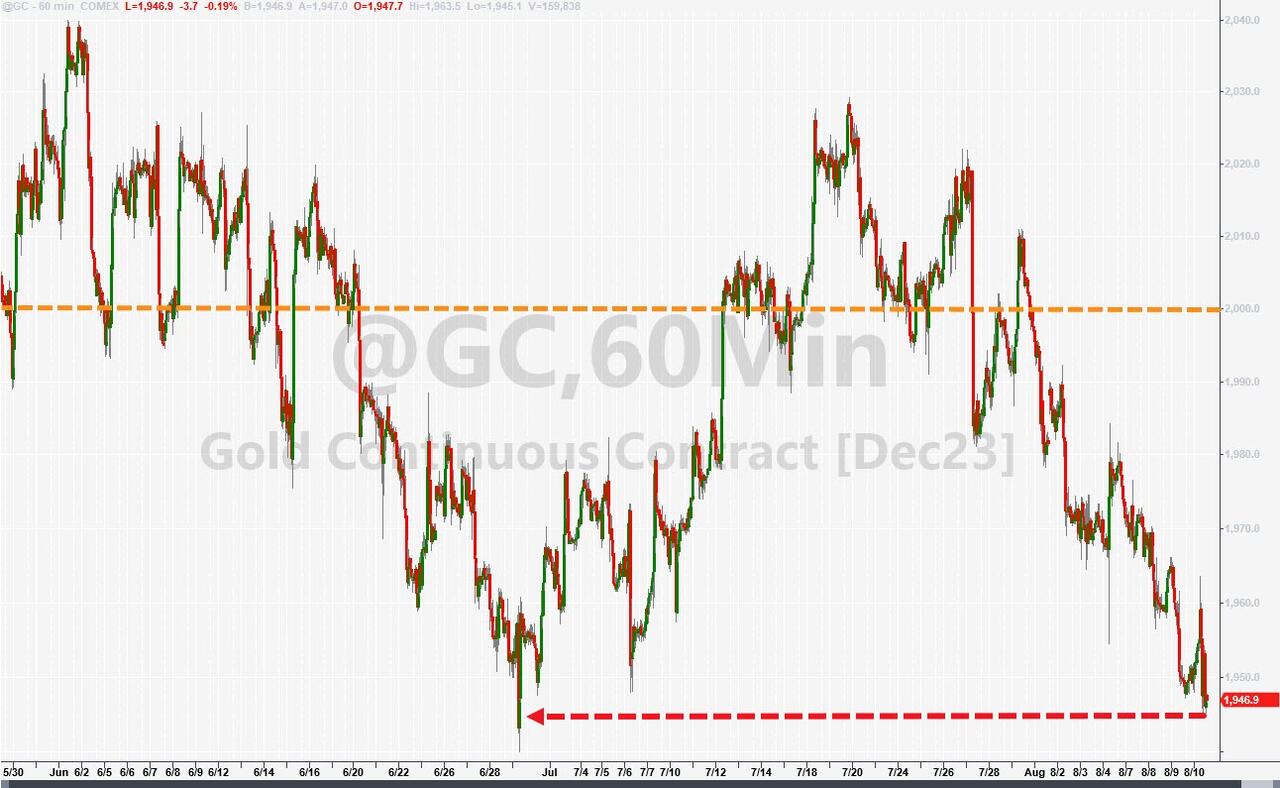
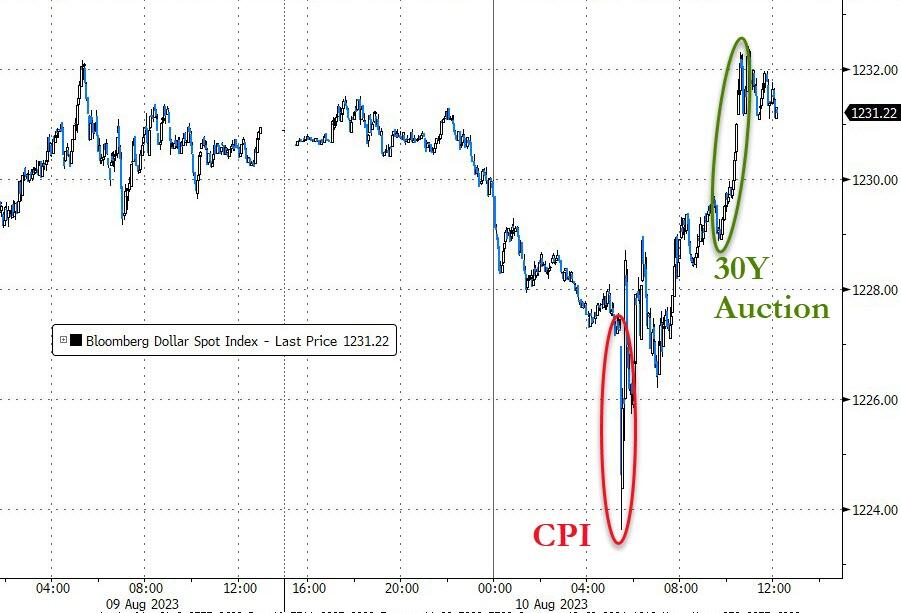
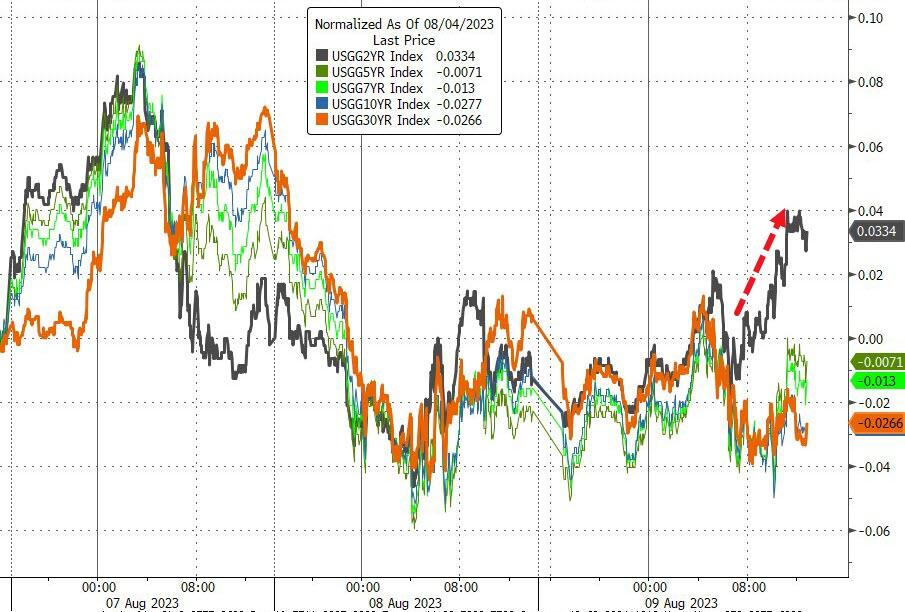
Bond yields had a wild ride today, ending higher after a dip in the middle of the day. The 2-year yield is on track to hit 5% soon. The dollar gained some strength, which weighed on gold prices. Oil prices were aimless and ended lower.

The big event of the week will be Home Depot’s earnings report on Thursday. The company has more impact on the S&P than Walmart and Target combined. But it has missed expectations for two quarters in a row.

Will it break the streak, or break the market?

Read More
ETFs On The Cutline – Updated Through 08/11/2023

Ulli ETFs on the Cutline Contact

Do you want to know which ETFs are hot and which ones are not? Then you need my High-Volume ETF Cutline report. It tells you how close or far each of the 311 ETFs I follow is from its long-term trend line (39-week SMA). These are the ETFs that trade more than $5 million a day, so they are not some obscure funds that nobody cares about.

The report is split into two parts: The winners that are above their trend line (%M/A), and the losers that are below it. The yellow line is the line of shame that separates them. You can see how many ETFs are in each group and how they have changed since the last report (192 vs. 199 current).

Take a peek:

The HV ETF Master Cutline Report

If you are confused by some of the terms we use, don’t panic. I have a helpful Glossary of Terms for you.

If you want to learn more about the Cutline method and how it can make you rich (or at least less poor), read my original post here.

ETF Tracker Newsletter For August 11, 2023

Ulli ETF Tracker Contact

ETF Tracker StatSheet          

You can view the latest version here.

STOCKS AND BANK RESERVES DIVERGE: A CROCODILE TRAP?

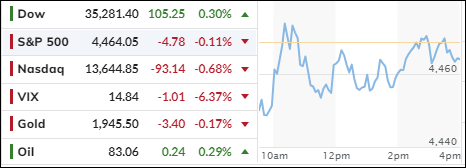
[Chart courtesy of MarketWatch.com]

  1. Moving the markets

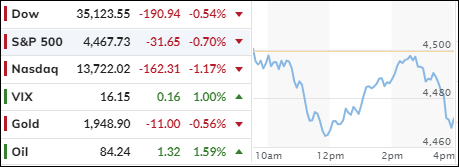
The stock market was stuck in a rut today, as the Nasdaq and S&P 500 closed slightly lower after some ups and downs. The Nasdaq has been on a losing streak for two weeks in a row, the first time since December, as investors got nervous about the AI bubble bursting.

The Dow managed to end the week higher, but the S&P 500 and the Small Caps joined the tech giants in the red. Traders were on their toes as they faced mixed signals from corporate earnings and inflation data.

Yesterday’s CPI report was a grab bag of surprises, which initially boosted the market, but later fizzled out as the gains were erased. Today’s PPI report added more confusion, as wholesale prices rose 0.3% from last month, beating the expected 0.2% increase.

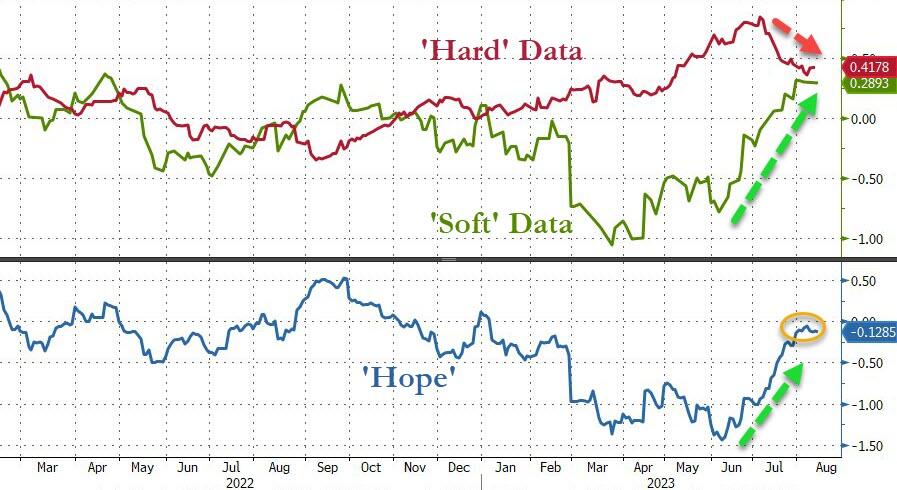
This week’s wobbly moves are part of a recent rough patch for the stock market, which had a strong performance in the first half of the year. The three major indexes are all below where they started August, as disappointing hard data and optimistic soft data clashed.

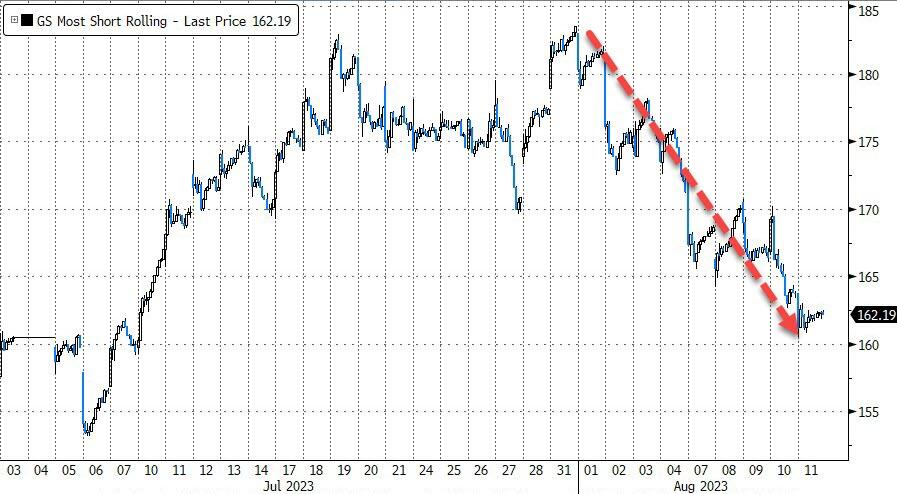
The most shorted stocks took a dive for the second week in a row, as all attempts to squeeze them were met with resistance. The most-shorted basket has been down for eight out of the last nine days.

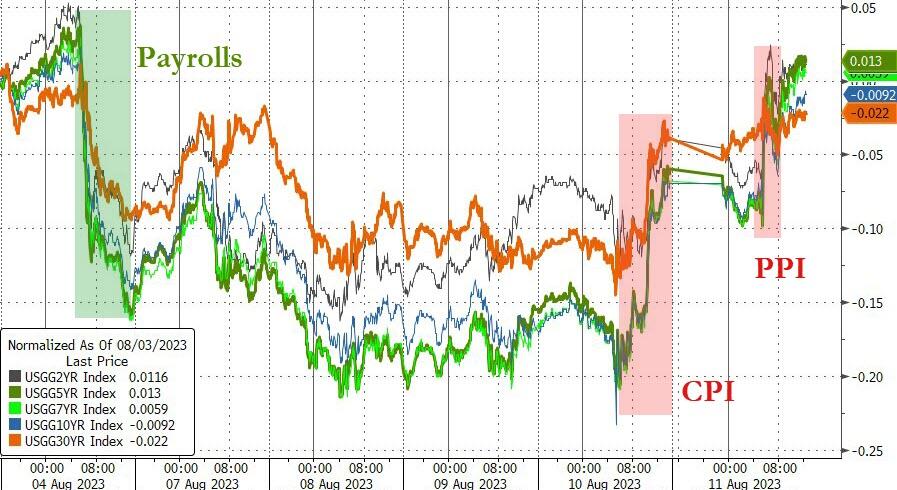
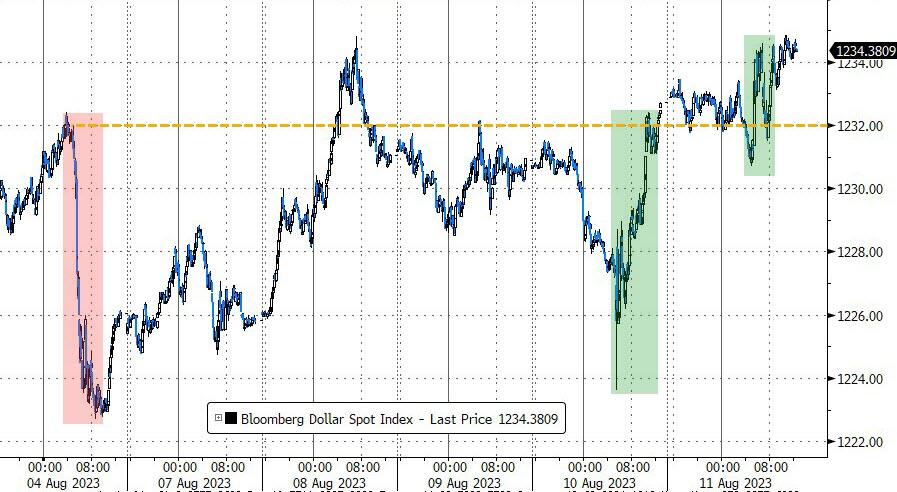
Bond yields swung wildly and ended up where they began last Friday. The dollar gained strength, which kept gold from shining.

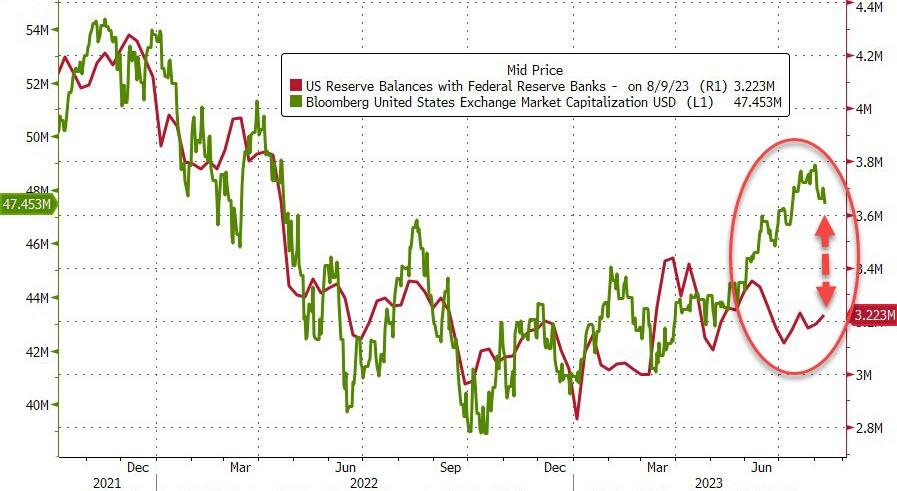
Another divergence emerged as stocks went their own way compared to bank reserves, as this chart shows. It makes me wonder when the jaws of this crocodile will snap.

Read More
Weekly StatSheet For The ETF Tracker Newsletter – Updated Through 08/10/2023

Ulli ETF StatSheet Contact

ETF Data updated through Thursday, August 10, 2023

How to use this StatSheet:

  1. Out of the 1,800+ ETFs out there, I only pick the ones that trade over $5 million per day (HV ETFs), so you don’t get stuck with a lemon that nobody wants to buy or sell.
  1. Trend Tracking Indexes (TTIs)

These are the main indicators that tell you when to buy or sell Domestic and International ETFs (section 1 and 2). They do that by comparing their position to their long-term M/A (Moving Average). If they cross above, and stay there, it’s a green light to buy. If they fall below, and keep going, it’s a red light to sell. And to make sure you don’t lose your shirt if things go south, I also use a 12% trailing stop loss on all positions in these categories.

  1. All other investment areas don’t have a TTI and should be traded based on the position of each ETF relative to its own trend line (%M/A). That’s why I call them “Selective Buy.” In other words, if an ETF goes above its own trend line, you can buy it. But don’t forget to use a trailing sell stop of 12%, or less if you’re feeling nervous.

If some of these words sound like Greek to you, please check out the Glossary of Terms and new subscriber information in section 9.

  1. DOMESTIC EQUITY ETFs: BUY— since 12/01/2022

Click on chart to enlarge

This is our main compass, the Domestic Trend Tracking Index (TTI-green line in the above chart). It has now broken above its long-term trend line (red) by +4.17% and remains in “Buy” mode.

Read More
Inflation Report Triggers Market Whiplash

Ulli Market Commentary Contact

[Chart courtesy of MarketWatch.com]

  1. Moving the markets

The latest consumer price index (CPI) report showed that inflation in July was lower than expected on a yearly basis, but still higher than the Fed’s comfort zone. The report also indicated that real average weekly earnings did not change last month, which could be seen as a positive sign for consumers.

However, the report also revealed some signs of persistent inflation. The core CPI, which excludes food and energy, rose 4.7% year-over-year, well above the Fed’s 2% target. And the headline inflation rate was still above 3%, the same as in June.

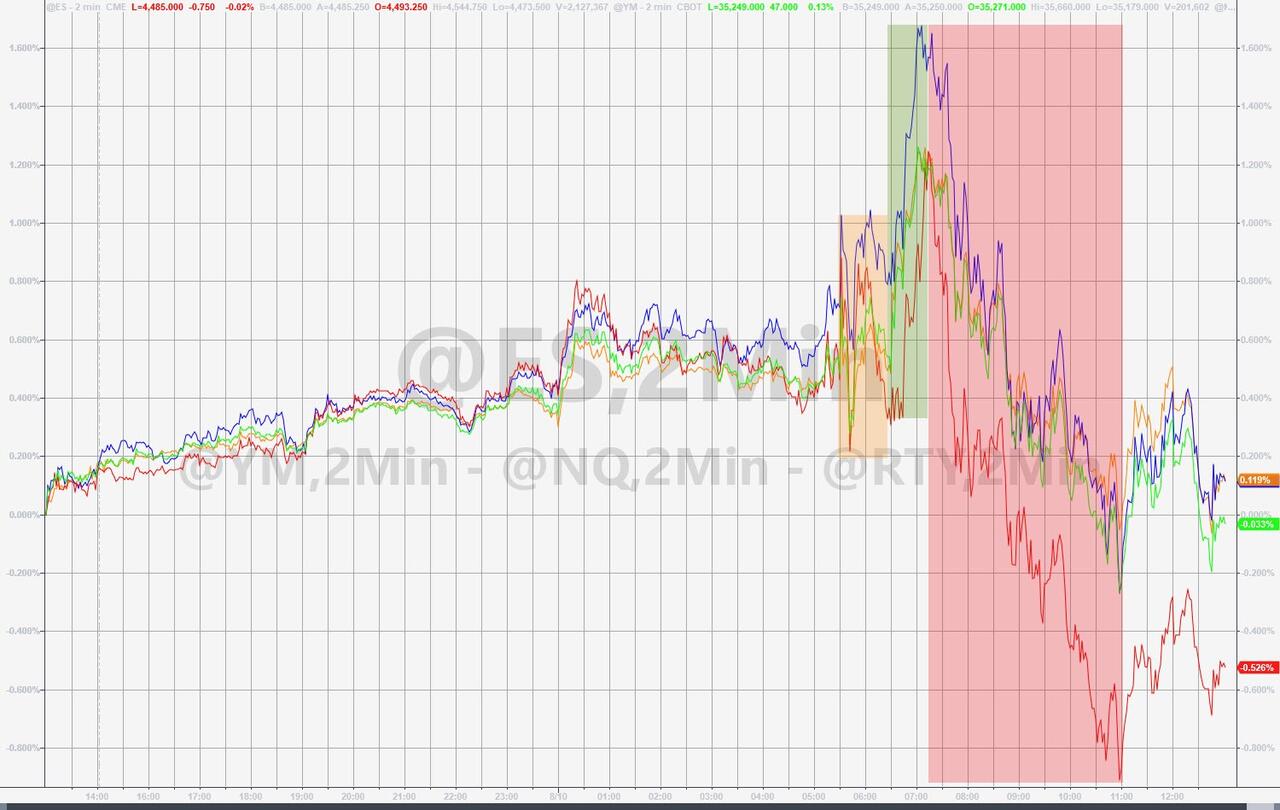
The market reaction was mixed and volatile. Initially, traders and algorithms focused on the lower-than-expected annual inflation rate and pushed the Dow up by more than 400 points. But later, they realized that the data might not be enough to convince the Fed to delay tapering its bond purchases, and the rally fizzled out. The major indexes gave up almost all early gains by the end of the day.

ZeroHedge summed it up best:

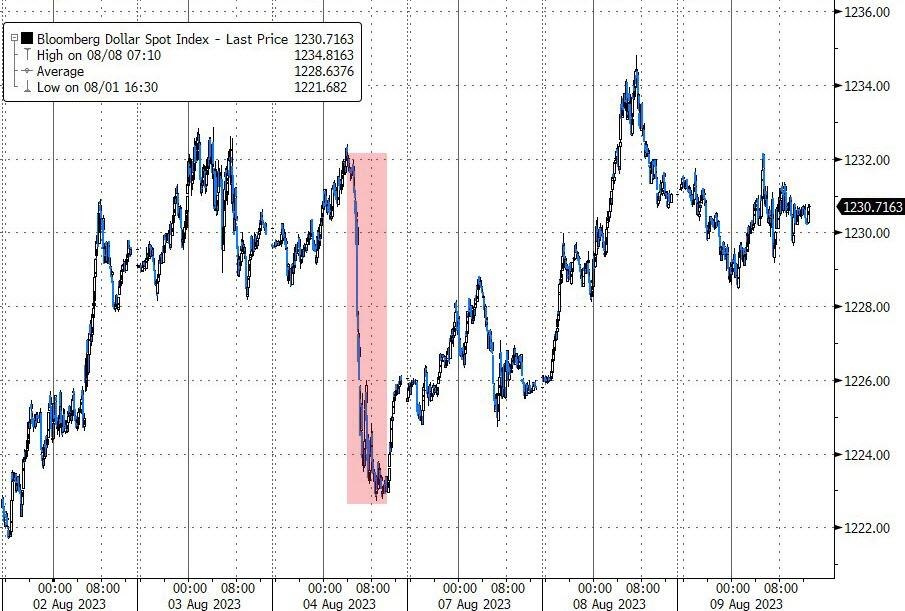
A quiet illiquid summer day which saw oil pump-and-dump, bond yields drop-and-pop, stocks spike-and-puke, gold jump-and-slump, and the dollar purge-and-surge.

It seems that nothing much changed in the big picture, but the AI boom reversal prediction is still on track.

Read More

Markets Fall As CPI Report Looms; NVDA Leads AI Bust

Ulli Market Commentary Contact

[Chart courtesy of MarketWatch.com]

  1. Moving the markets

The markets were nervous as they awaited the CPI report for July, which will be released tomorrow, and the PPI report for the same month, which will come out on Friday.

These reports will show how much prices have changed for consumers and producers, and they may influence the Fed’s decision on interest rates. The markets hoped that inflation would slow down enough to make the Fed stop raising rates, a wish that had fueled the 2023 rally.

But the markets also feared that inflation was still lurking around the corner, and that the official numbers might not capture the true picture. The markets wobbled and wavered, but ultimately the pessimists prevailed, and the major indexes ended lower.

Other factors also weighed on the markets, such as China’s deflationary pressures, Italy’s backpedaling on bank taxes, and doubts about the AI boom. But all eyes were on the looming CPI report, which could make or break the market’s mood.

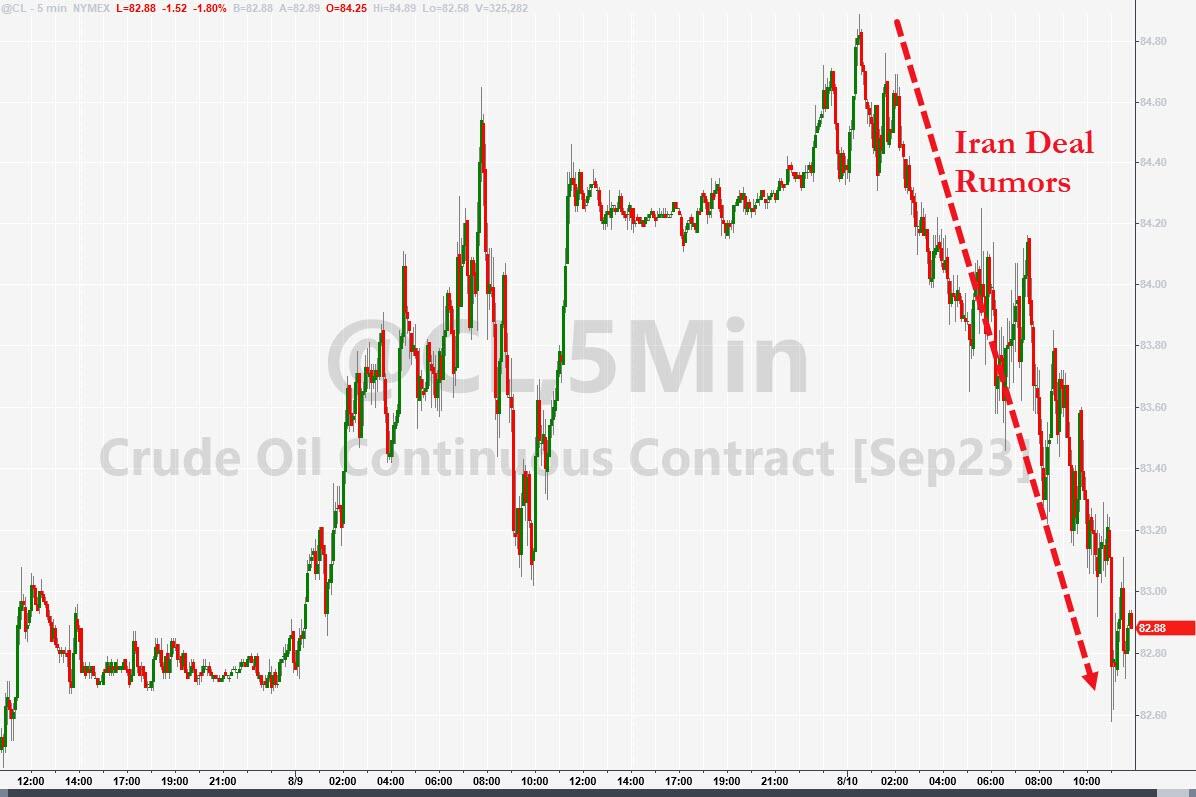
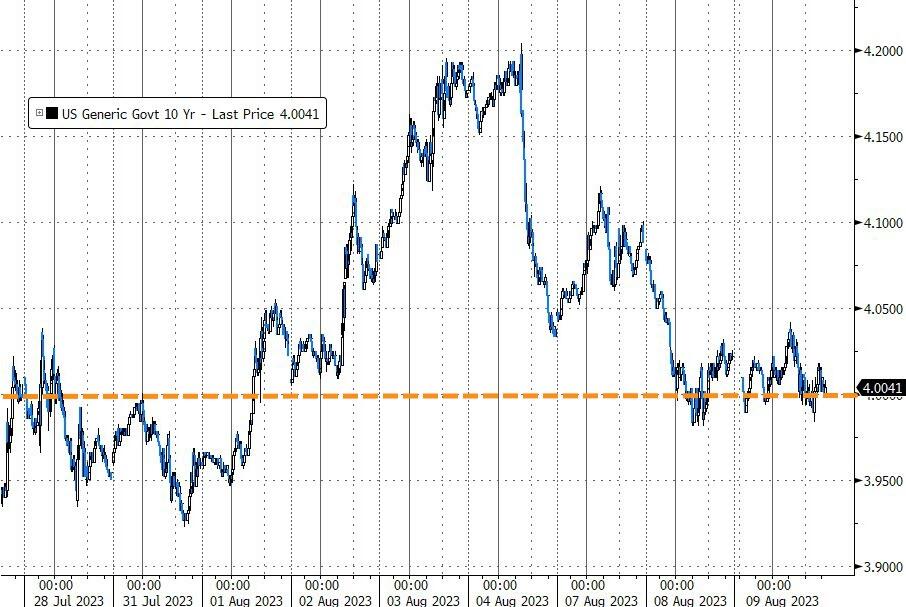
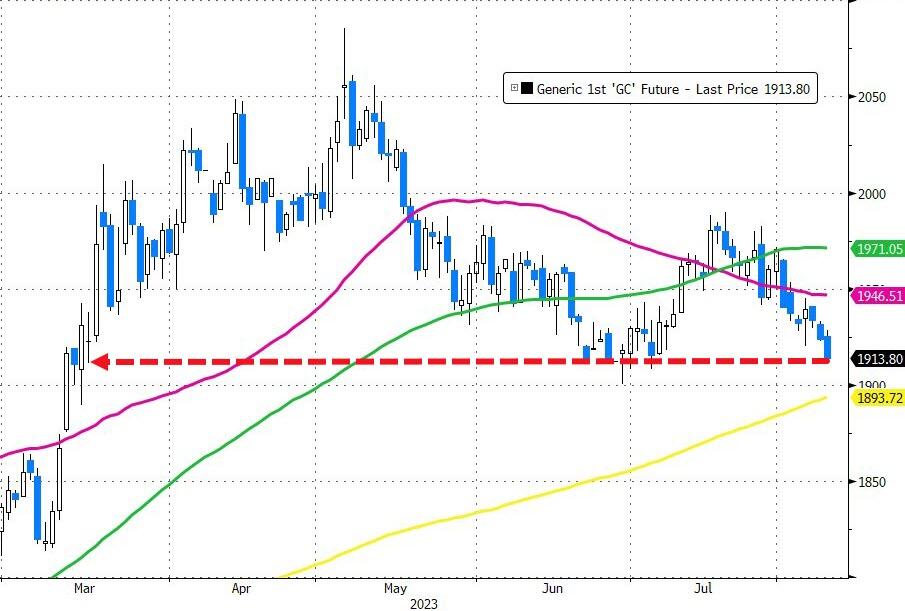
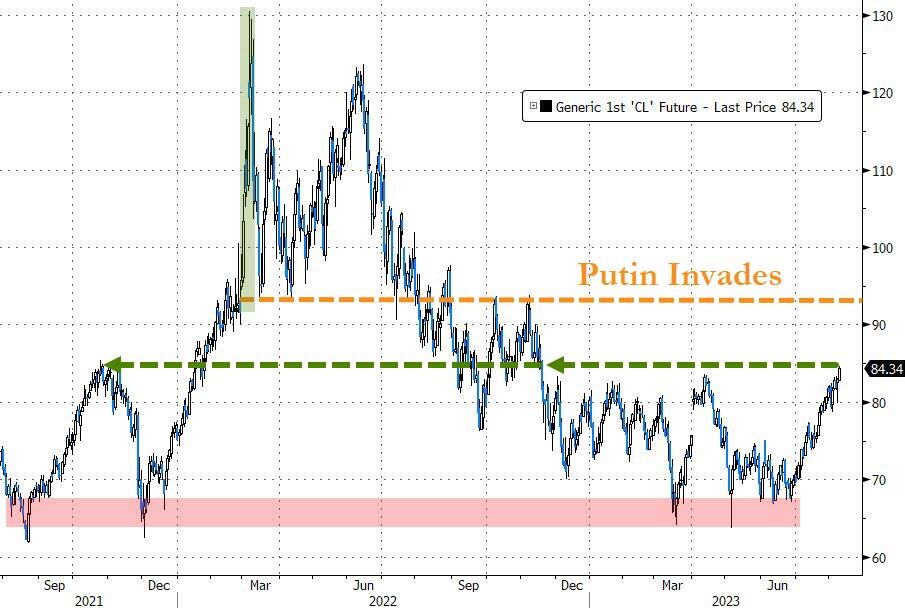
US banks suffered another day of losses, bond yields were mixed but the 10-year stayed above 4%, and the dollar was unchanged. Gold fell to its lowest level since March, while crude oil reached new highs for 2023, with WTI above $84 a barrel.

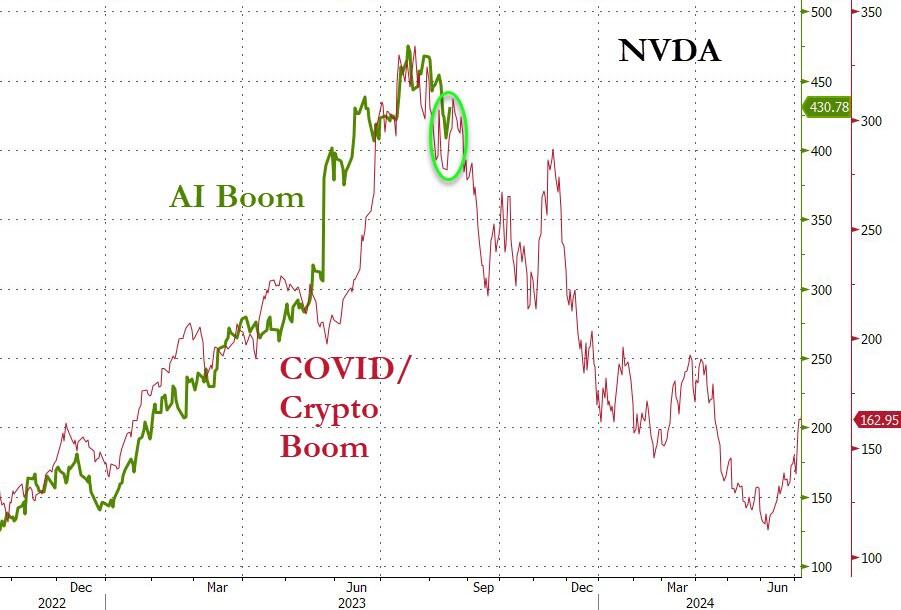
One of the most notable losers of the day was NVDA, the leading chipmaker for AI applications. NVDA dropped to its lowest point in a month, down 12% from its mid-July peak. This raised questions about whether the AI boom was losing steam, as this chart suggests.

Is history repeating itself?

Read More