
- Moving the markets
Today, it was Powell himself singing from the same hymn sheet that his mouthpieces have used for months, namely rates may need to go “higher for longer,” a theme I have pounded on ad nauseum.
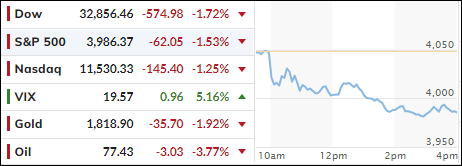
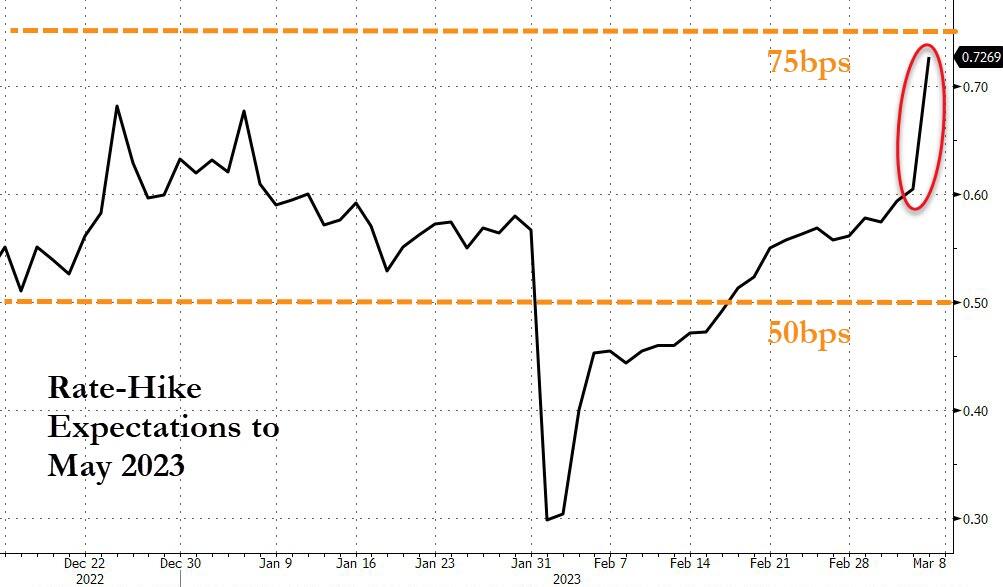
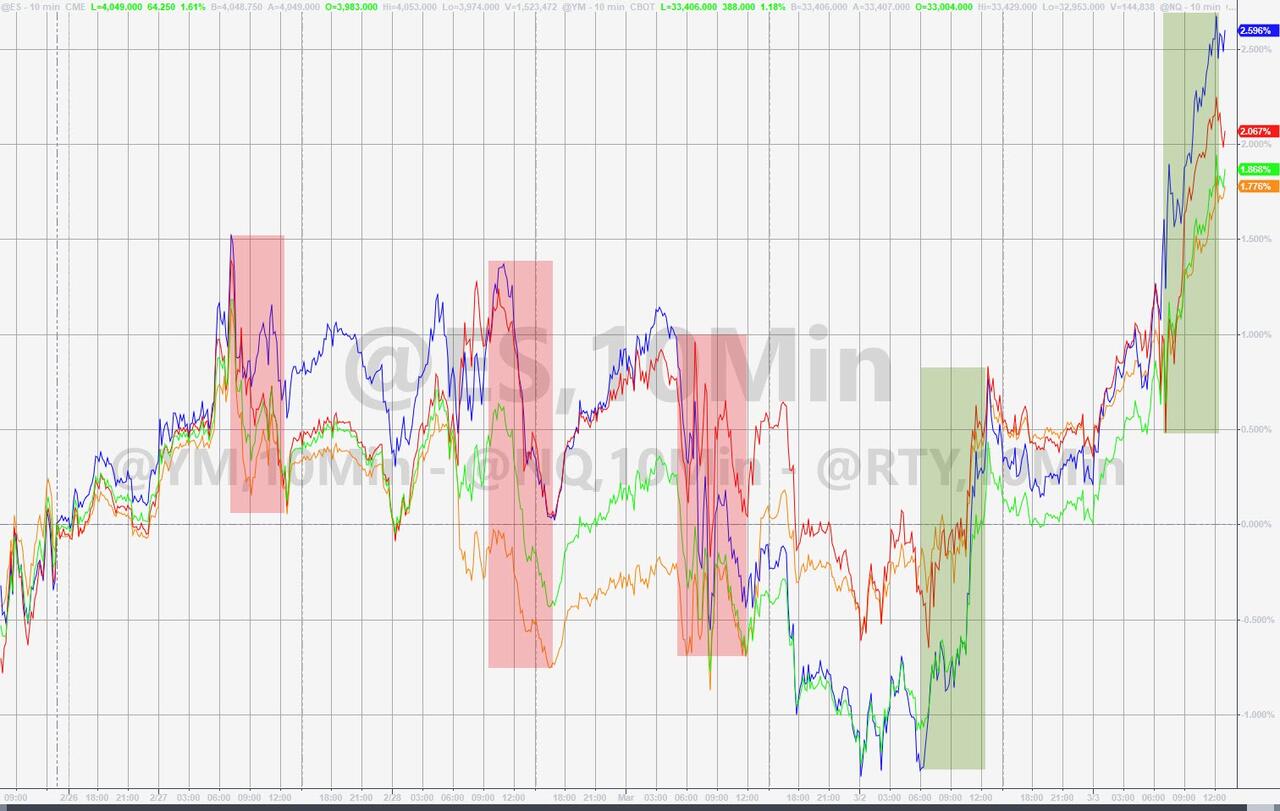
Maybe today, market participants are finally buying what Powell is selling, which caused havoc in all asset classes, since there was no place to hide other than in cash. The fear now on Wall Street is that the expected 25bps interest hike at the next Fed meeting will give way to a more hawkish move of 50bps. That number had not been priced in at all, but its odds have now risen to above 60%.
Powell’s expressed his hawkish warning like this, as ZeroHedge pointed out:
…. If the totality of the data were to indicate that faster tightening is warranted, we would be prepared to increase the pace of rate hikes… The historical record cautions strongly against prematurely loosening policy. We will stay the course until the job is done.
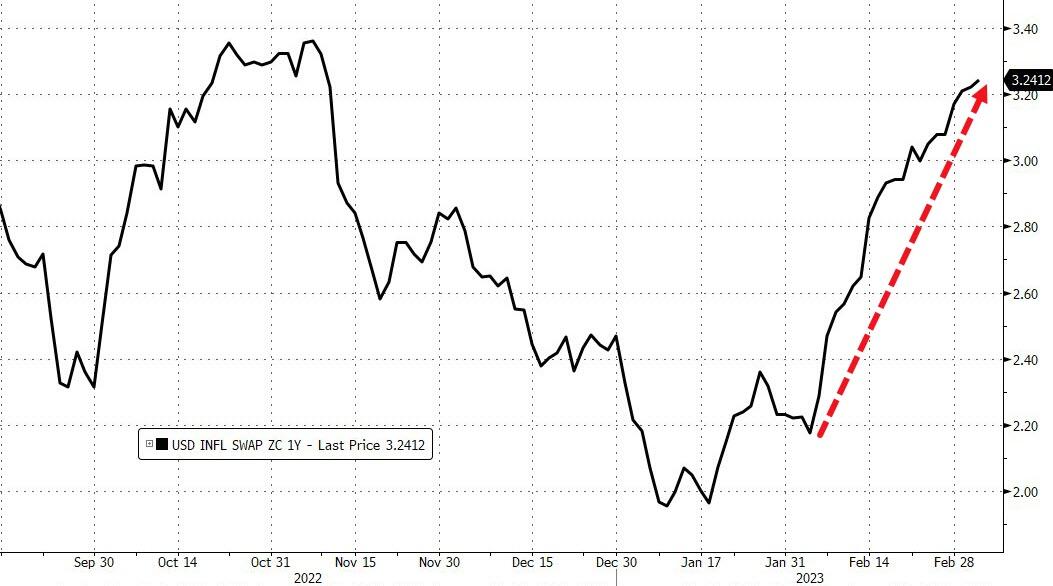
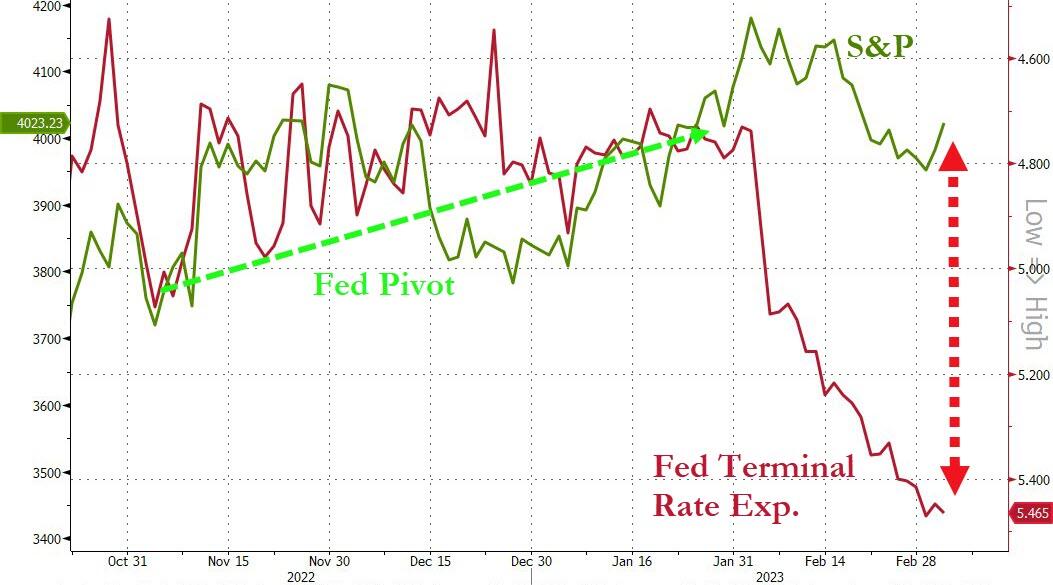
Even though the above was nothing new, the markets were rudely awakened from their dream state of imagining “pause or pivot” soon. That type of wishful thinking was crushed for the time being, as Terminal Rate Expectations propelled to the 5.65% level.
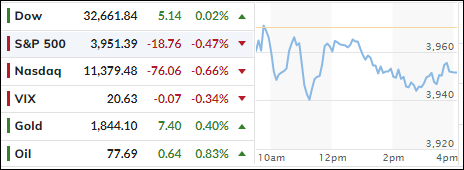
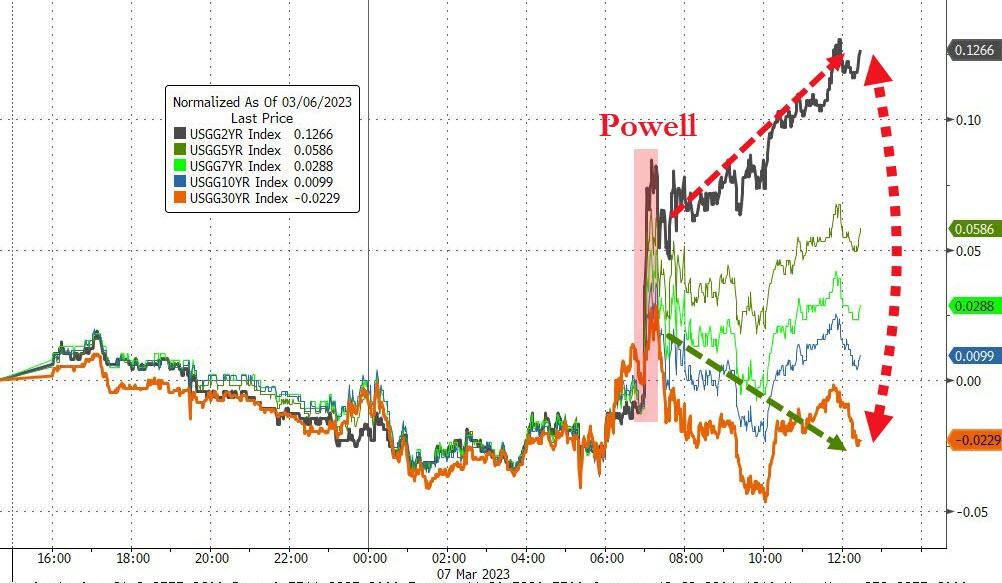
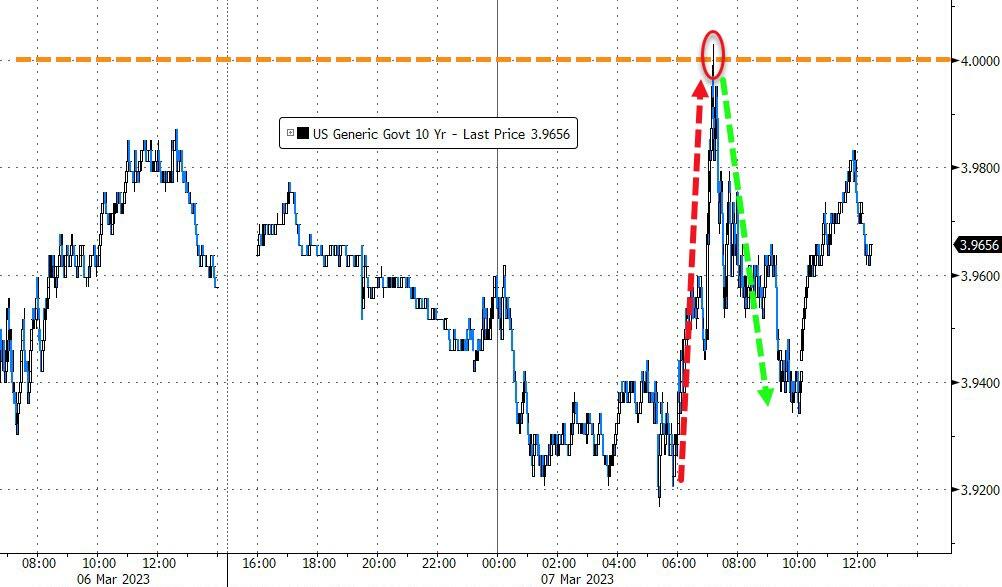
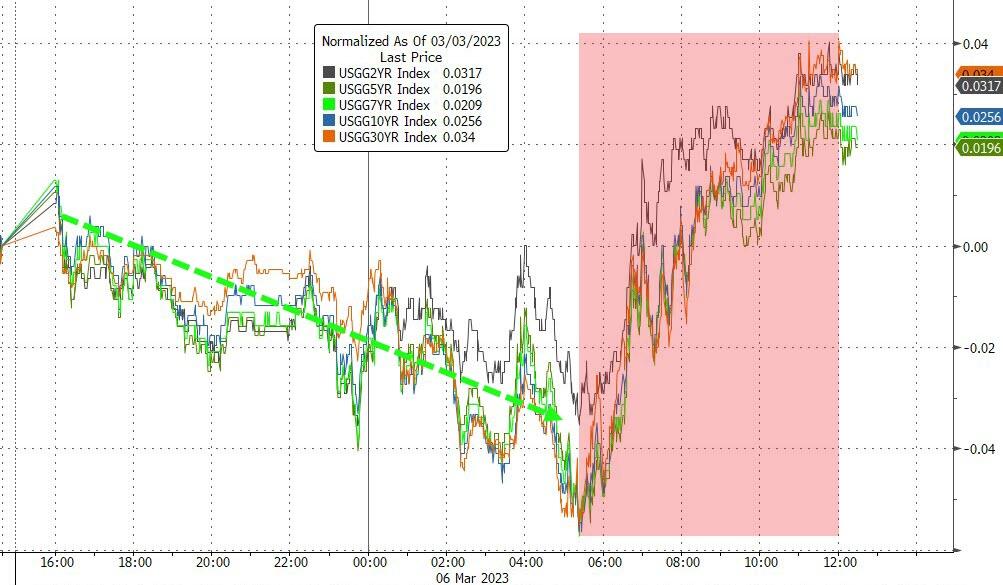
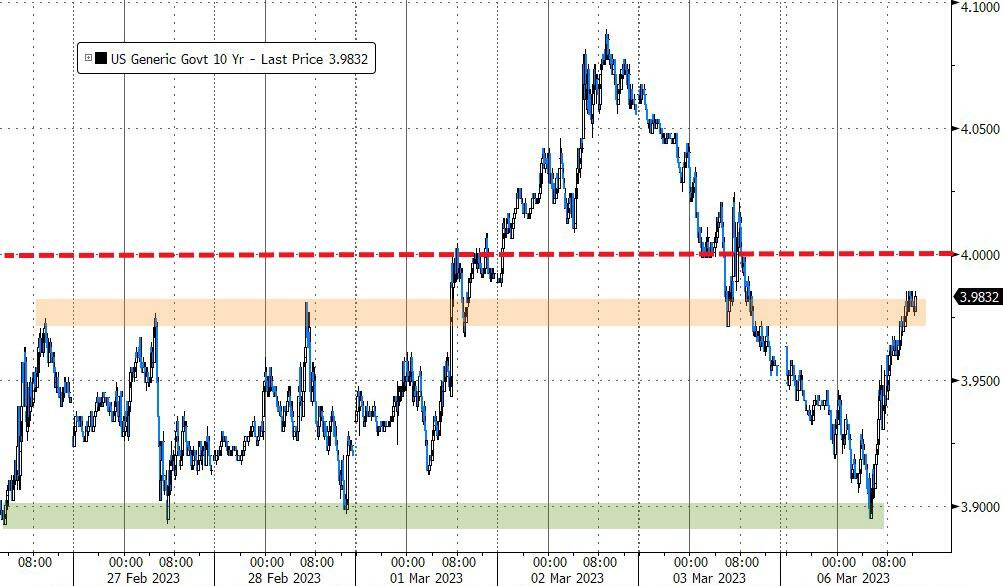
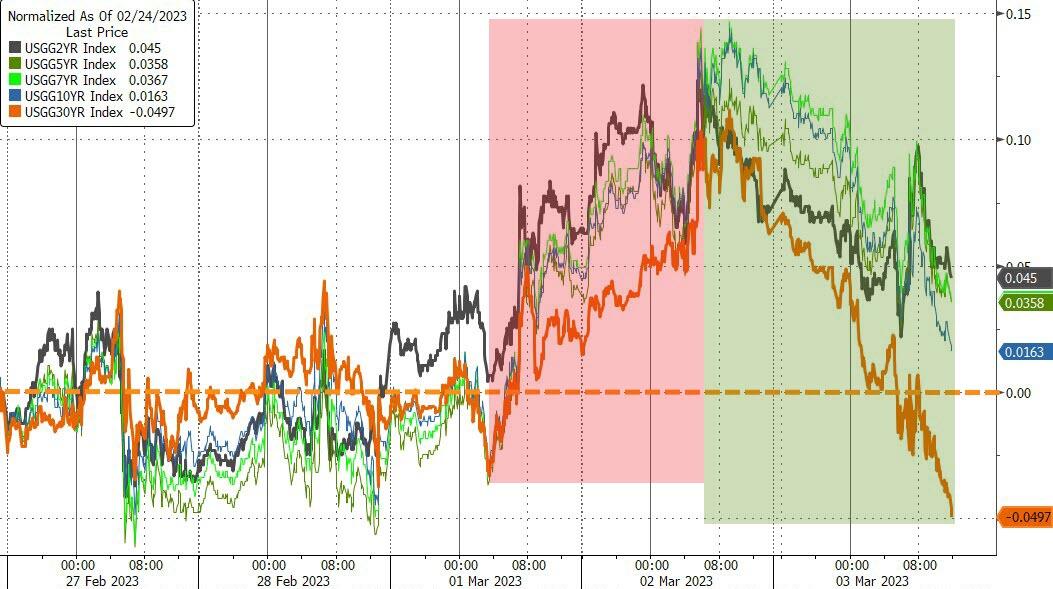
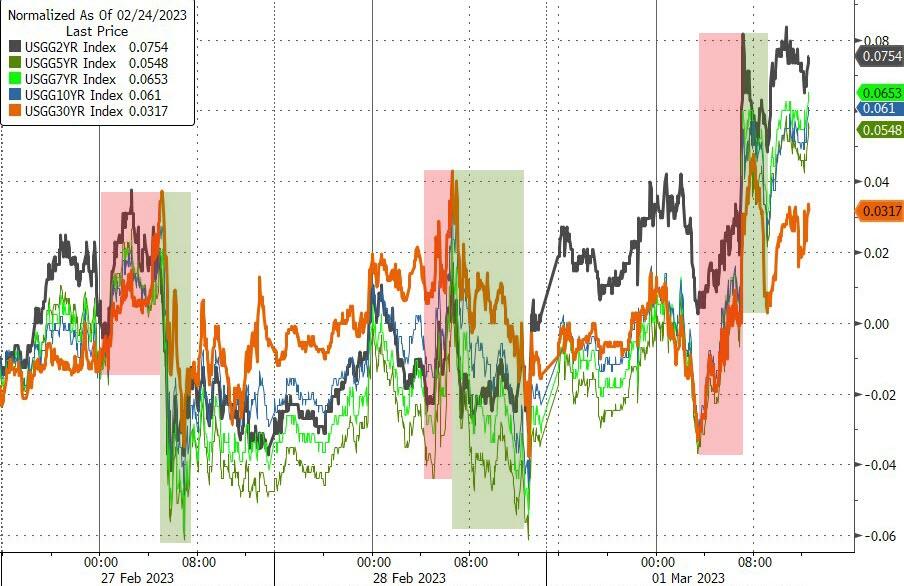
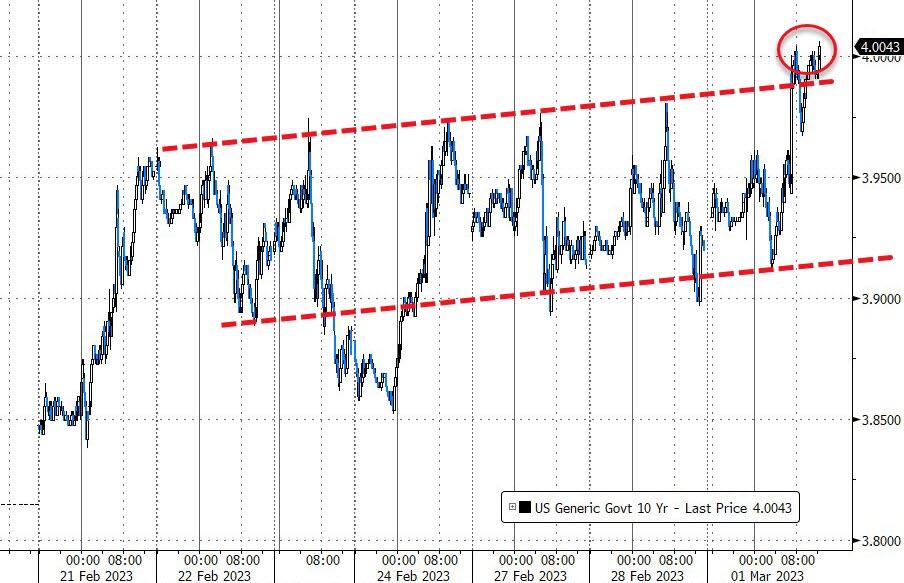
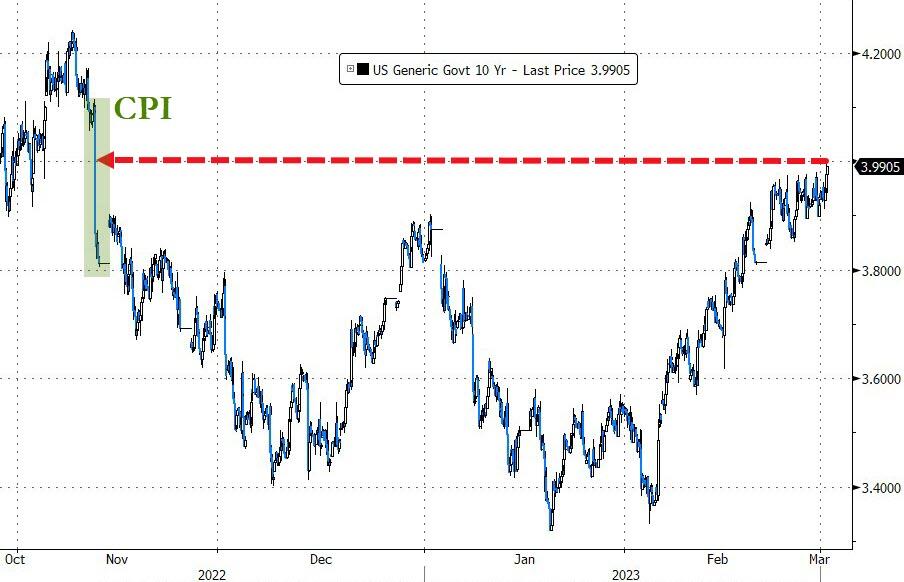
Bond yields were mixed with the short end exploding higher, as the 10-year crossed above 4% again, but it was not able to hold that level, stalled and “only” closed up 12bps at 3.98%.
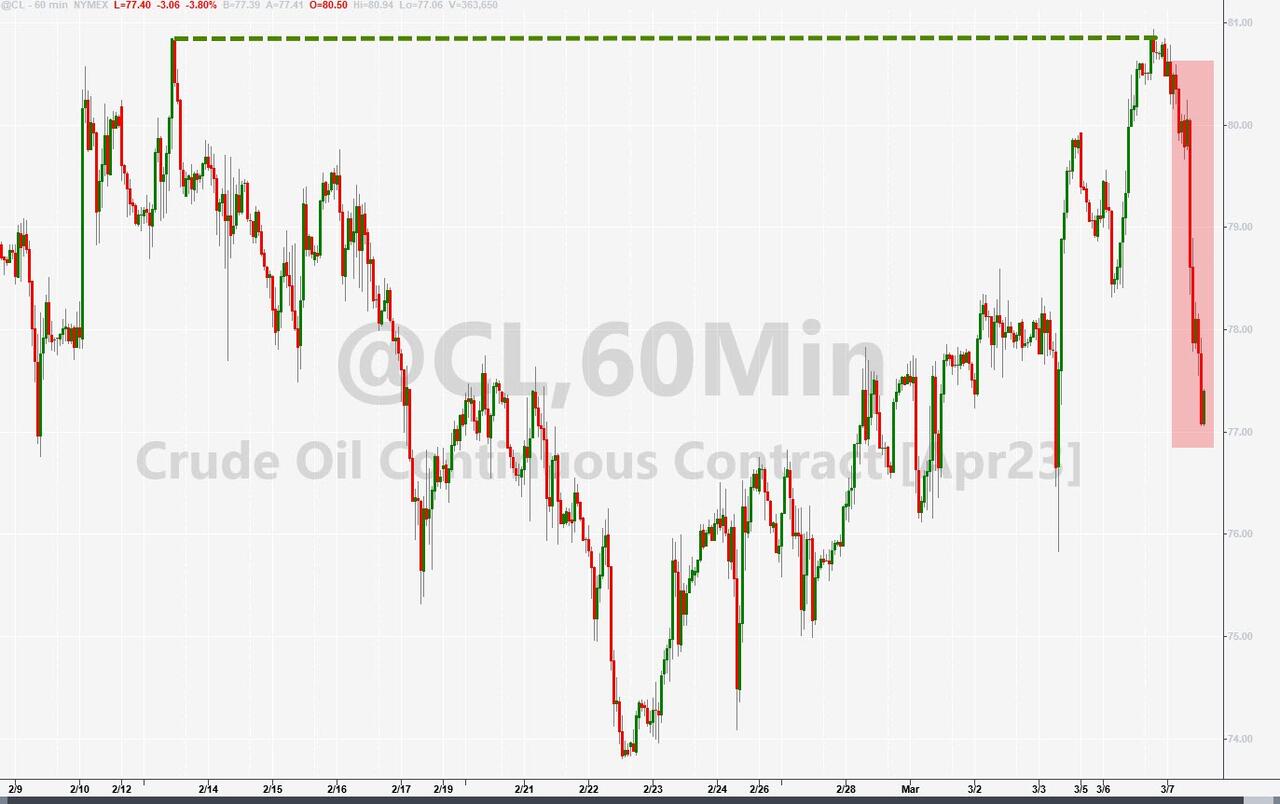
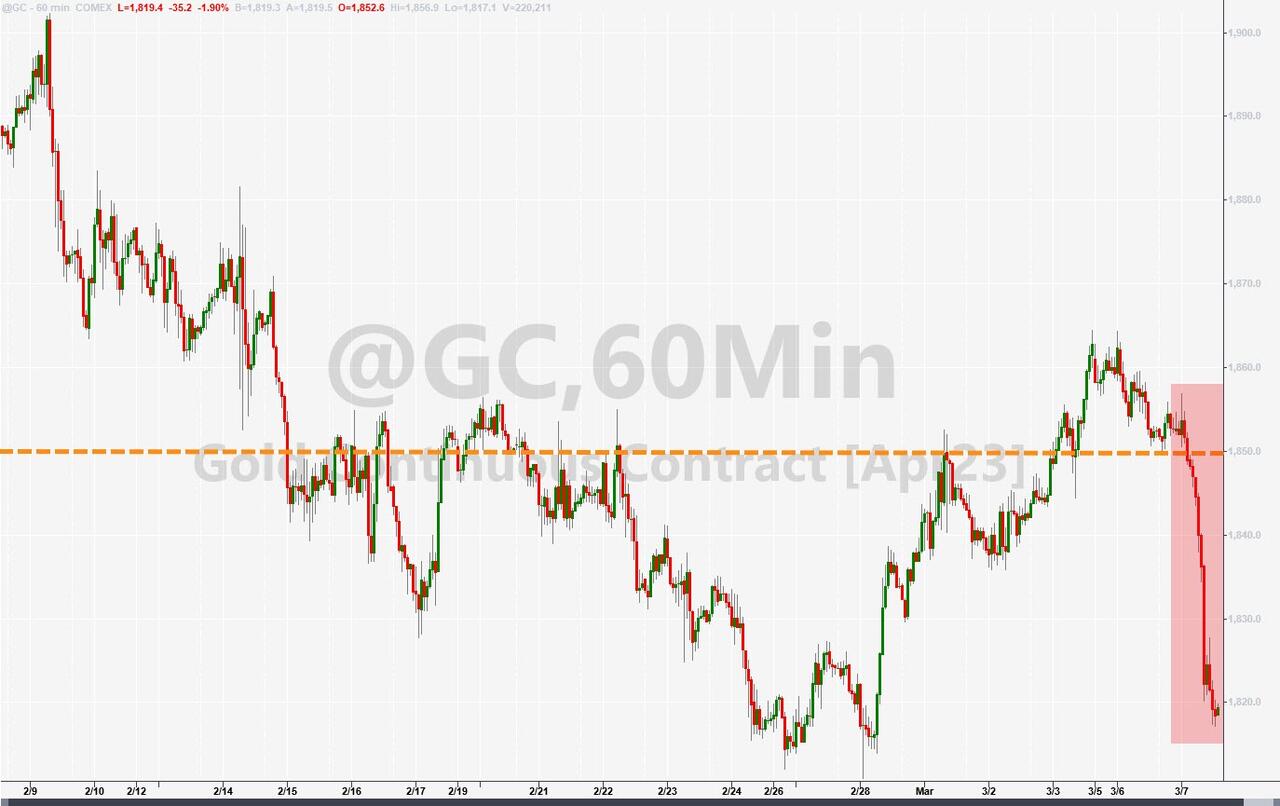
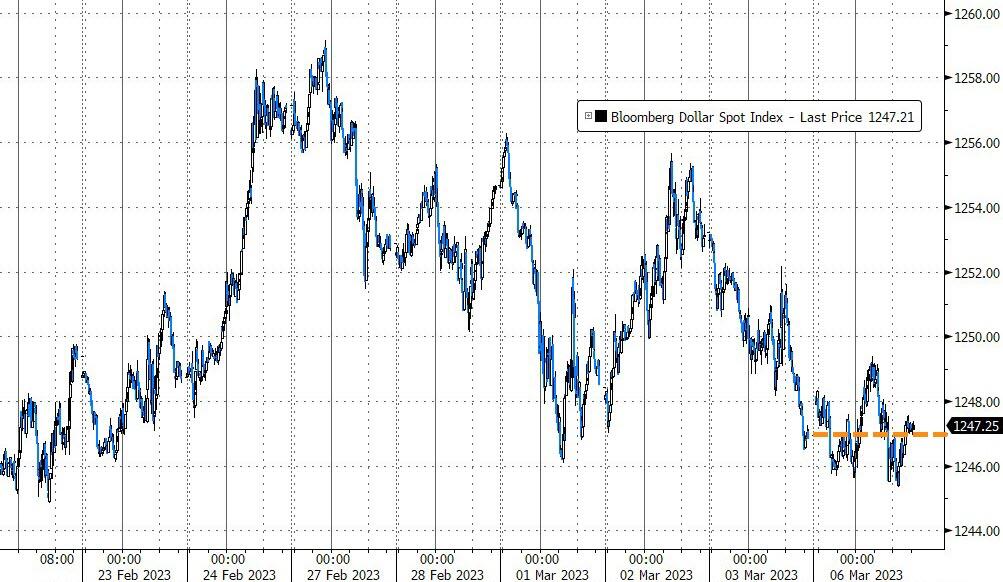
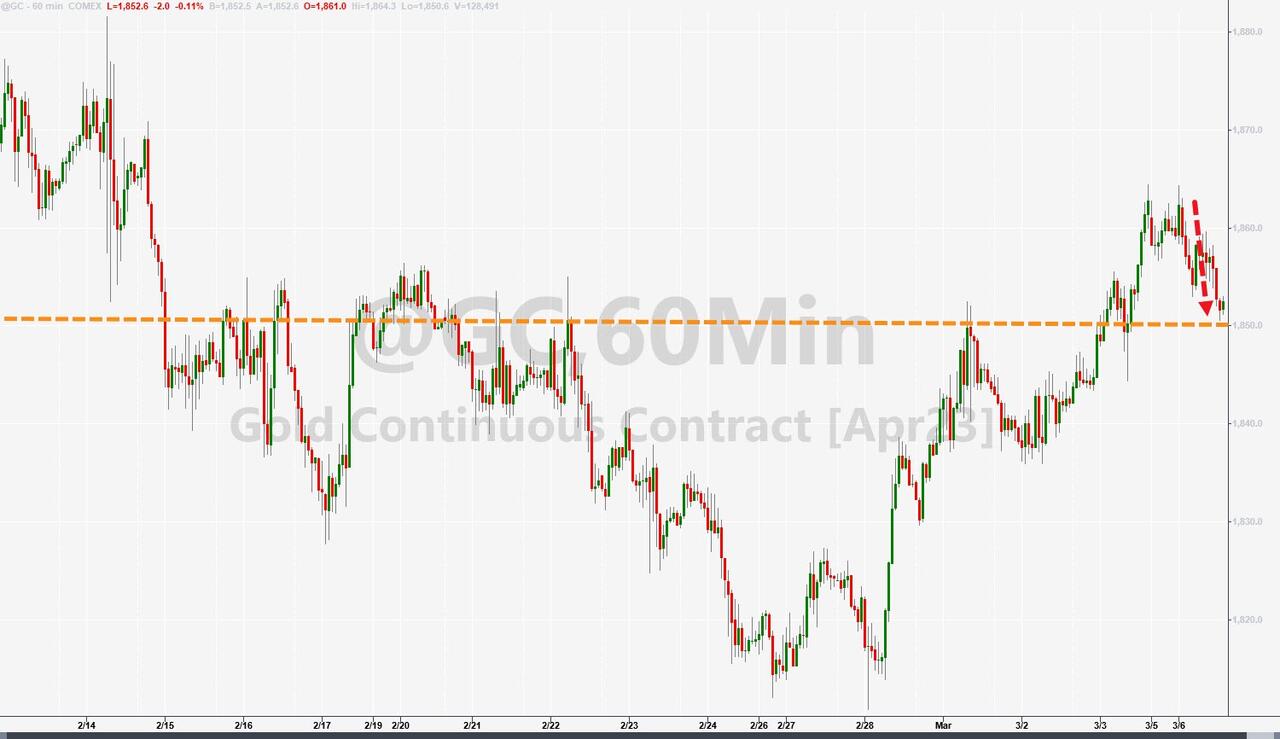
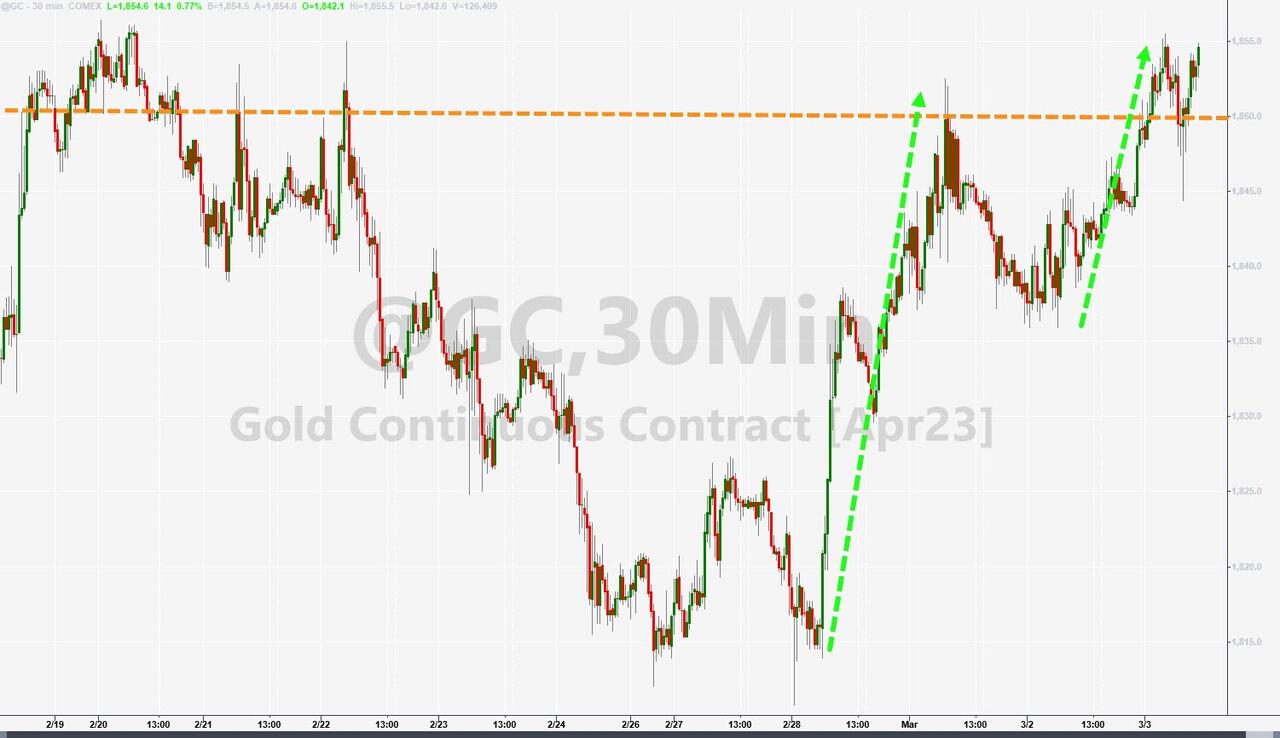
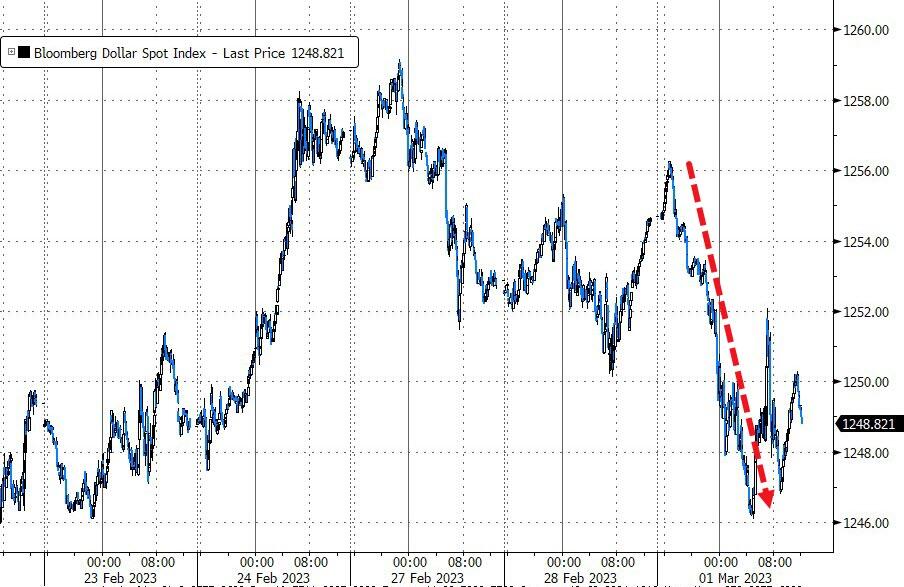
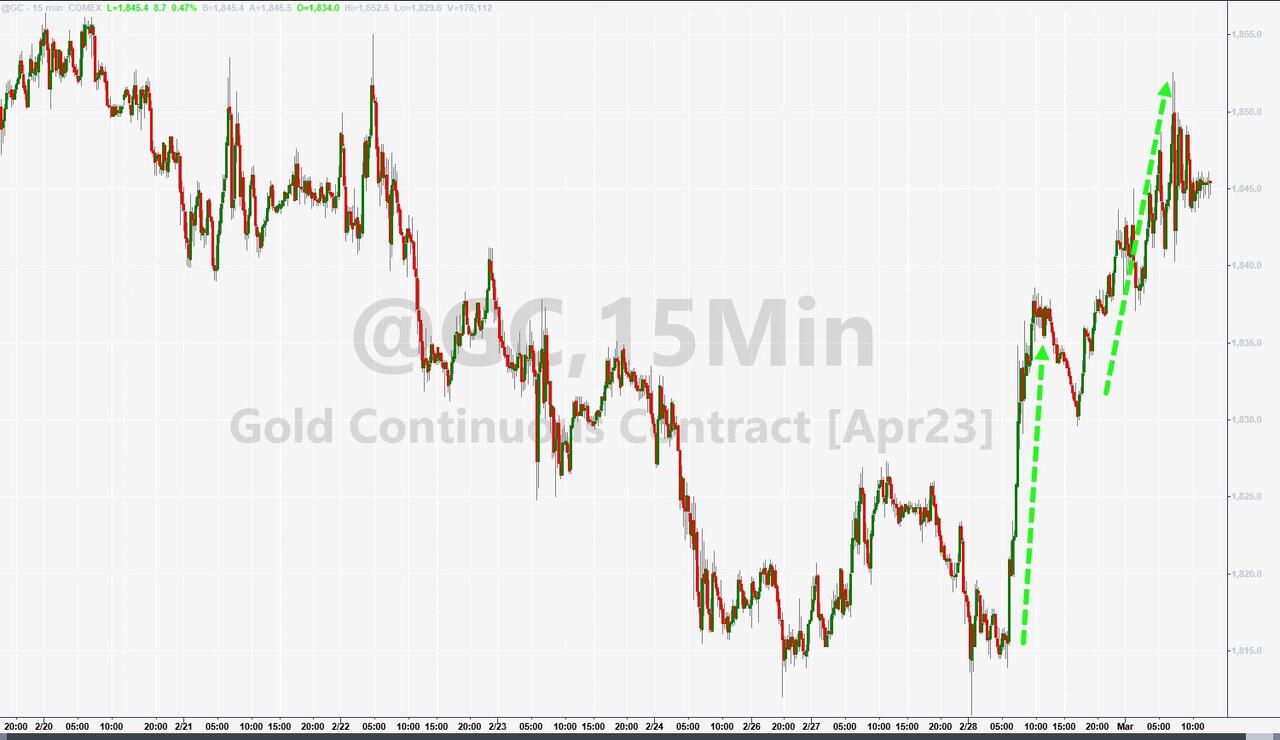
As a result, the US Dollar surged +1.21%, as higher rates make the currency more attractive, Crude Oil crashed about 4%, and Gold was clubbed for a variety of reasons, like fraud by the Perth Mint, a strong dollar and Powell’s hawkish speech. The precious metal managed to successfully defend its $1,800 level.
The markets are now facing an onslaught of economic data ranging from tomorrow’s ADP and JOLTS reports, Friday’s non-farm payrolls, and next week’s CPI, PPI and retail sales.
While the directional outcome is uncertain, the fact that more volatility is on deck will keep the ongoing tug-of-war between bulls and bear alive.
Read More
