Weekly StatSheet For The ETF Tracker Newsletter – Updated Through 08/31/2023

Ulli ETF StatSheet Contact

ETF Data updated through Thursday, August 31, 2023
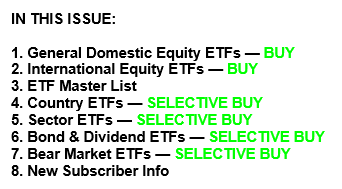
How to use this StatSheet:

  1. Out of the 1,800+ ETFs out there, I only pick the ones that trade over $5 million per day (HV ETFs), so you don’t get stuck with a lemon that nobody wants to buy or sell.
  1. Trend Tracking Indexes (TTIs)

These are the main indicators that tell you when to buy or sell Domestic and International ETFs (section 1 and 2). They do that by comparing their position to their long-term M/A (Moving Average). If they cross above, and stay there, it’s a green light to buy. If they fall below, and keep going, it’s a red light to sell. And to make sure you don’t lose your shirt if things go south, I also use a 12% trailing stop loss on all positions in these categories.

  1. All other investment areas don’t have a TTI and should be traded based on the position of each ETF relative to its own trend line (%M/A). That’s why I call them “Selective Buy.” In other words, if an ETF goes above its own trend line, you can buy it. But don’t forget to use a trailing sell stop of 12%, or less if you’re feeling nervous.

If some of these words sound like Greek to you, please check out the Glossary of Terms and new subscriber information in section 9.

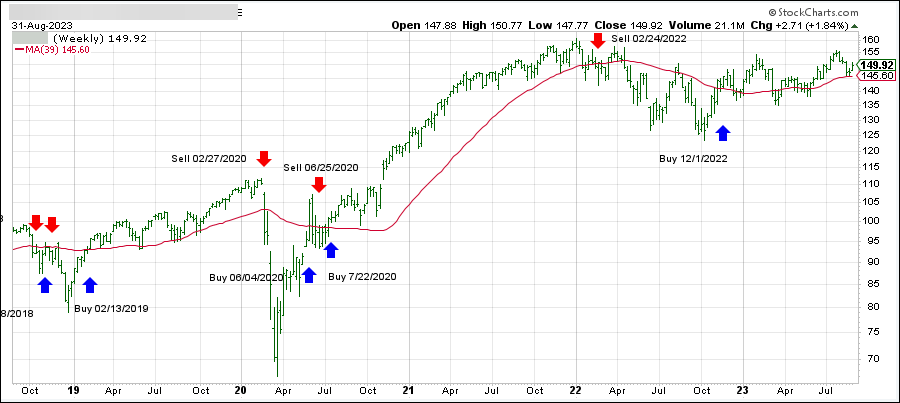
  1. DOMESTIC EQUITY ETFs: BUY— since 12/01/2022
Click on chart to enlarge

This is our main compass, the Domestic Trend Tracking Index (TTI-green line in the above chart). It has now broken above its long-term trend line (red) by +3.02% and remains in “Buy” mode.

Read More
Stocks End August On A Sour Note As Inflation And Bond Yields Weigh

Ulli Market Commentary Contact

[Chart courtesy of MarketWatch.com]

  1. Moving the markets

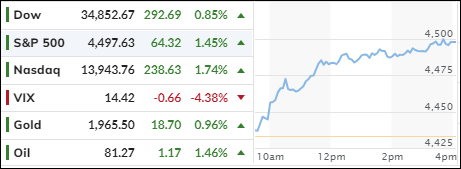
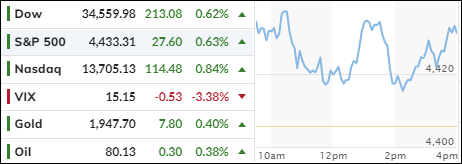
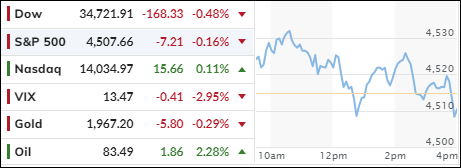
The stock market had a roller-coaster ride on Thursday, as an early rally fizzled out and left only the Nasdaq in the green. The other two major indexes closed slightly lower, snapping a 4-day winning streak. The month of August was a bumpy one for stocks, as the S&P 500 trimmed its losses from nearly 5% to less than 2%. Small caps suffered the most, as they usually do in turbulent times.

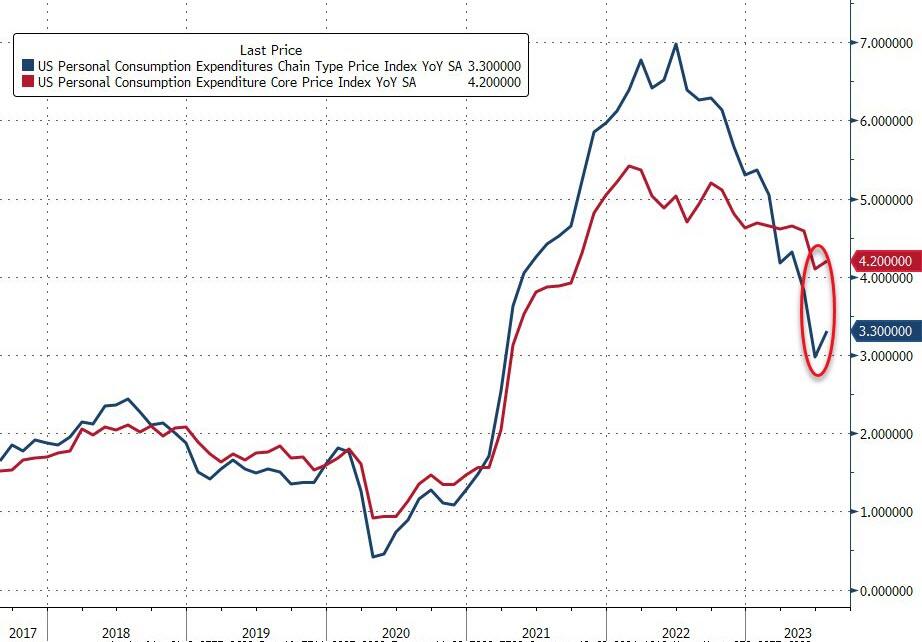
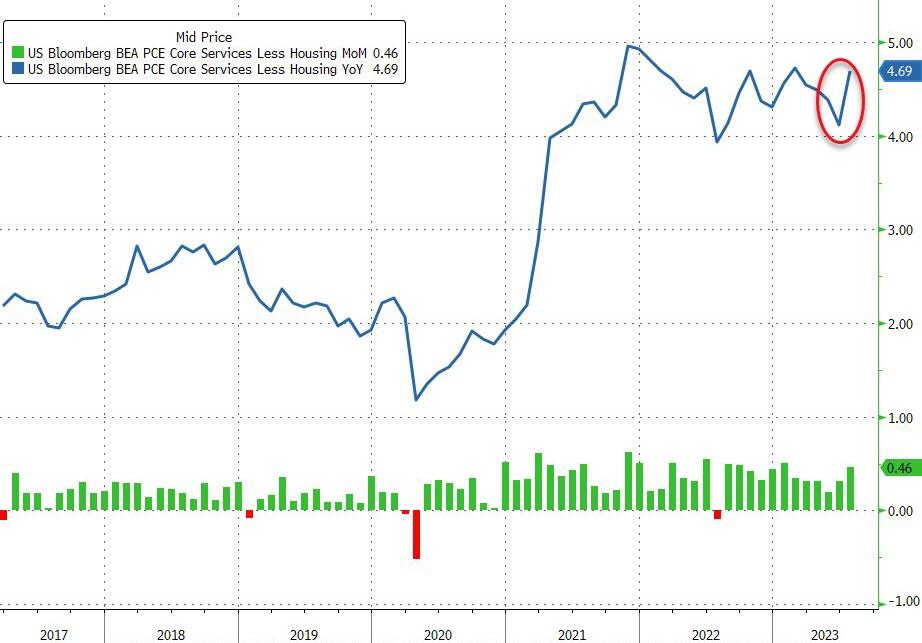
Inflation remained a hot topic, as the Fed’s preferred measure, the Core PCE Deflator, rose to 4.2% year-over-year in July, matching expectations but higher than June’s 4.1%. The headline PCE also jumped to 3.3%, the highest since June 2022. But if you take out the housing component, which accounts for a large chunk of consumer spending, inflation is still stuck at elevated levels, as this chart shows.

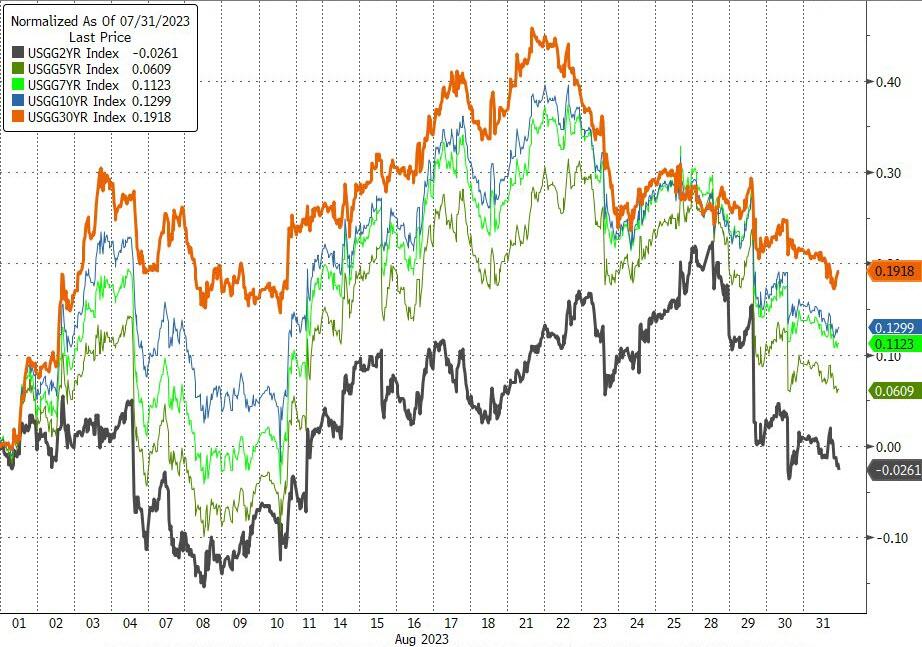
Bond yields were initially falling, which boosted stocks, but then reversed course and started to climb, which dragged stocks down. It seems that stocks are following bonds closely these days, so lower yields could mean higher stock prices in the near term.

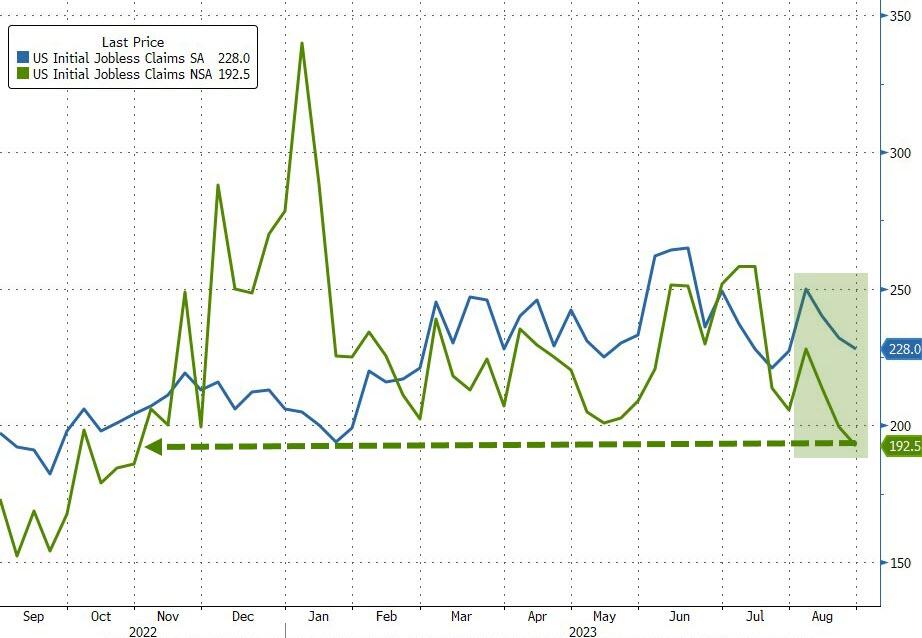
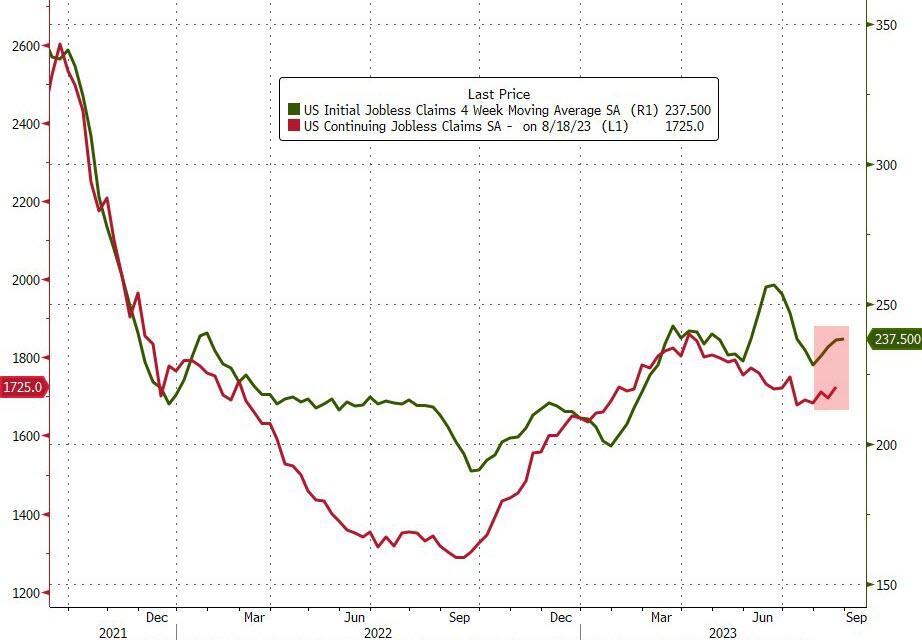
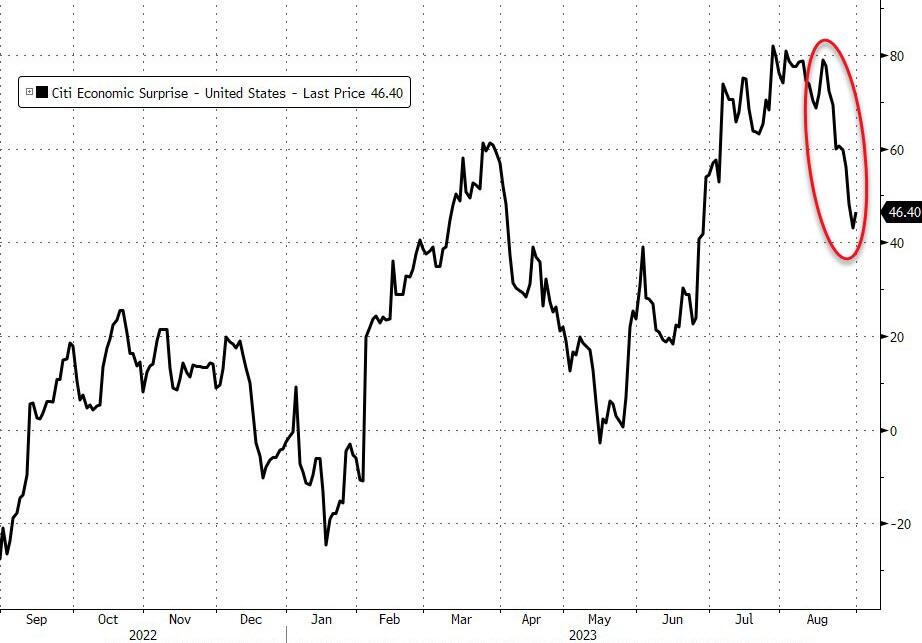
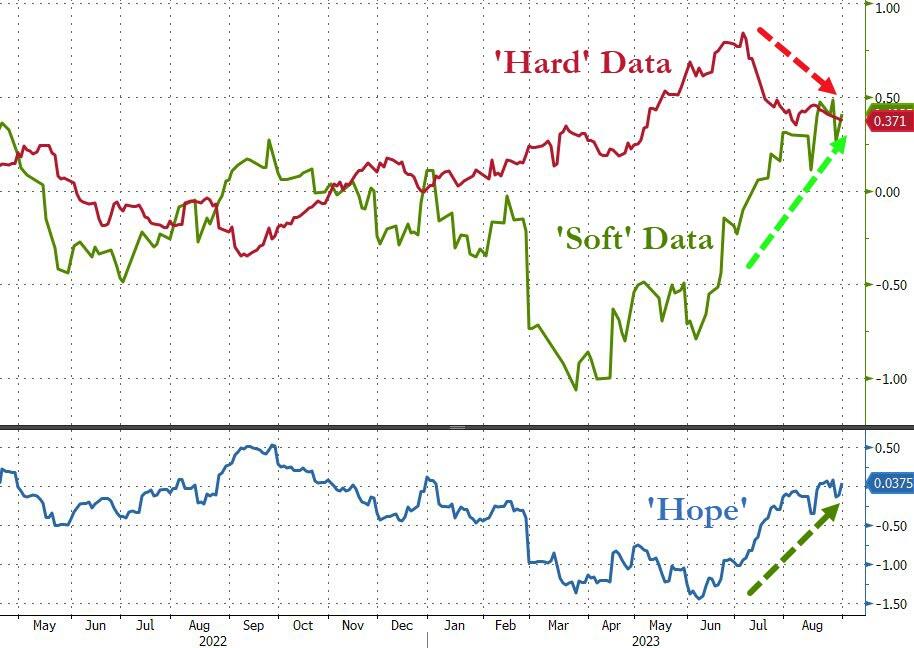
The labor market showed mixed signals, as initial jobless claims dropped to 2023 lows despite a surge in layoffs, but continuing claims rose above 1.7 million last week. The economic recovery seems to have hit a speed bump in August, as various indicators showed the biggest monthly decline since May 2022. The data was also inconsistent, with some measures showing strength and others showing weakness.

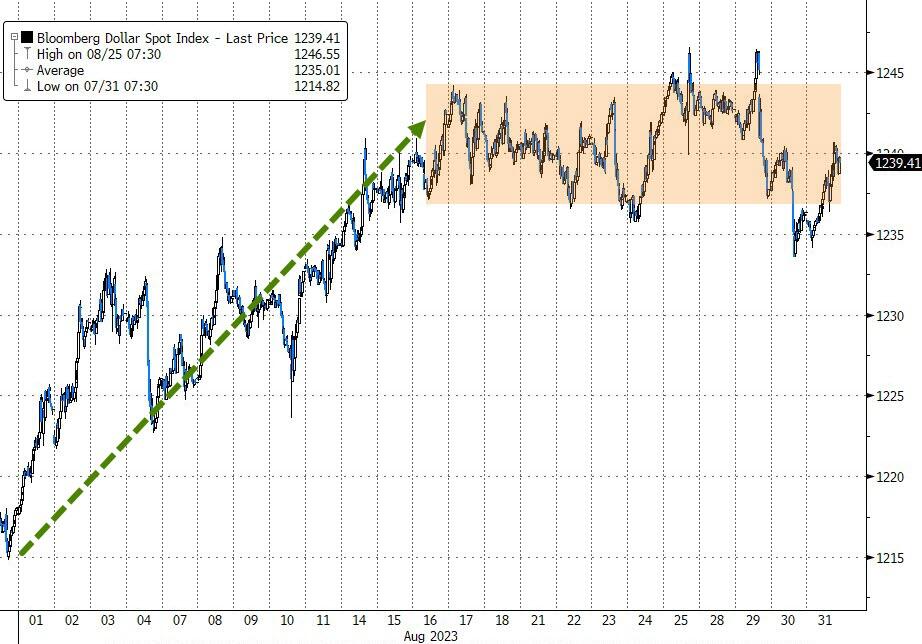
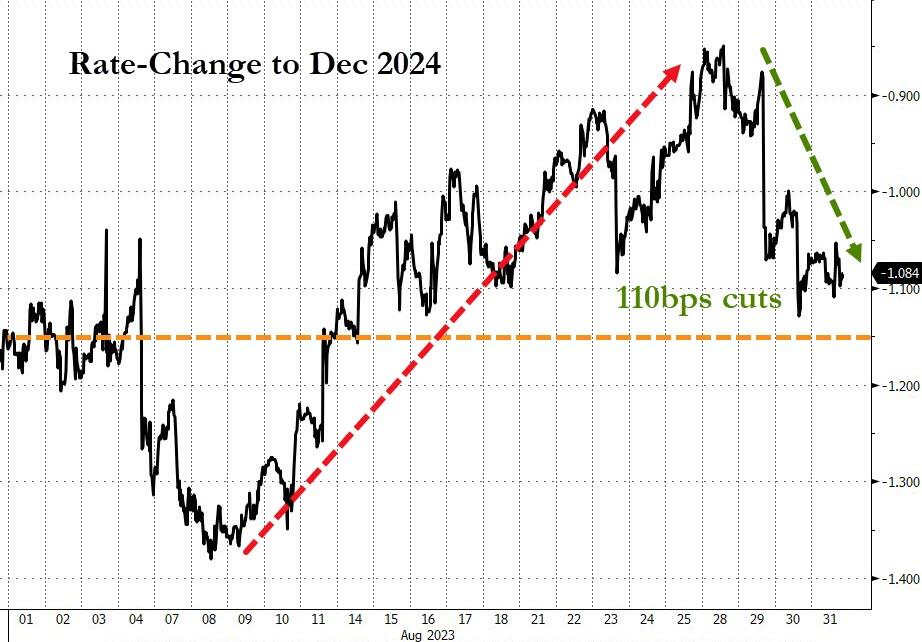
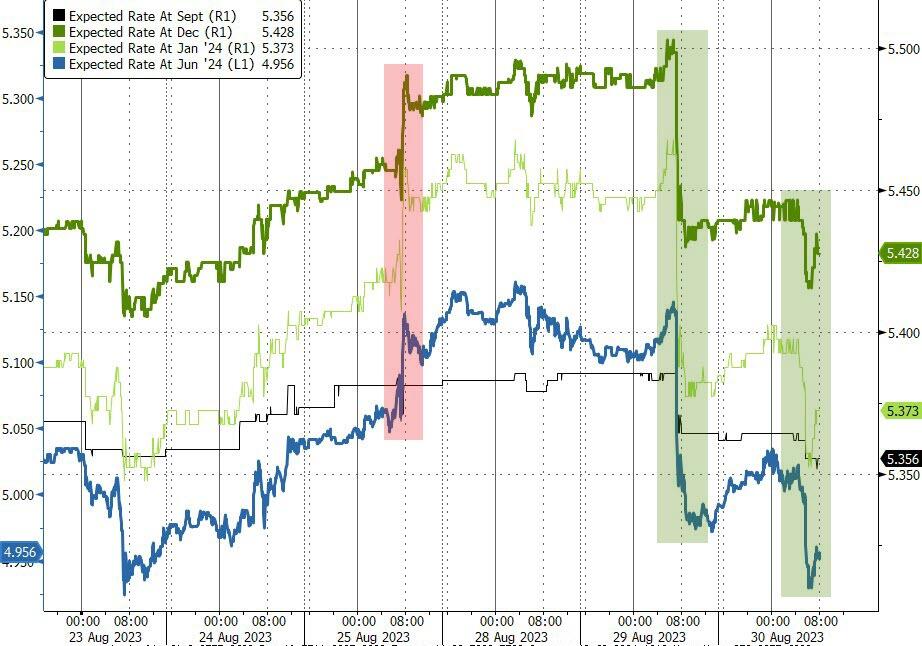
The dollar had a strong month, rising the most since February, but has been trading sideways for the last two weeks. The Fed has been talking tough about tapering and hiking rates, but the market is not buying it. The market is pricing in 1.1% of rate cuts by the end of next year, which could be a big mistake if the Fed follows through on its hawkish rhetoric.

The bottom line is that the market is facing a lot of uncertainty and volatility, and we need to be prepared for more swings ahead.

Read More
Bad News Boosts Stocks, But For How Long?

Ulli Market Commentary Contact

[Chart courtesy of MarketWatch.com]

  1. Moving the markets

The stock market seems to be living in a paradox these days. Weak economic data, which usually spells trouble for equities, has been boosting them instead. Why? Because investors are hoping that the Fed will ease its monetary policy in response to the slowdown.

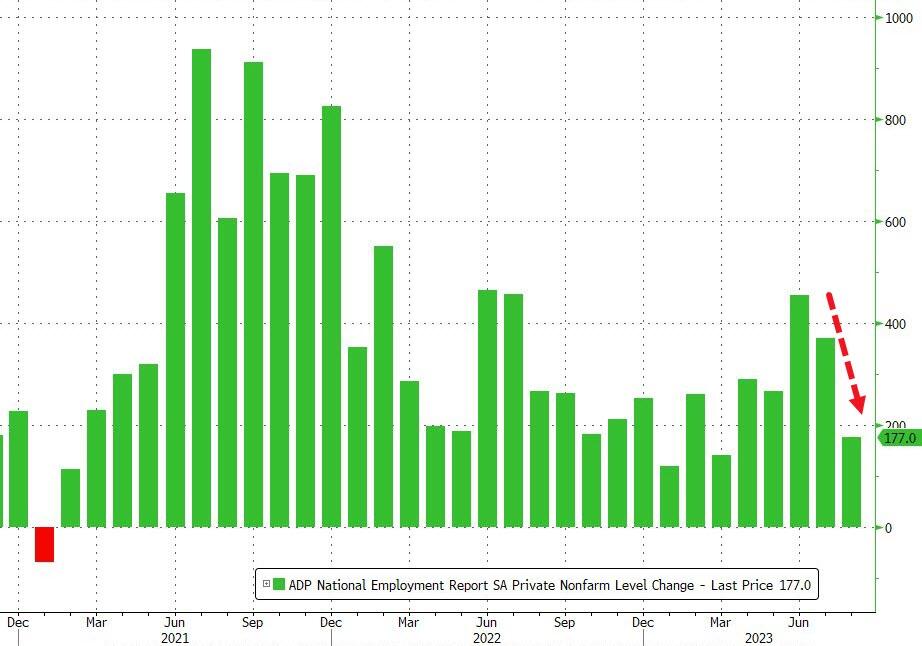
On Wednesday, traders got another dose of bad news. ADP reported that private employers added only 177k jobs in August, much lower than the revised 371k in July. This signaled a cooling off in the labor market and lowered the expectations of a rate hike.

Meanwhile, the annual GDP growth rate was also revised down to 2.1% from 2.4%, adding to the gloomy picture of the economy.

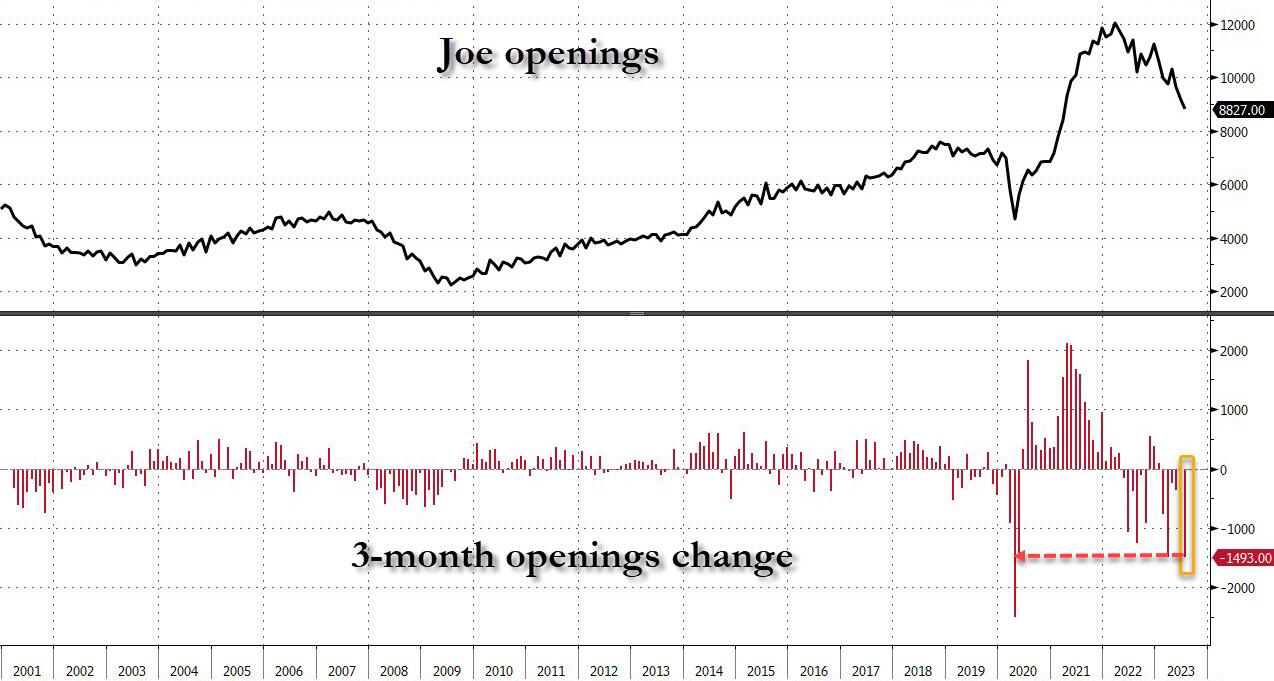
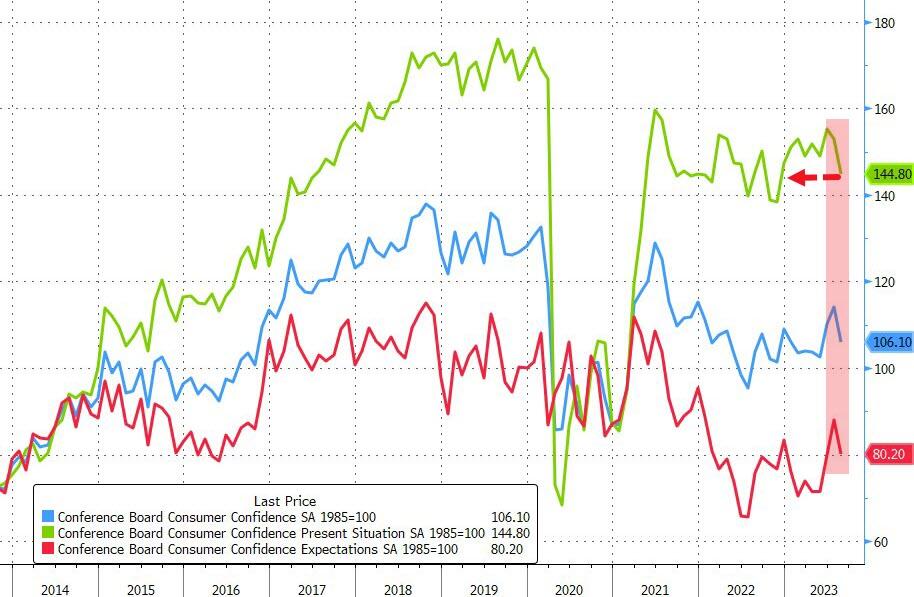
This was the second day in a row that investors shrugged off poor economic data and pushed stocks higher. On Tuesday, the major U.S. indexes rallied after disappointing consumer confidence figures and a sharp drop in job openings for July. This sparked hope that the Fed could be more dovish in its upcoming meetings.

Some analysts call this a ‘bad news is good news’ environment, which tends to happen when investors are worried about rates and Fed policy. Any softness in economic data reduces the upward pressure on yields, and that helps equities.

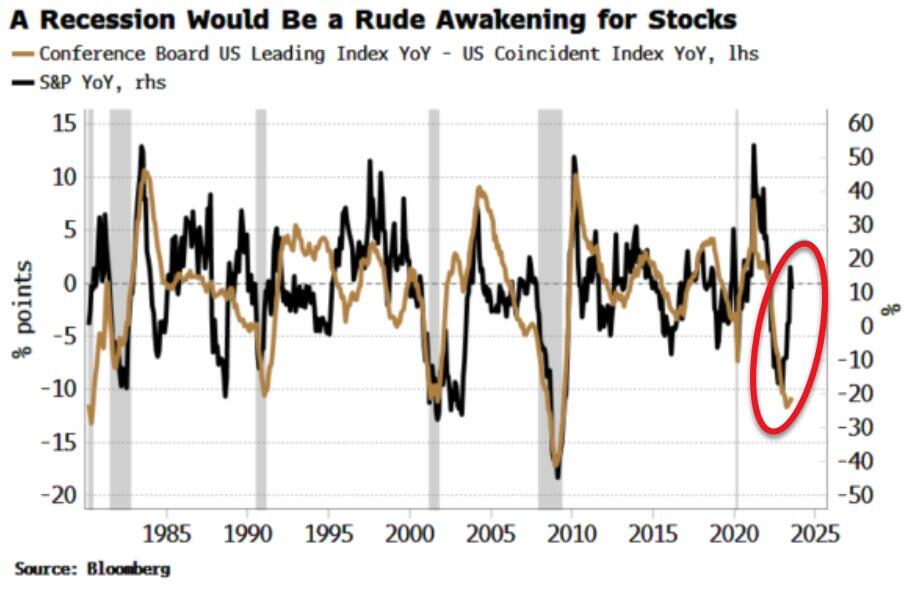
But this paradoxical situation may not last long, as Bloomberg’s Simon White noted. He pointed out the divergence between the S&P 500 index and the Leading Economic Index, which measures future economic activity. The S&P 500 has been rising while the LEI has been falling, suggesting that stocks are out of sync with the recession risks.

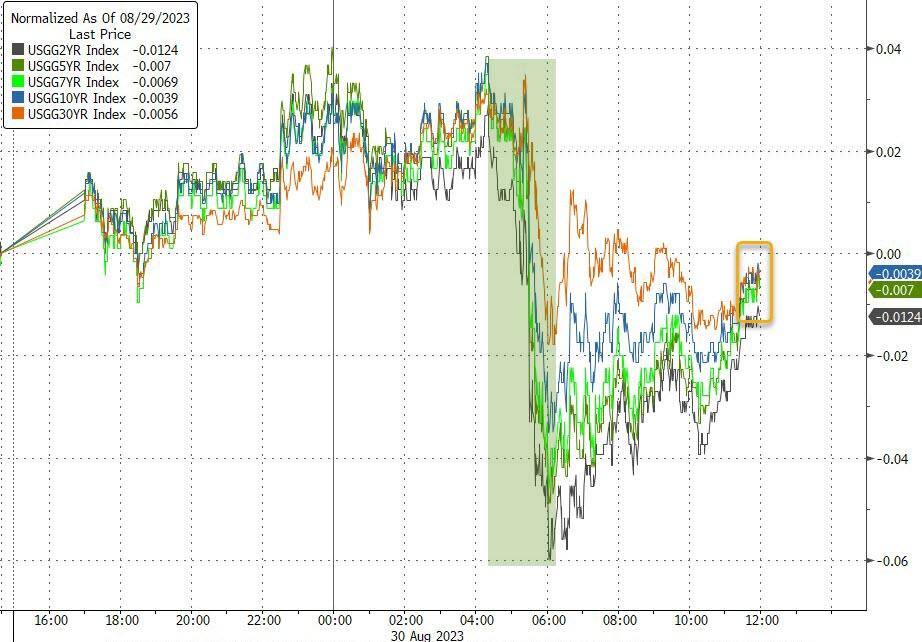
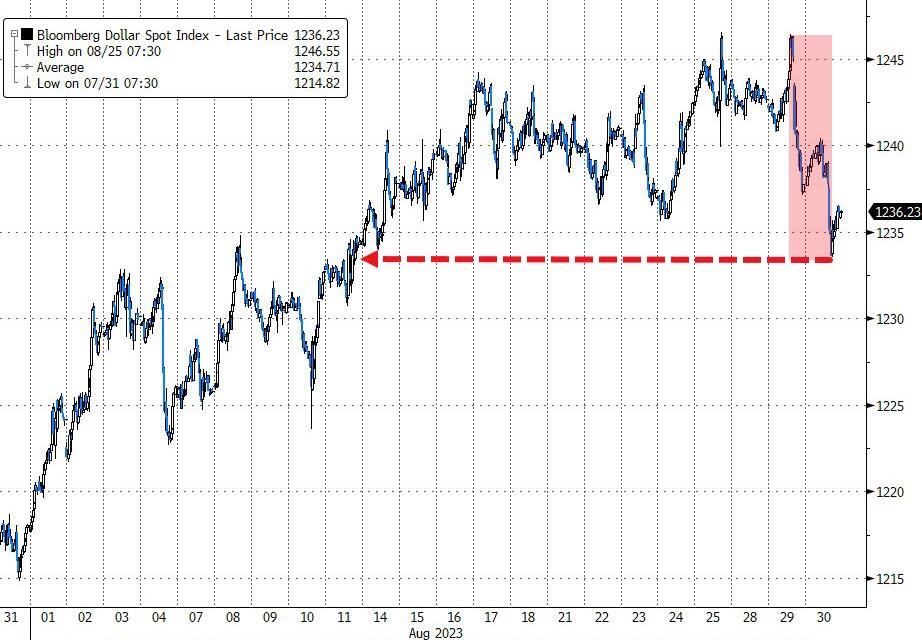
The bond market also showed signs of volatility, as yields swung wildly but closed lower on Wednesday. The dollar weakened again, giving a boost to gold prices.

So, what does this all mean for us trend followers?

It means that we need to be cautious and prepared for any surprises. The market may be enjoying the bad news for now, but it may not be able to ignore reality for long.

Read More
Bad News Is Good News: Markets Rally On Hopes For Rate Cuts

Ulli Market Commentary Contact

[Chart courtesy of MarketWatch.com]

  1. Moving the markets

The markets tried to shake off their August blues by betting on bad news. The Labor Market showed signs of a slowdown, with fewer job openings and lower revisions. The US Macro Data index also dropped for eight days in a row.

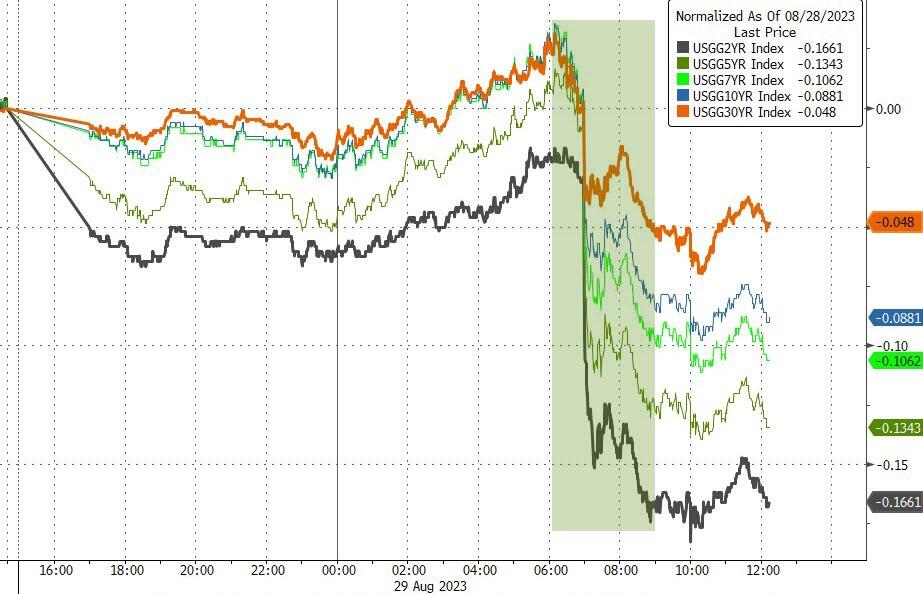
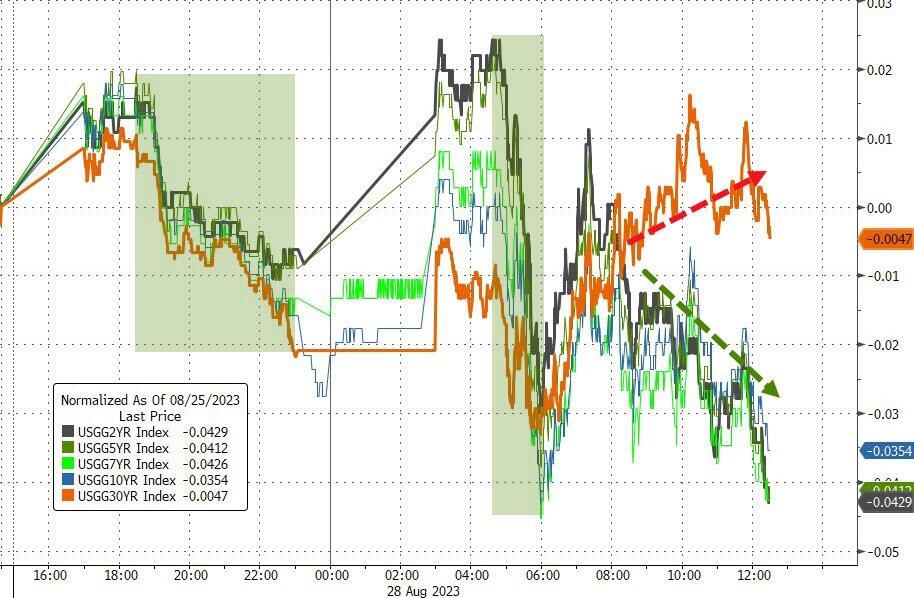
Some analysts feared a hard landing recession, but Wall Street traders saw a silver lining: the Fed might cut interest rates sooner and more aggressively. The hopes for lower rates were boosted by falling bond yields and weak Consumer Sentiment data. The market expectations for Fed rate changes reversed course and ignored Powell’s hawkish stance.

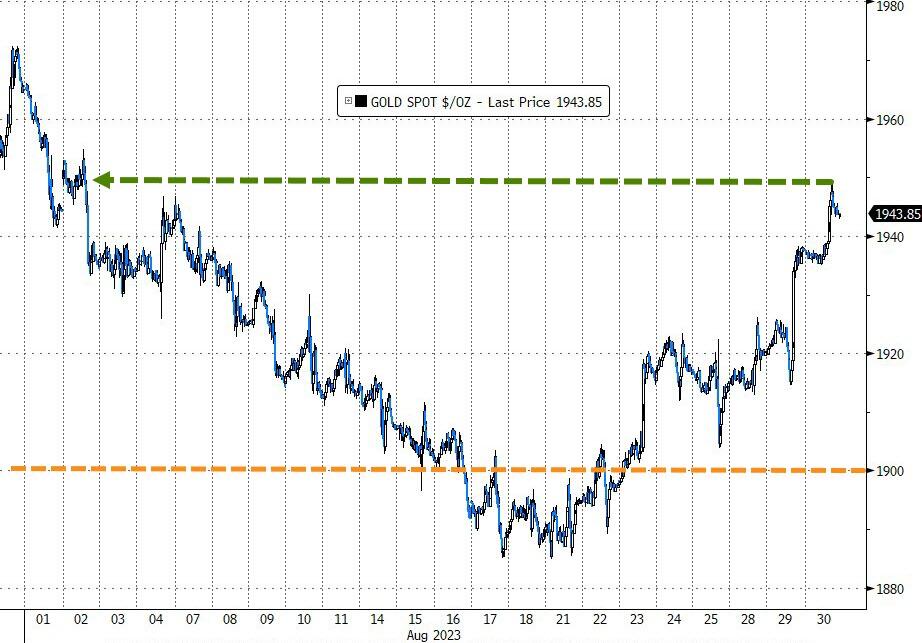
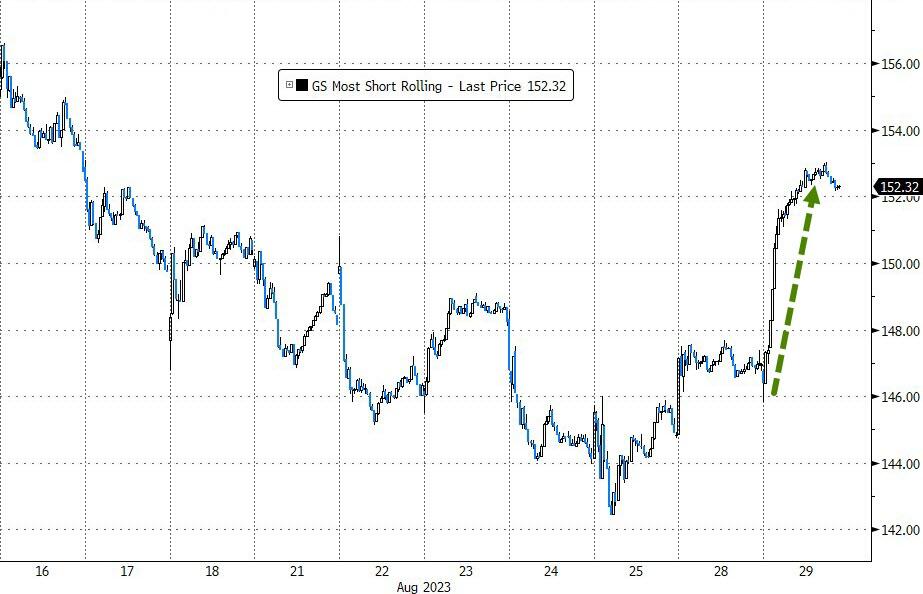
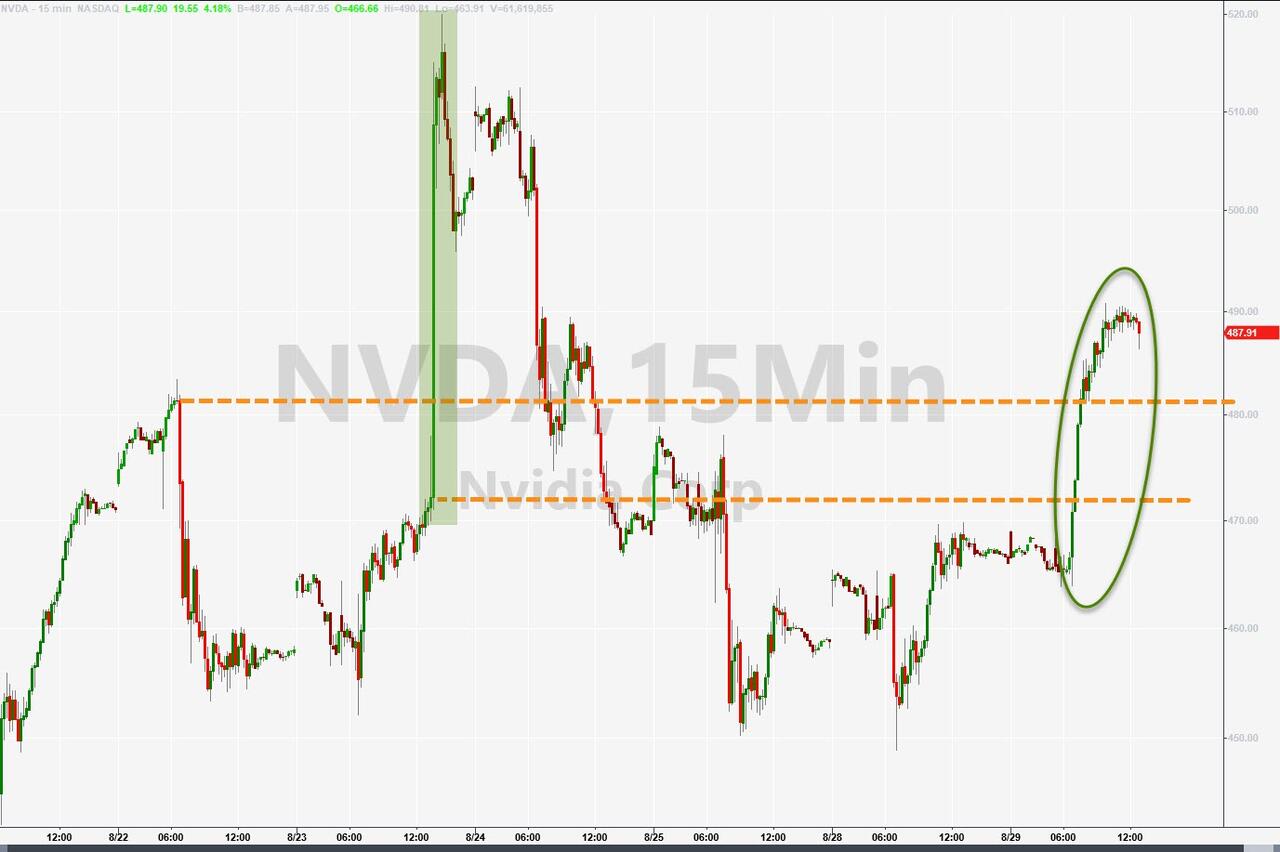
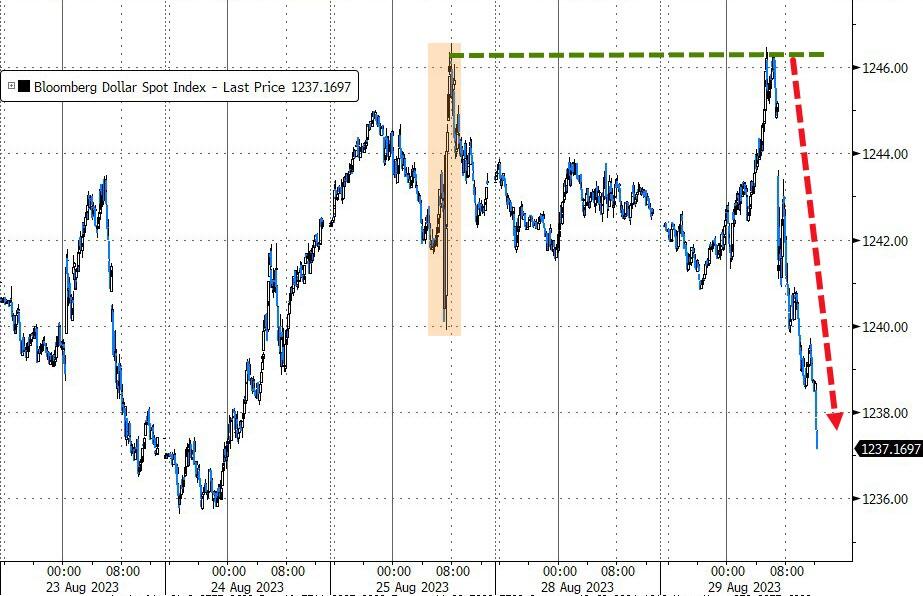
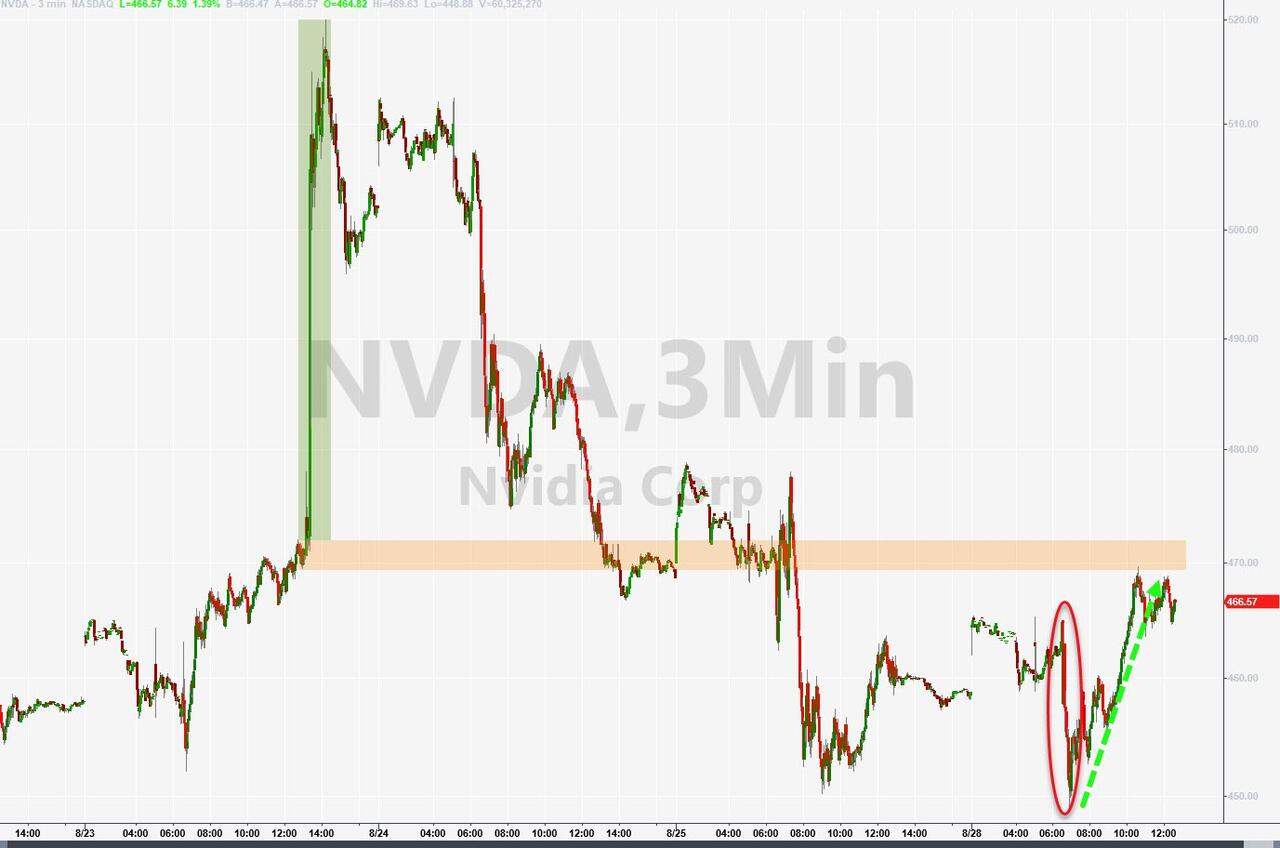
The rally was also fueled by a short squeeze, as the bears had to cover their positions. Nvidia soared above its pre-earnings highs before losing some steam. The dollar took a dive and posted its biggest loss since mid-July. Gold shone and jumped almost 1%.

I think the market volatility in August is not over yet, and I expect more swings in September as the market adjusts to a slower economy. The Fed’s past rate hikes have taken their toll on the economy, especially on the housing market, which faces higher mortgage rates.

Read More
Markets Ignore Powell’s Hawkish Tone And Rally On Buy-Program

Ulli Market Commentary Contact

[Chart courtesy of MarketWatch.com]

  1. Moving the markets

The markets shrugged off Powell’s hawkish speech at Jackson Hole and rallied on Monday, boosted by a massive buy-program in the final hour. Powell reiterated that the Fed is ready to raise rates further if needed, but also said that it would be careful, and data driven.

Lagarde, the ECB chief, echoed her cautious tone and did not hint at any imminent rate hike. Traders are now looking ahead to some key economic indicators later this week, such as the PCE inflation index on Thursday and the non-farm payroll report on Friday.

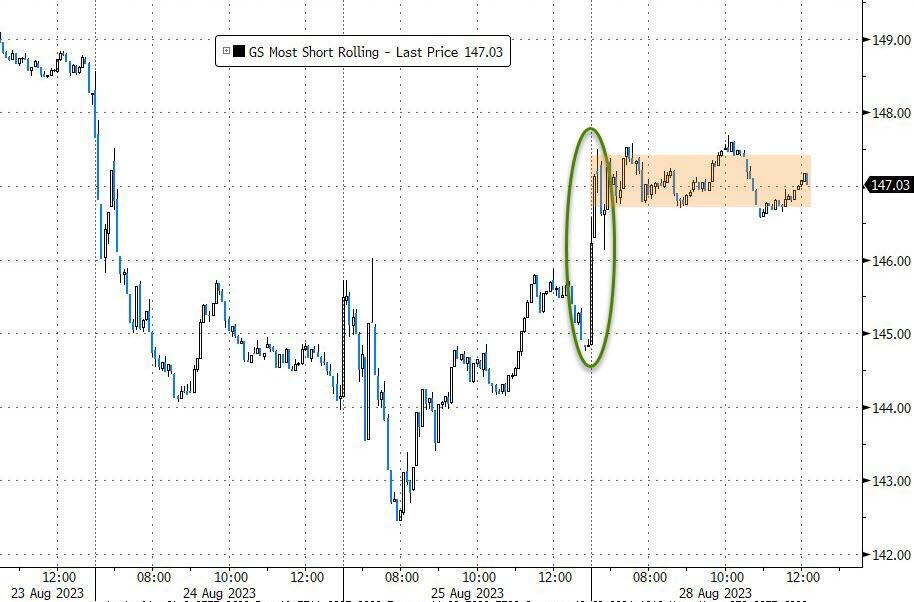
These data points could influence the Fed’s decision on when to start tapering its bond purchases and raising interest rates. The market action on Monday was also driven by a short squeeze in some stocks, such as Nvidia, which recovered from an early drop.

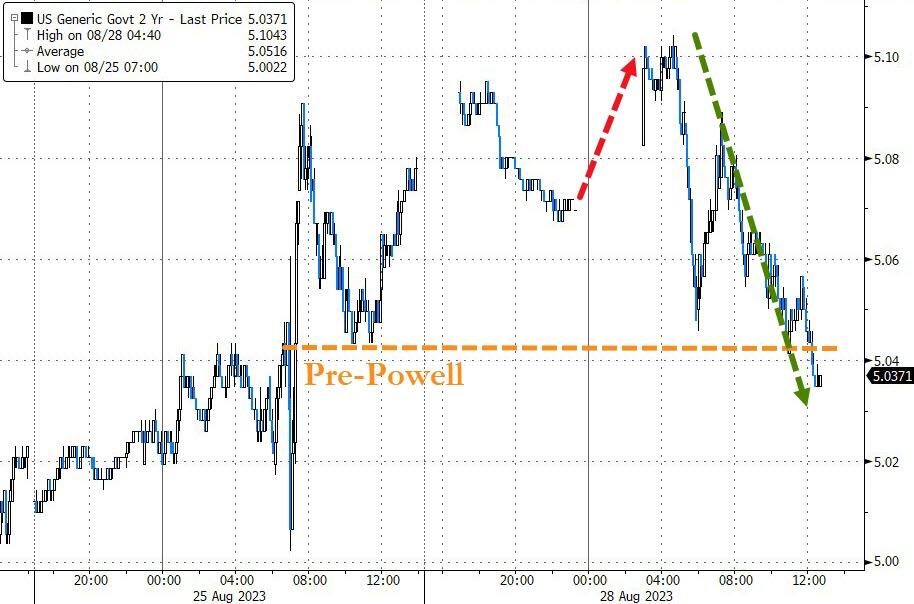
Bond yields were mixed, with the 2-year yield briefly topping 5.1% before settling above 5%. The dollar was flat, while gold rose to a 3-week high. The volatility is likely to continue as traders brace for more news on the economy and monetary policy.

Read More

ETFs On The Cutline – Updated Through 08/25/2023

Ulli ETFs on the Cutline Contact

Do you want to know which ETFs are hot and which ones are not? Then you need my High-Volume ETF Cutline report. It tells you how close or far each of the 311 ETFs I follow is from its long-term trend line (39-week SMA). These are the ETFs that trade more than $5 million a day, so they are not some obscure funds that nobody cares about.

The report is split into two parts: The winners that are above their trend line (%M/A), and the losers that are below it. The yellow line is the line of shame that separates them. You can see how many ETFs are in each group and how they have changed since the last report (128 vs. 134 current).

Take a peek:

The HV ETF Master Cutline Report

If you are confused by some of the terms we use, don’t panic. I have a helpful Glossary of Terms for you.

If you want to learn more about the Cutline method and how it can make you rich (or at least less poor), read my original post here.