

- Moving the markets
The markets were like a roller coaster on Tuesday, as investors felt the heat from rising bond yields.
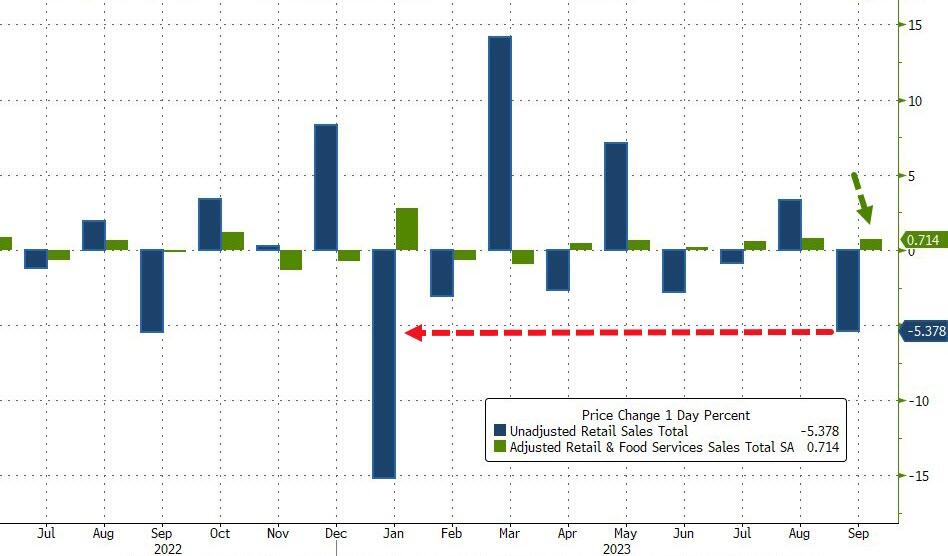
But they also got some relief from the third-quarter earnings season that kicked off with a bang. The 10-year U.S. Treasury yield soared to 4.84%, the highest since Oct. 6 — when it was a hair away from 4.9%. The reason? Retail sales data that came in hotter than a jalapeño, after plunging 5.4% in September.
Higher yields have been a thorn in the side of the market for weeks, as traders worry about the Fed tightening the screws for longer than expected. They also wonder how the Israel-Hamas war will affect the global economy.
It’s all about the bond market these days, as usual. The trend of higher yields, that started in July, is back with a vengeance after a brief pause. But there’s a silver lining: the 3rd quarter earnings season has been off to a good start, easing some of the traders’ fears. The question is: can that last, or will higher yields spoil the party?
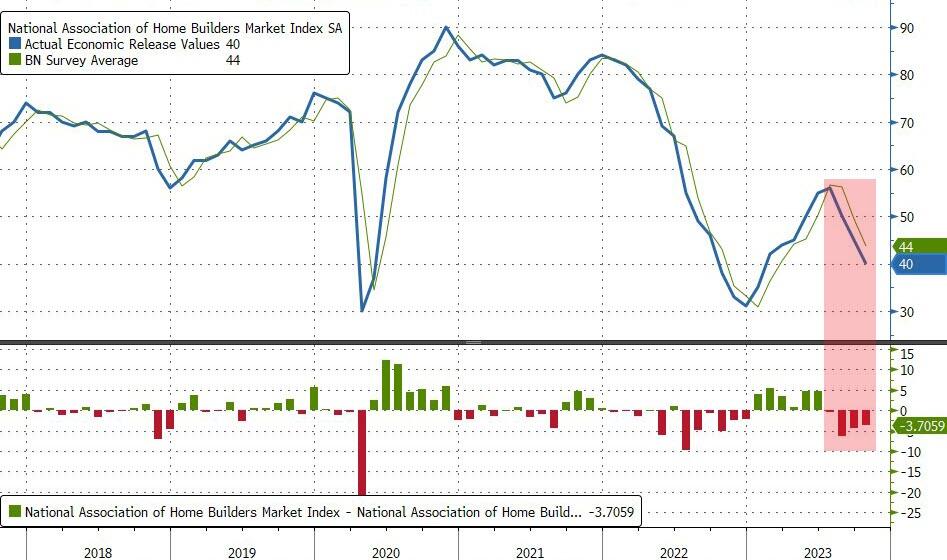
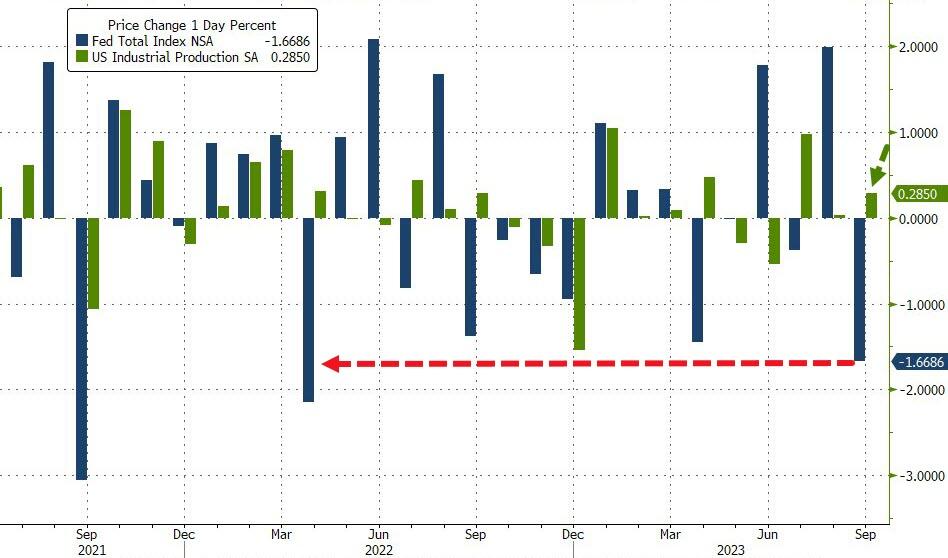
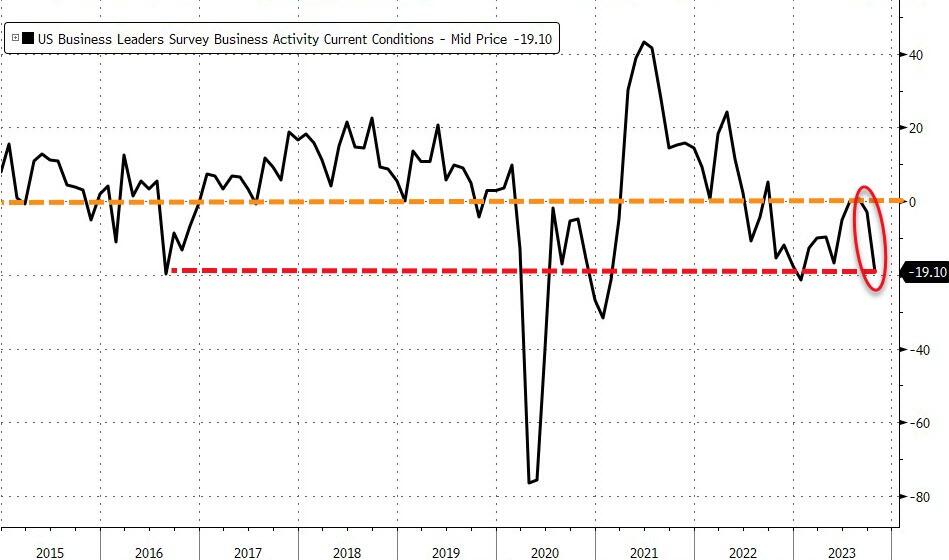
Homebuilder Sentiment took another dive, hitting a 9-month low, while US Manufacturing Production shrank YoY for the 7th month in a row. The Service sector also tanked in October, reaching its lowest level since January.
These headlines confirm what traders already think: the economy is going downhill, and the Fed needs to cut rates to save the day. But what if they don’t?
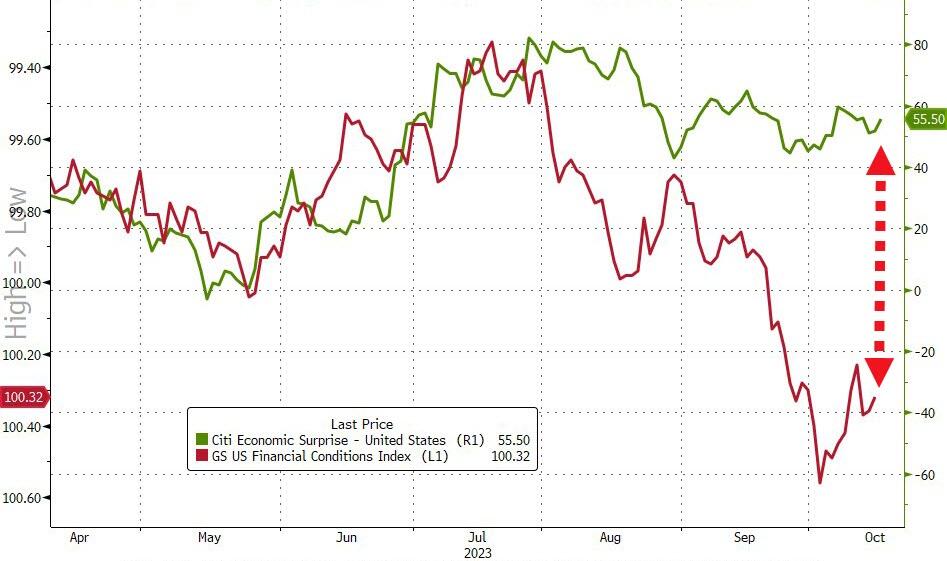
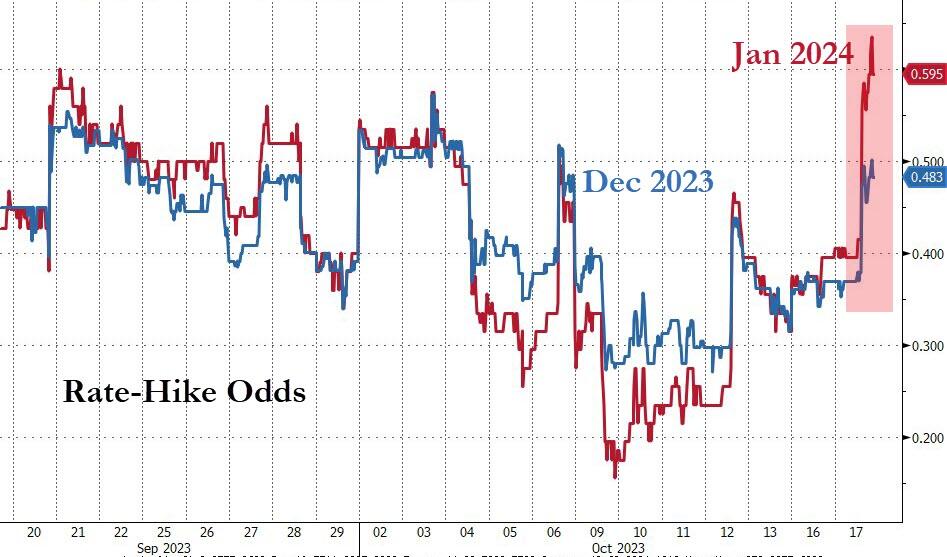
Financial conditions have gotten worse, with rate hike expectations rising, which is bad news for stocks. But traders seem oblivious to that, even though they saw another bond sell-off due to soaring yields.
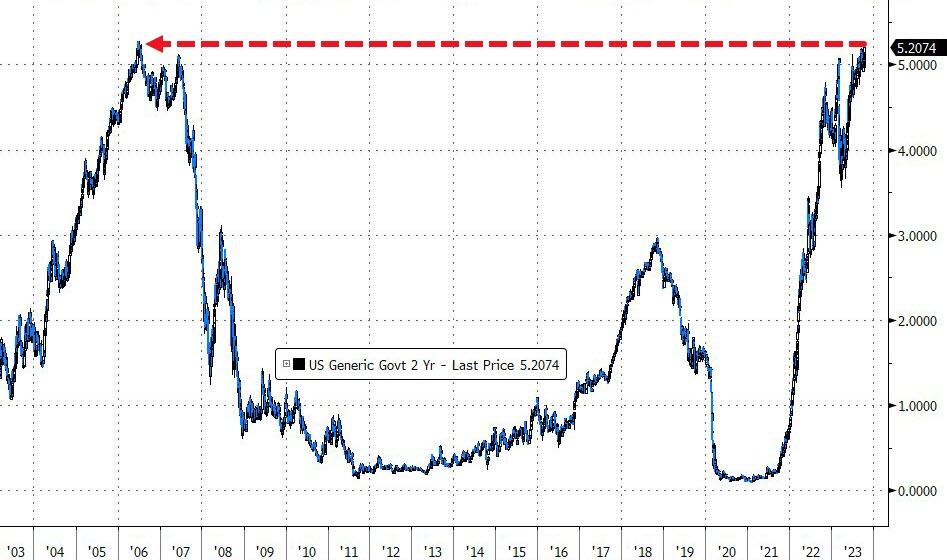
Just look at this: the 2-year yield hit 5.23% today, which is crazy considering the 2006 high was 5.275%. The last time it was higher than that was in December 2000, according to ZeroHedge.
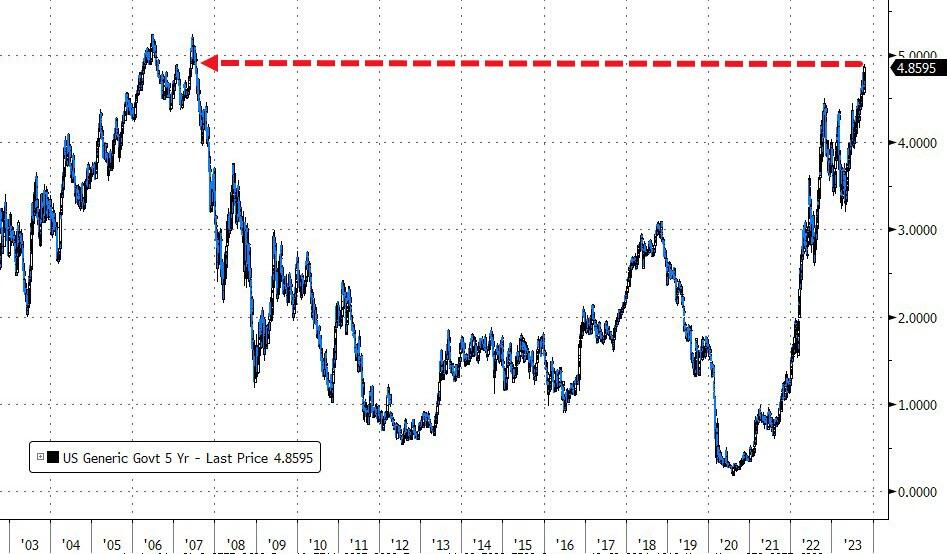
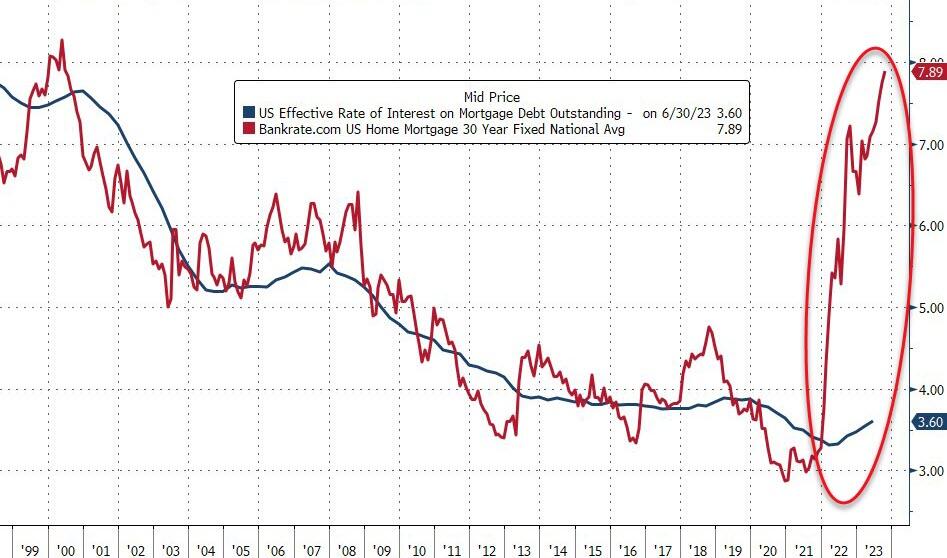
The same thing happened with the 5-year yield, which reached 4.88%, the highest since July 2007. Ouch! No wonder mortgage rates are creeping up to the 8% mark, the highest in more than 23 years.
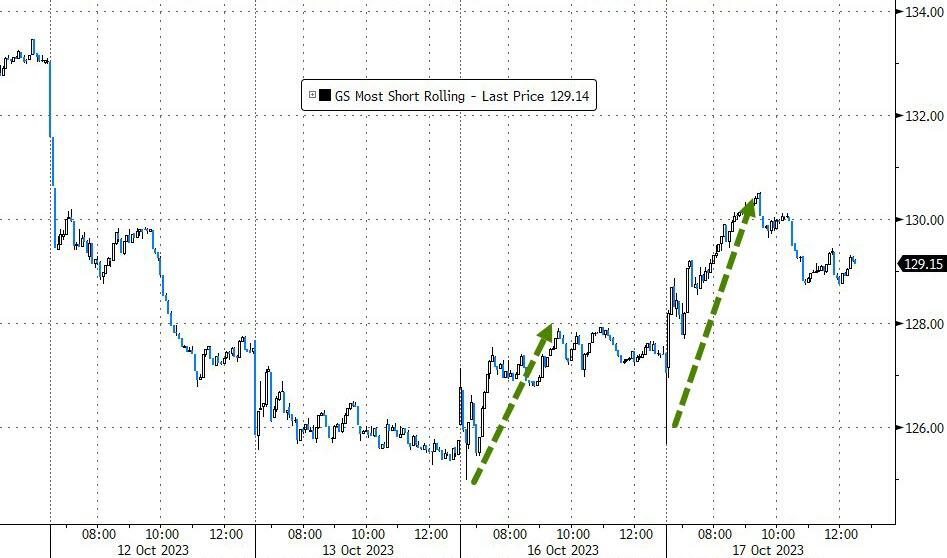
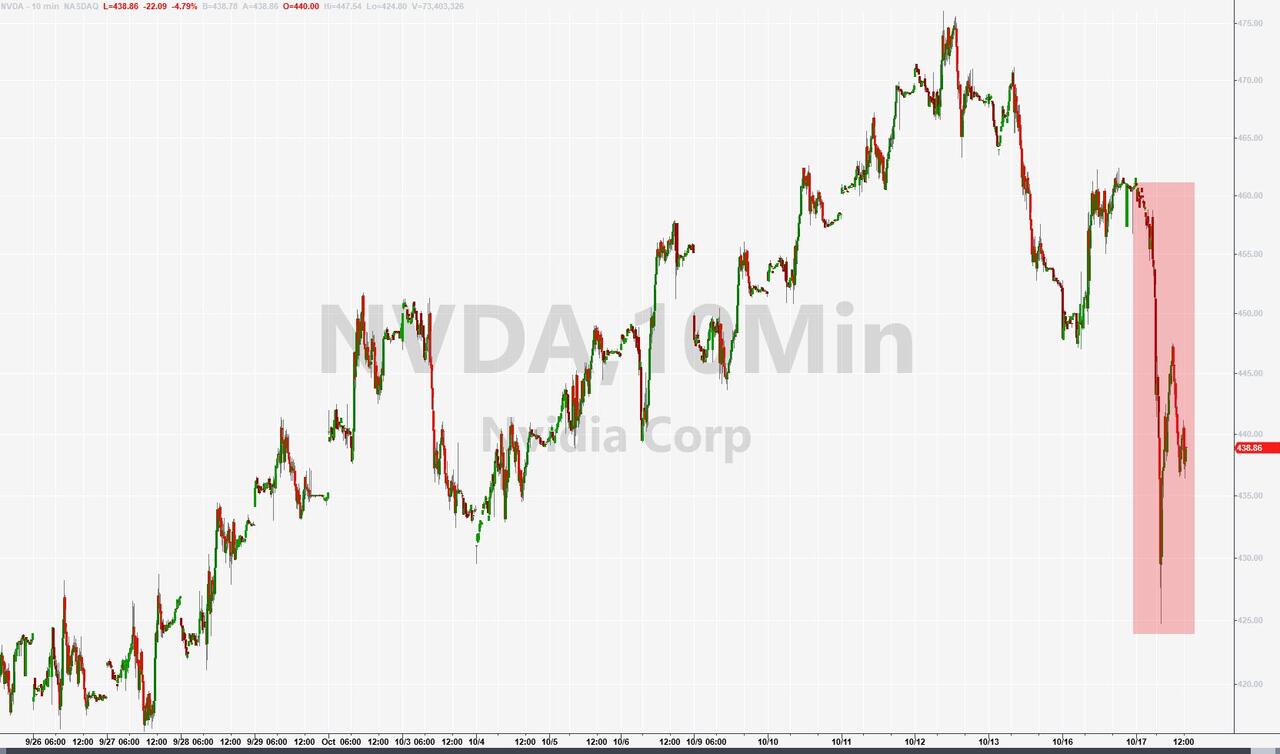
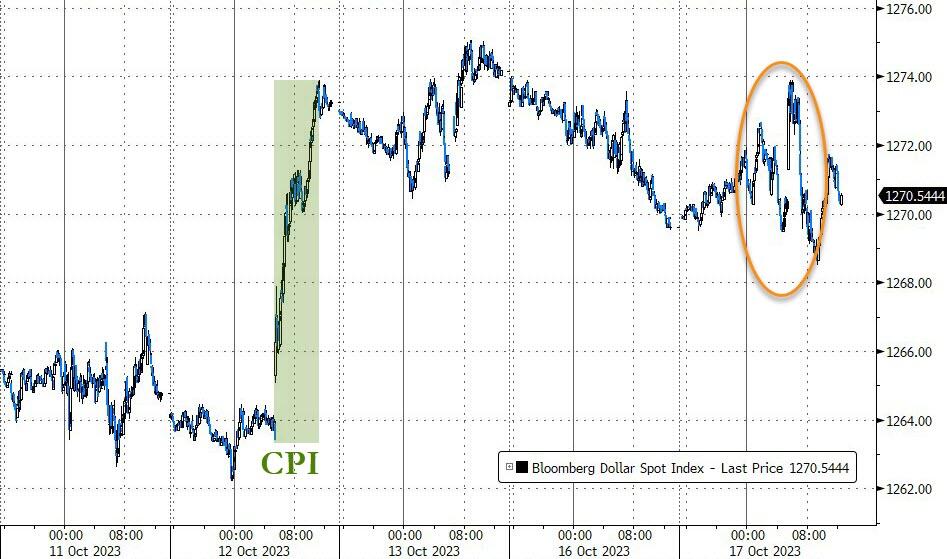
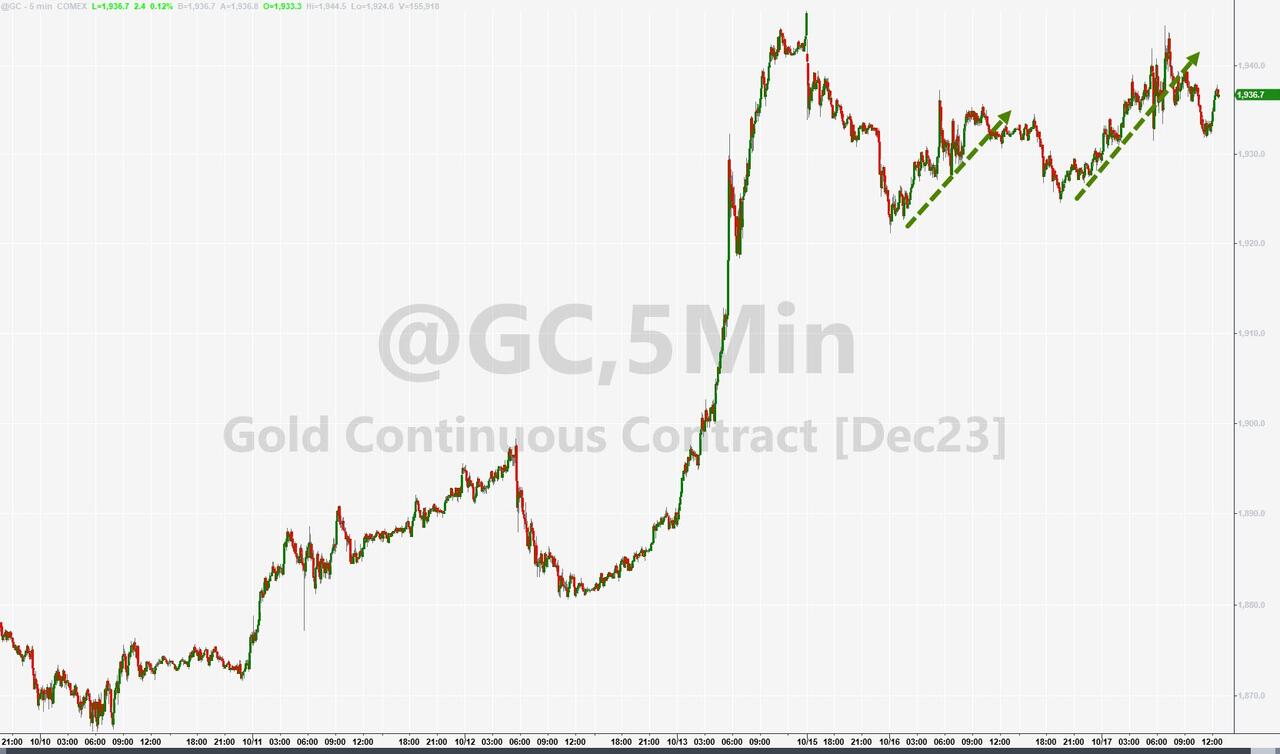
But thanks to another short squeeze, the S&P 500 managed to touch its resistance level, which matched its 50-day M/A. NVDA got hammered, the dollar ended flat, while gold moved sideways but closed slightly higher.
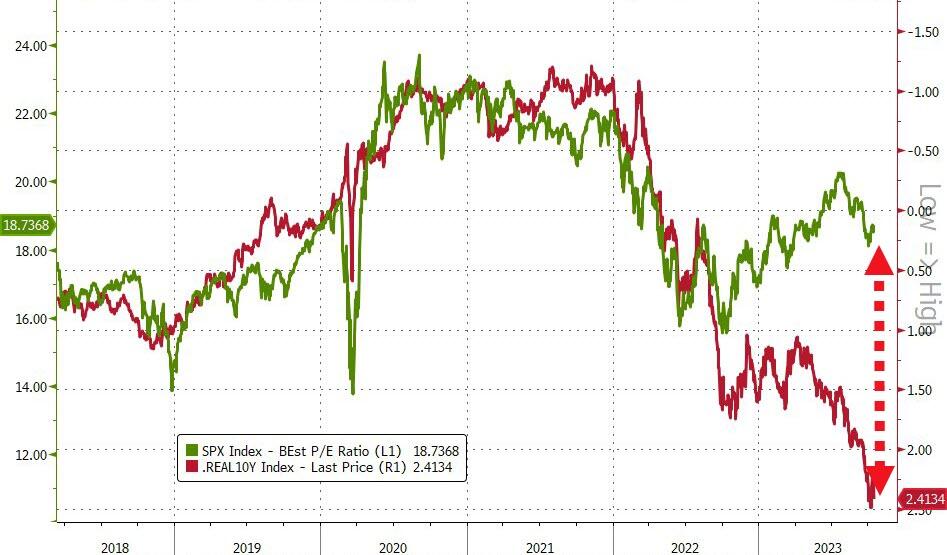
This makes me curious: how long can this gap between higher yields and rising stocks last? This chart has the answer, but we don’t know yet if it will be a snap down or a snap up.
2. “Buy” Cycle (12/1/22 to 9/21/2023)
The current Domestic Buy cycle began on December 1, 2022, and concluded on September 21, 2023, at which time we liquidated our holdings in “broadly diversified domestic ETFs and mutual funds”.
Our International TTI has now dipped firmly below its long-term trend line, thereby signaling the end of its current Buy cycle effective 10/3/23.
We have kept some selected sector funds. To make informed investment decisions based on your risk tolerance, you can refer to my Thursday StatSheet and Saturday’s “ETFs on the Cutline” report.
Considering the current turbulent times, it is prudent for conservative investors to remain in money market funds—not bond funds—on the sidelines.
3. Trend Tracking Indexes (TTIs)
The markets experienced a lot of volatility today as investors bought and sold equities quickly. However, the net change was minimal by the end of the day.
Our TTIs showed some improvement, but they still indicate a downward trend.
This is how we closed 10/17/2023:
Domestic TTI: -1.71% below its M/A (prior close –2.20%)—Sell signal effective 9/22/2023.
International TTI: -0.30% below its M/A (prior close -0.58%)—Sell signal effective 10/3/2023.
All linked charts above are courtesy of Bloomberg via ZeroHedge.
Contact Ulli