
ETF Tracker StatSheet
You can view the latest version here.
BOND YIELDS RISE TO 5%, STOCKS DROP TO NEW LOWS
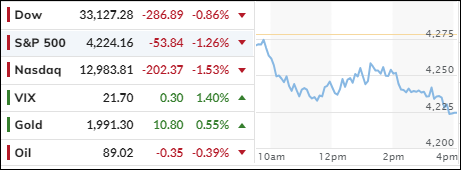
[Chart courtesy of MarketWatch.com]
- Moving the markets
Stocks got another slap in the face Friday, as traders freaked out over the 10-year Treasury yield flirting with 5%, a level that spells trouble for the economy and the stock market.
Higher yields mean higher borrowing costs for consumers and businesses, and more competition for stocks from bonds. The 10-year yield hit 5% for the first time since 2007 on Thursday and closed at 4.922% today. That’s like seeing your ex at a party with someone new.
The stock market is giving the side-eye to the bond market and doesn’t like what it sees. Yields are rising, even though inflation is officially not that bad. This is the main reason why stocks are weak and may get weaker.
The S&P 500, after bouncing back from its third-quarter slump, failed to break above its 50-day moving average, which functioned as a glass ceiling. It reversed course and fell below its 200-day moving average today by a hair, a sign of long-term weakness. If this continues, we may see stocks go down the drain.
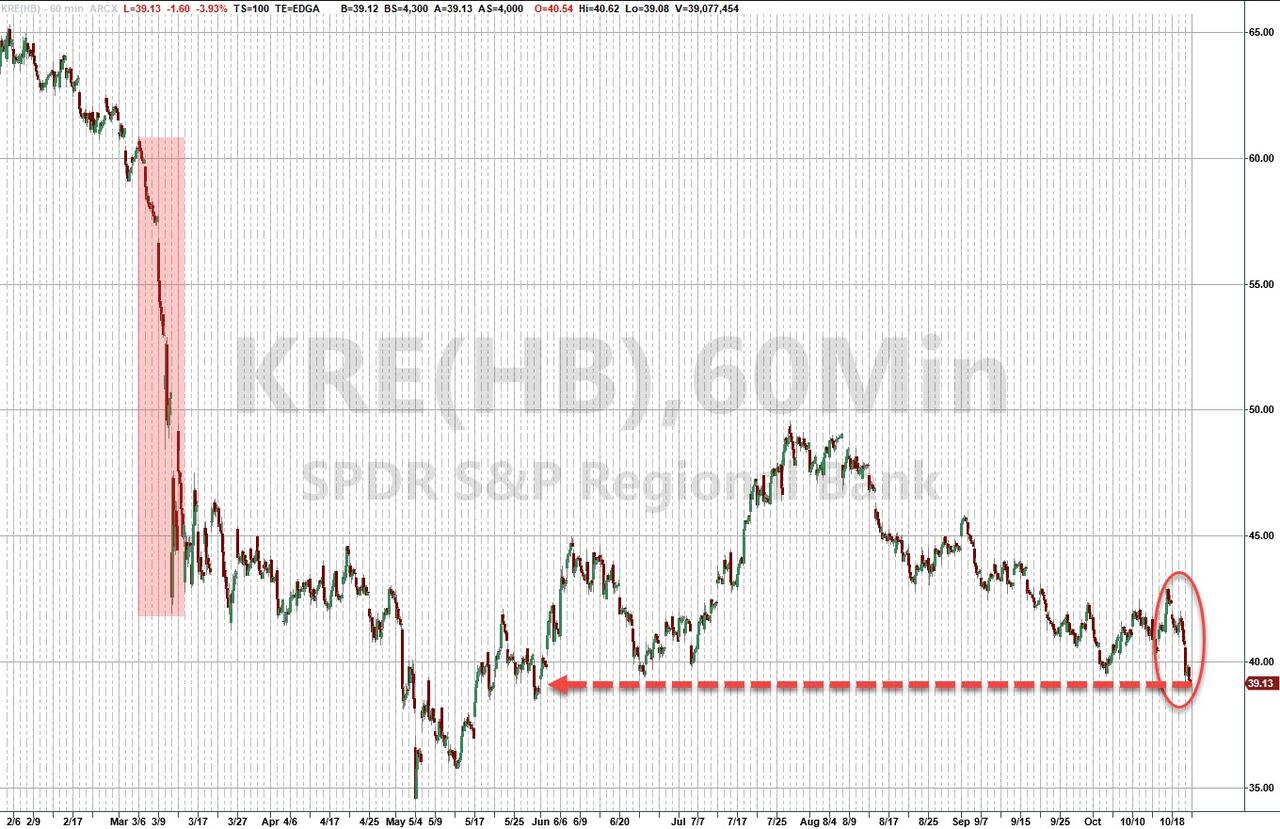
Regional banks also suffered in the session, with the regional banking ETF (KRE) dropping almost 2%. Adding insult to injury, Fed Chair Powell said yesterday that inflation is still too high, and the economy may need to slow down to tame it. Powell also said he thinks rates are not too high now.
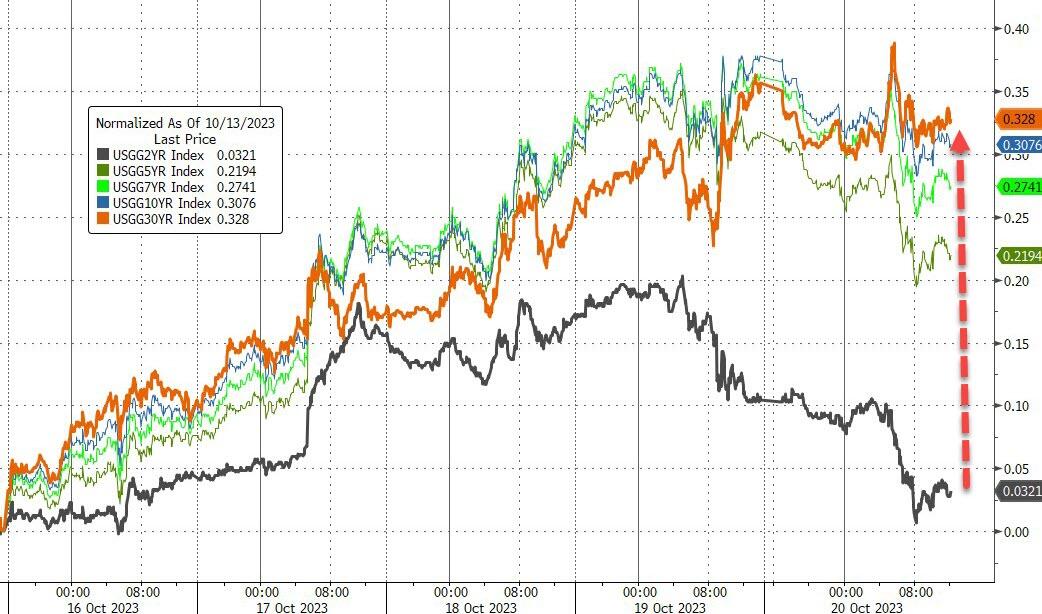
We saw some crazy moves in bond yields this week, with the 2-year yield rising only slightly while the 30-year yield soared. This means that we are moving from an inverted yield curve, which usually comes before recessions, to a steepening yield curve, which means that the recession may be closer than we think. History may not repeat itself, but it often rhymes.
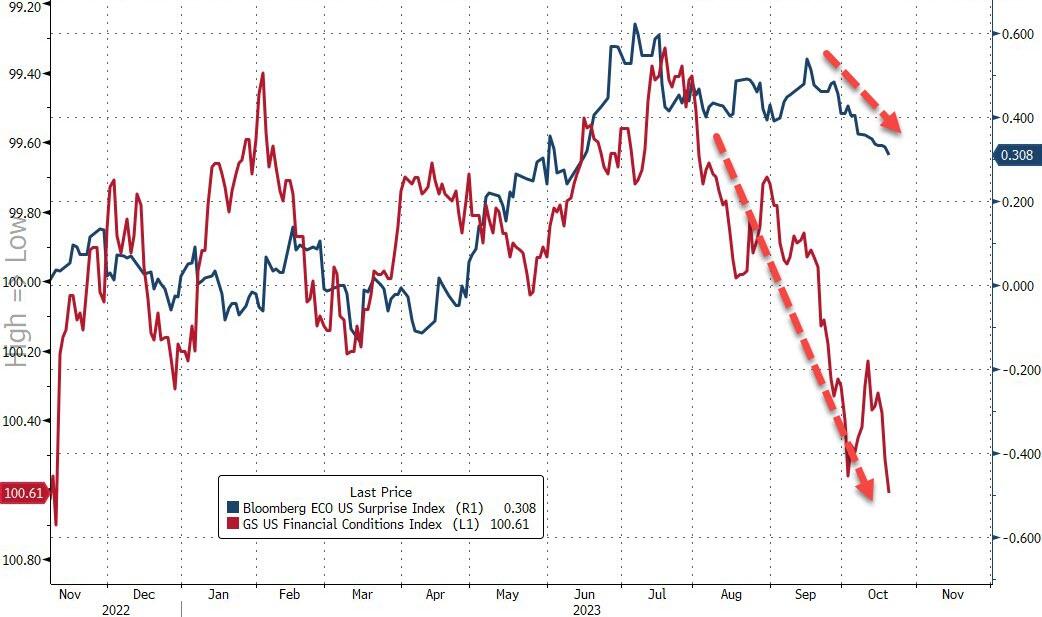
Also, financial conditions are getting tighter, as this chart shows, and this may drag down the economy.
None of this was good for stocks, and the major indexes plunged and closed at their lowest levels for the week. The Nasdaq took the biggest hit, losing 3%.
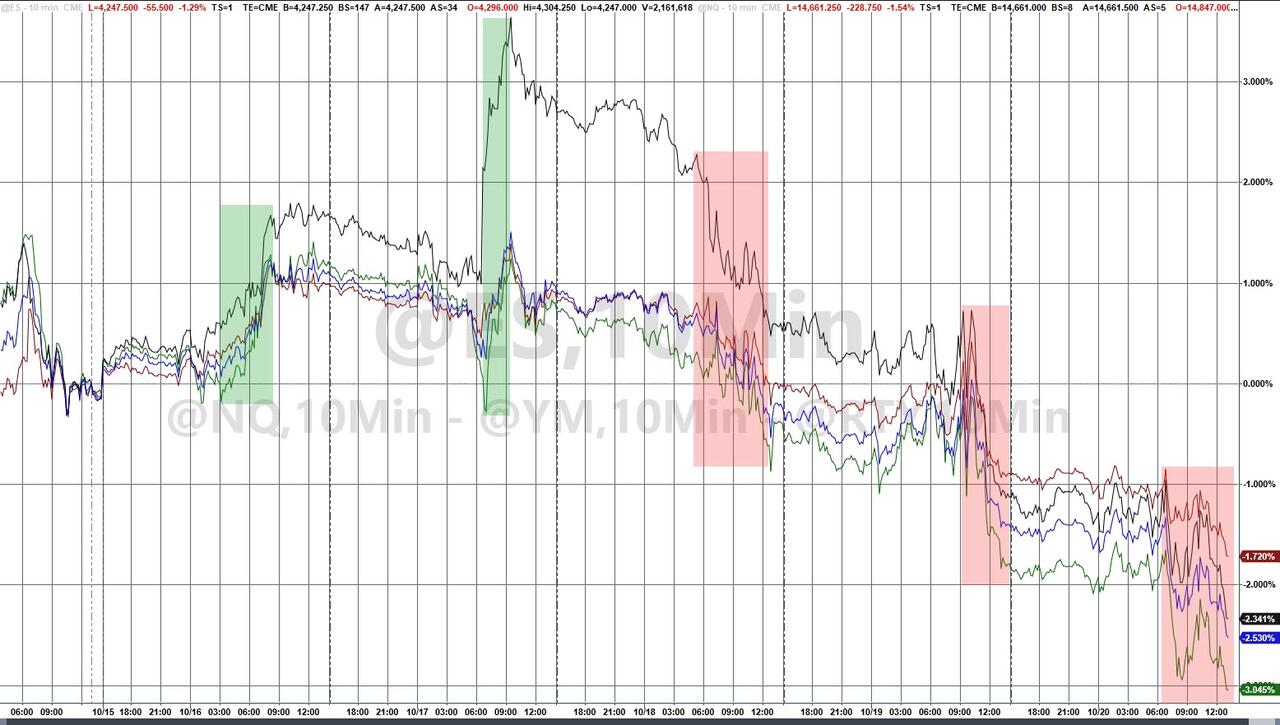
There were no signs of life from the short-squeeze crowd, and their hopes were dashed in October. Crude oil rallied all week but gave back some gains today.
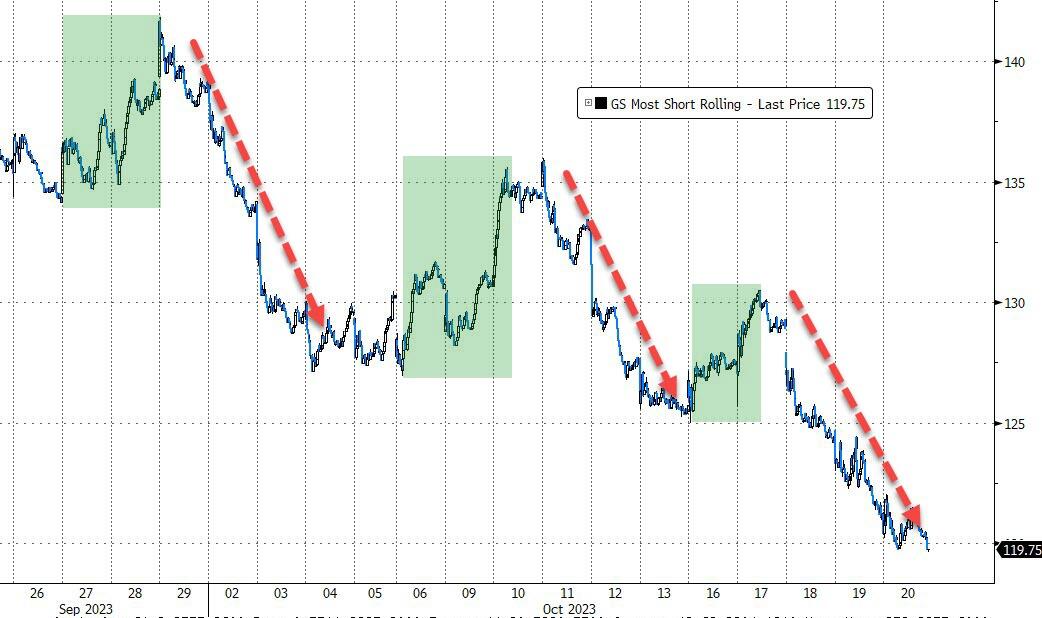
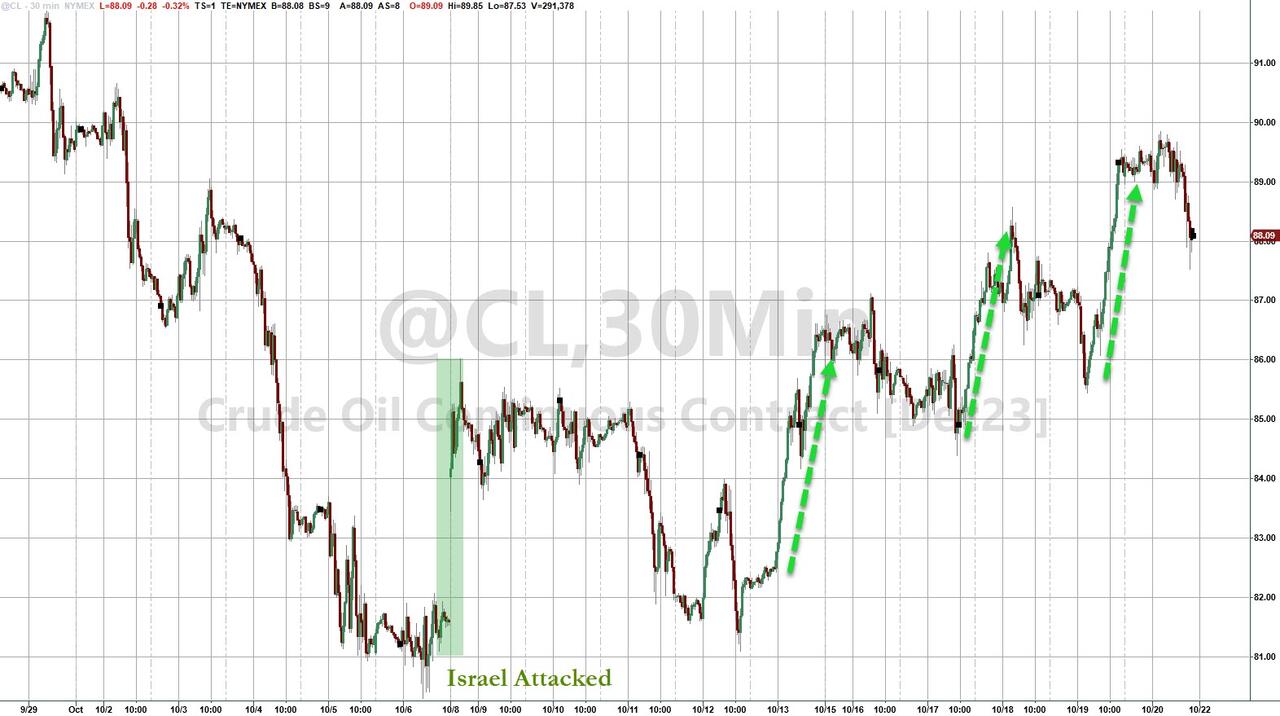
Gold was the star of the week, surging and almost reaching its $2k level. Are investors finally waking up to the fact that in times of stress, uncertainty, debt and deficits, precious metals are the ultimate safe haven?
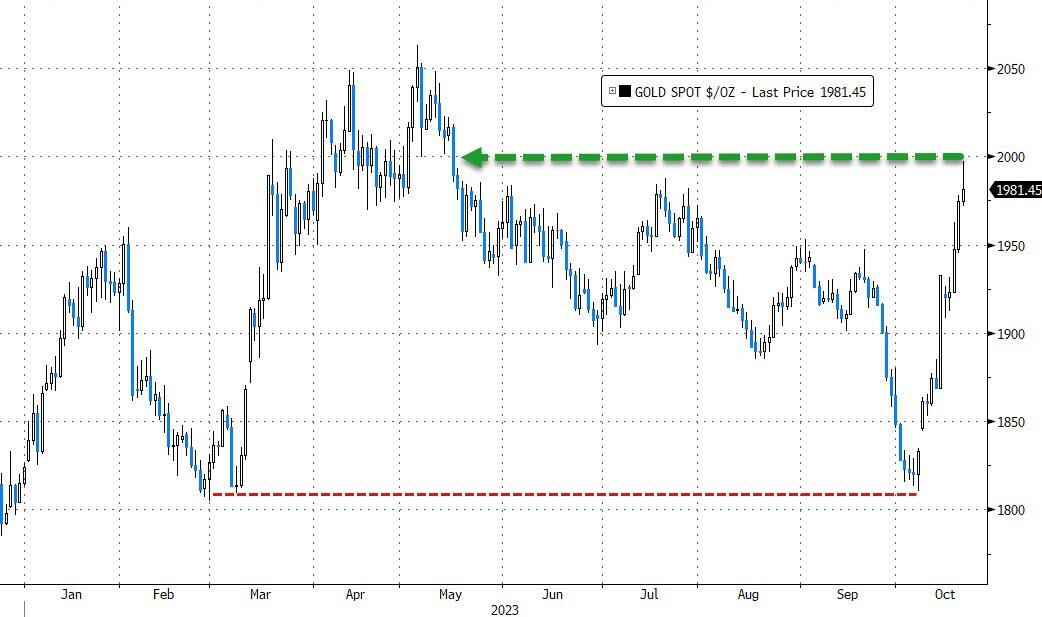
2. “Buy” Cycle (12/1/22 to 9/21/2023)
The current Domestic Buy cycle began on December 1, 2022, and concluded on September 21, 2023, at which time we liquidated our holdings in “broadly diversified domestic ETFs and mutual funds”.
Our International TTI has now dipped firmly below its long-term trend line, thereby signaling the end of its current Buy cycle effective 10/3/23.
We have kept some selected sector funds. To make informed investment decisions based on your risk tolerance, you can refer to my Thursday StatSheet and Saturday’s “ETFs on the Cutline” report.
Considering the current turbulent times, it is prudent for conservative investors to remain in money market funds—not bond funds—on the sidelines.
3. Trend Tracking Indexes (TTIs)
The bond market continued to weigh on the stock market, as the 10-year bond yield stayed close to 5%, a level that many investors consider risky. The high yield discouraged buyers from entering the equity market, and the S&P weighed on the stock market, as it did not hold above its 200-day moving average, a key indicator of the long-term trend.
The overall mood was negative, and our Trend Tracking Indexes (TTIs) moved further below their trend lines, confirming that the bearish trend is still dominant for stocks. Only a few sectors showed some strength, such as precious metals and energy.
This is how we closed 10/20/2023:
Domestic TTI: -5.52% below its M/A (prior close –4.47%)—Sell signal effective 9/22/2023.
International TTI: -3.06% below its M/A (prior close -2.11%)—Sell signal effective 10/3/2023.
All linked charts above are courtesy of Bloomberg via ZeroHedge.
———————————————————-
WOULD YOU LIKE TO HAVE YOUR INVESTMENTS PROFESSIONALLY MANAGED?
Do you have the time to follow our investment plans yourself? If you are a busy professional who would like to have his portfolio managed using our methodology, please contact me directly to get more details.
Contact Ulli