ETF Tracker Newsletter For February 10, 2023

Ulli ETF Tracker Contact

ETF Tracker StatSheet          

You can view the latest version here.
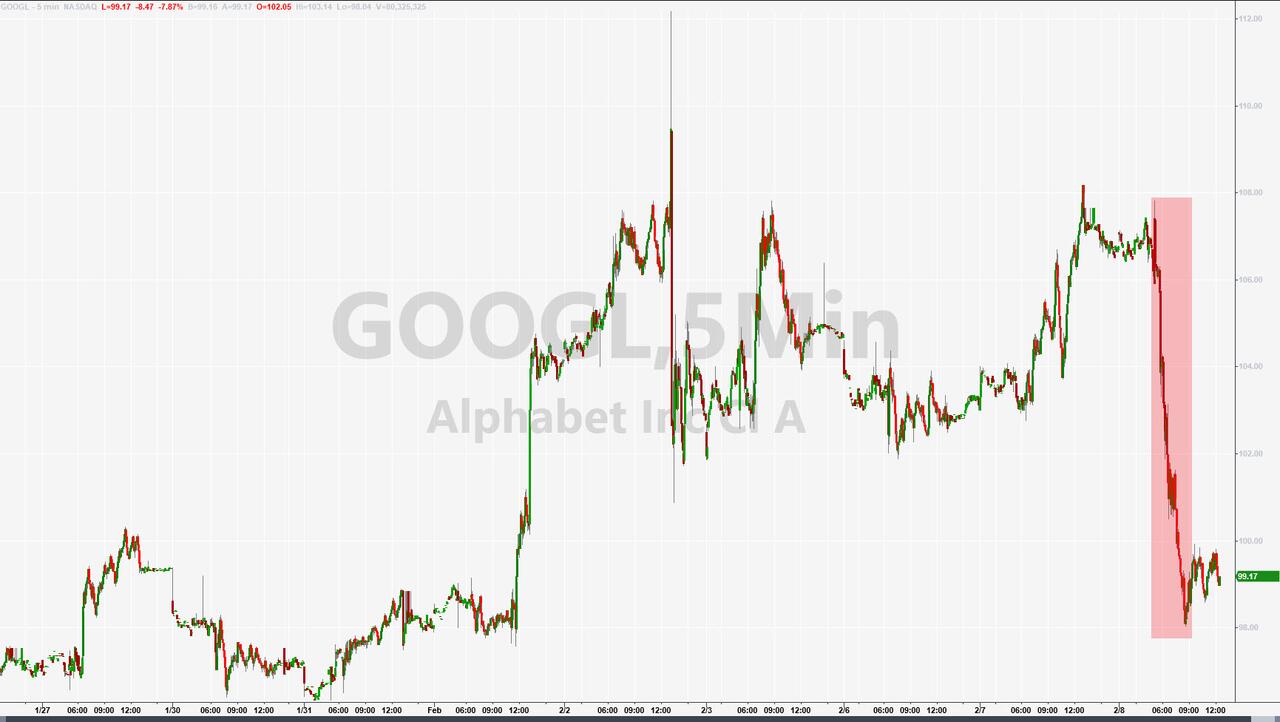
GOING NOWHERE

[Chart courtesy of MarketWatch.com]

  1. Moving the markets

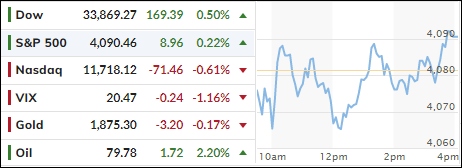
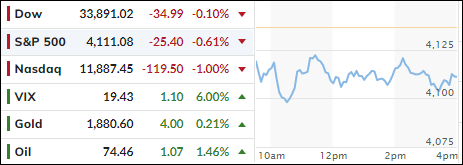
After yesterday’s Puke-A-Thon, the markets tried to find some footing but, while the Dow and S&P 500 managed to eke out a moderate last hour gain, the Nasdaq ended the session in the red.

Alternating between gains and losses, the major indexes closed the week in the red, with the S&P scoring its worst week since December and its first decline in 3 weeks.

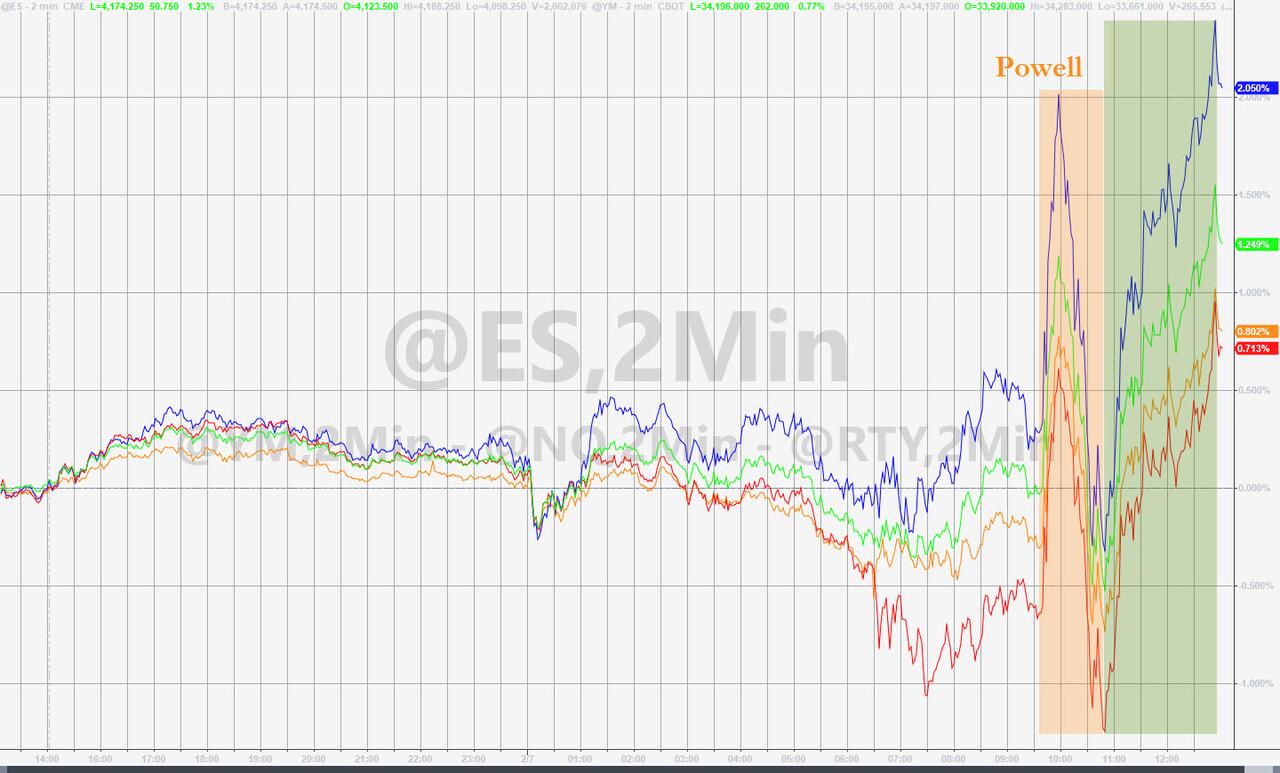
Trying to digest not only the Fed’s hawkish commentary on interest rates, but also the words spewed by various Fed mouth pieces, which all sang from the same hymn sheet, left traders uncertain as whether their dovish conviction will really hold up in the future.

To my way of thinking, the signals from the Fed were very clear, and not mixed at all, yet traders and algos alike were simply not convinced that Powell will be firm in his conviction that there would be no rate hikes this year. This left Wall Street in a state of confusion, which markets hate, hence the increase in volatility.

Not helping bullish sentiment was the latest report pointing to an underwhelming earnings season. About 70% of S&P companies have reported and 70% of those beat analysts’ expectations, which is a drop from the historical average of 79%.  

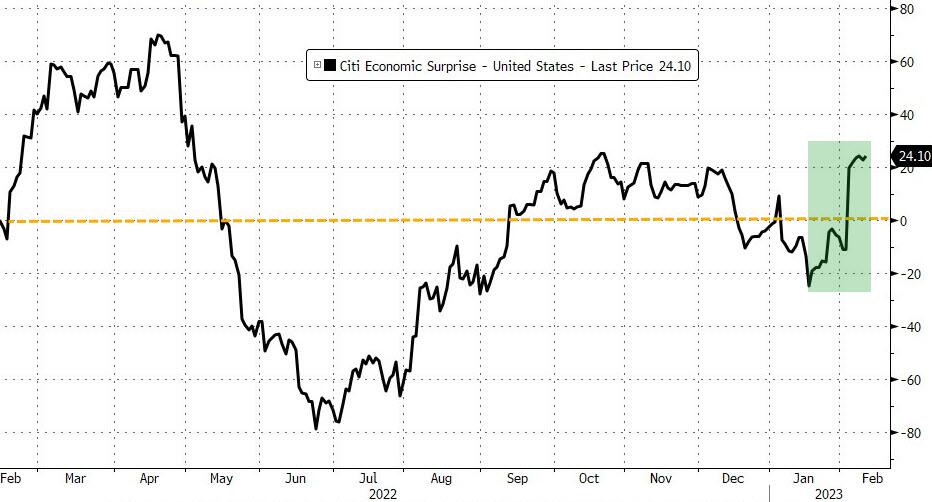
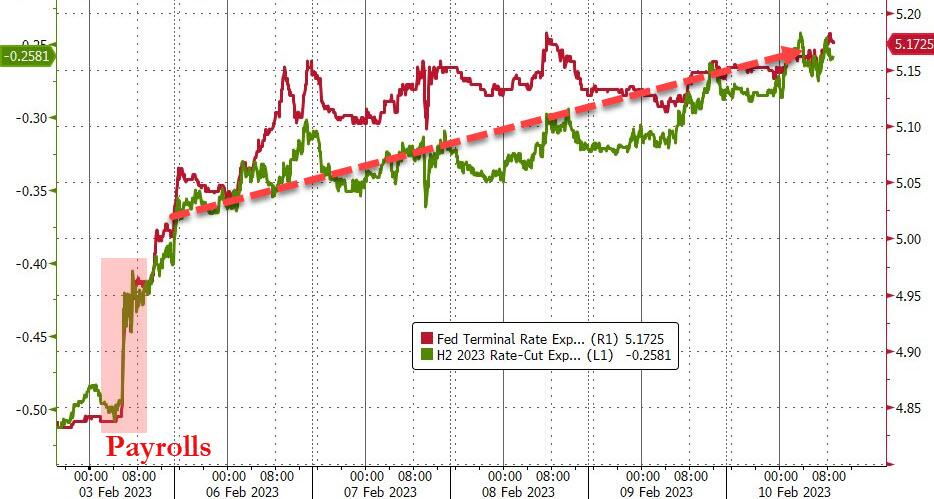
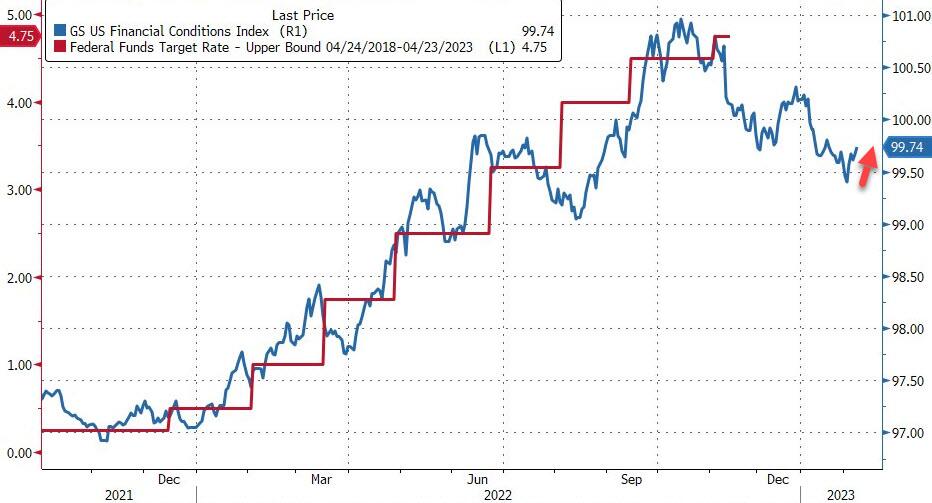
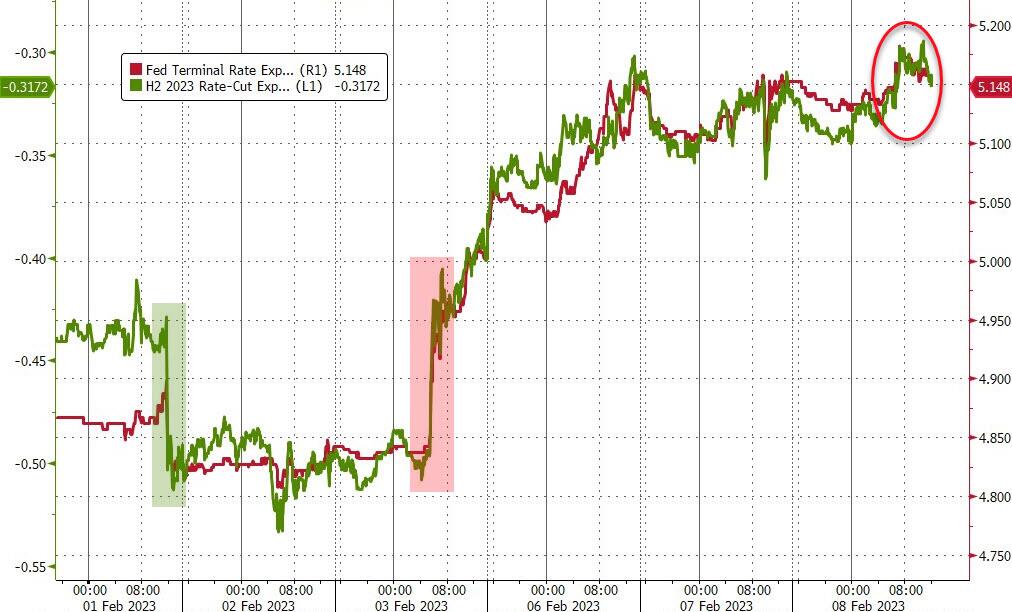
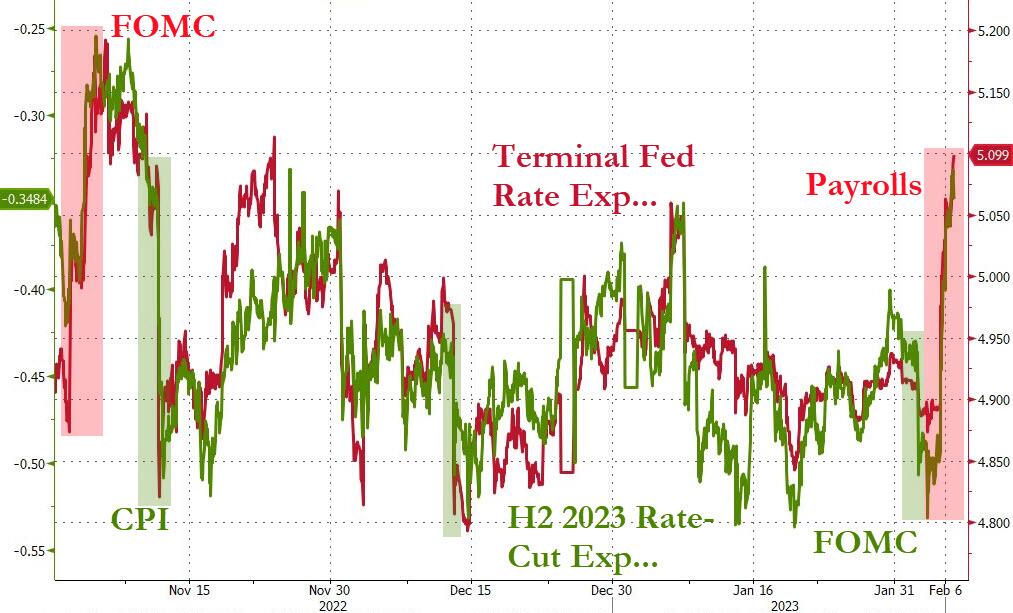
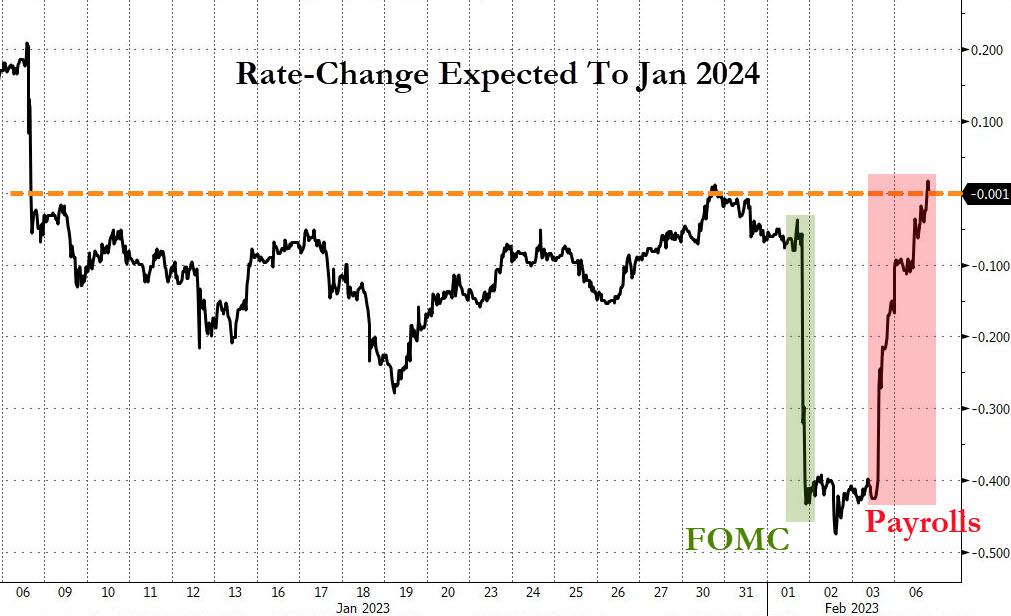
ZeroHedge called it a crash of the “Fed Pivot Party,” as some data points like the Citi Economic Surprise Index rallied unexpectedly, and the Fed’s rate hike trajectory turned decidedly more hawkish, both of which created pain for stocks and bonds this week.

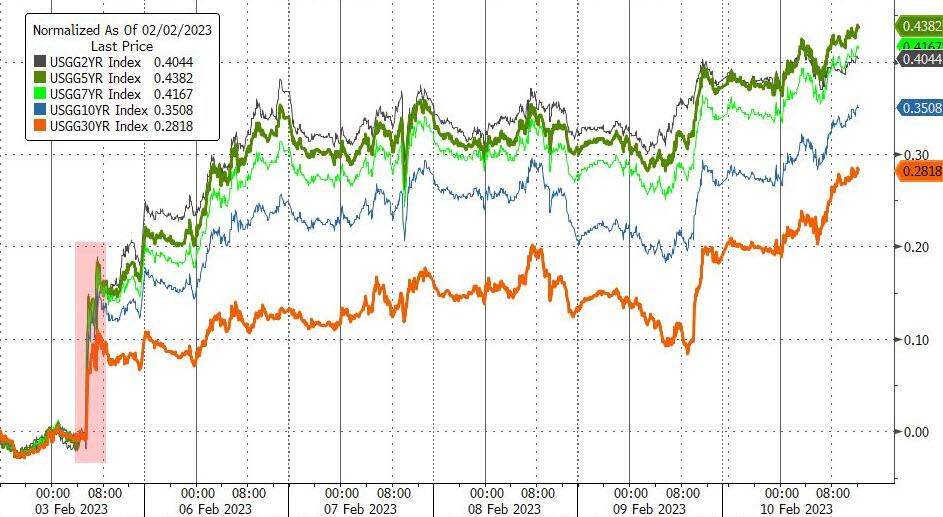
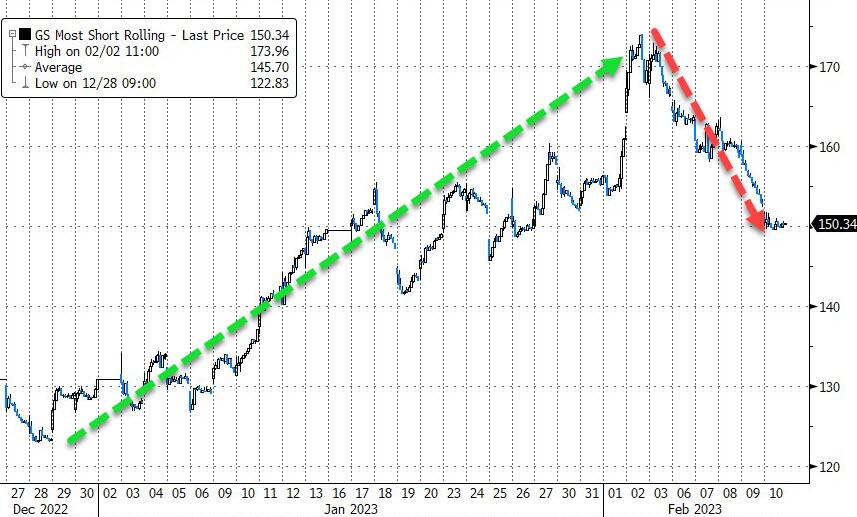
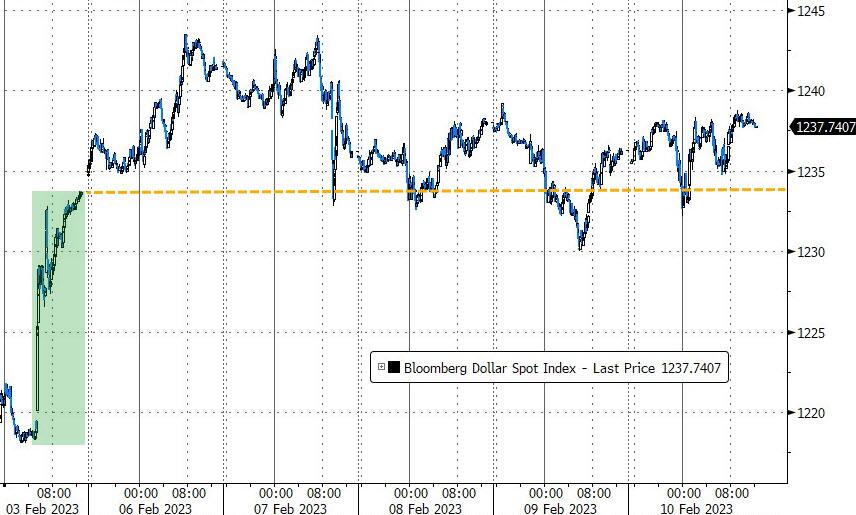
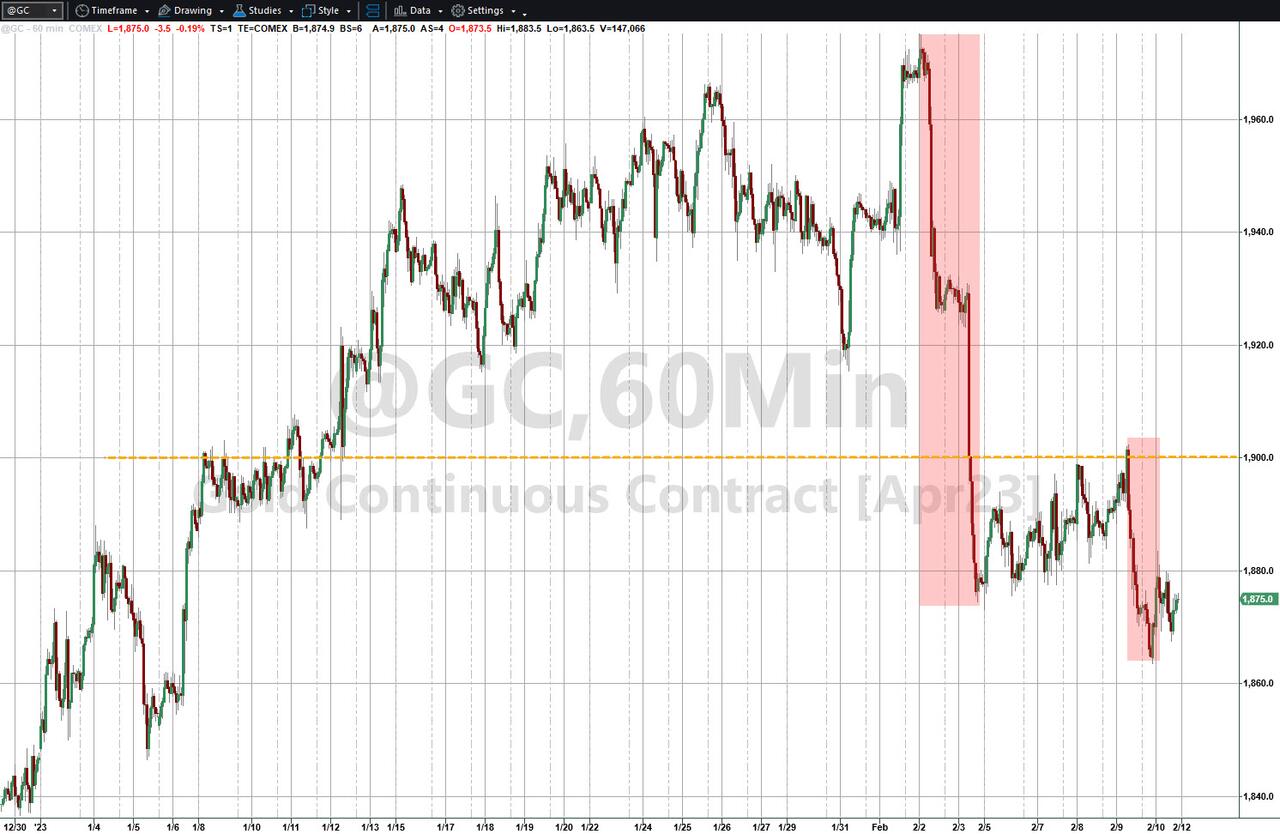
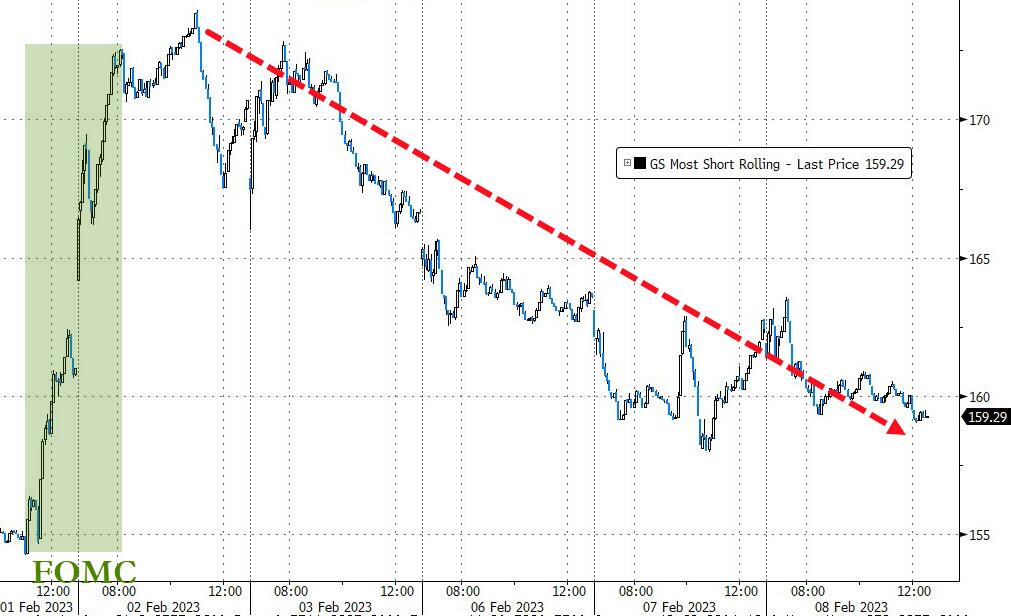
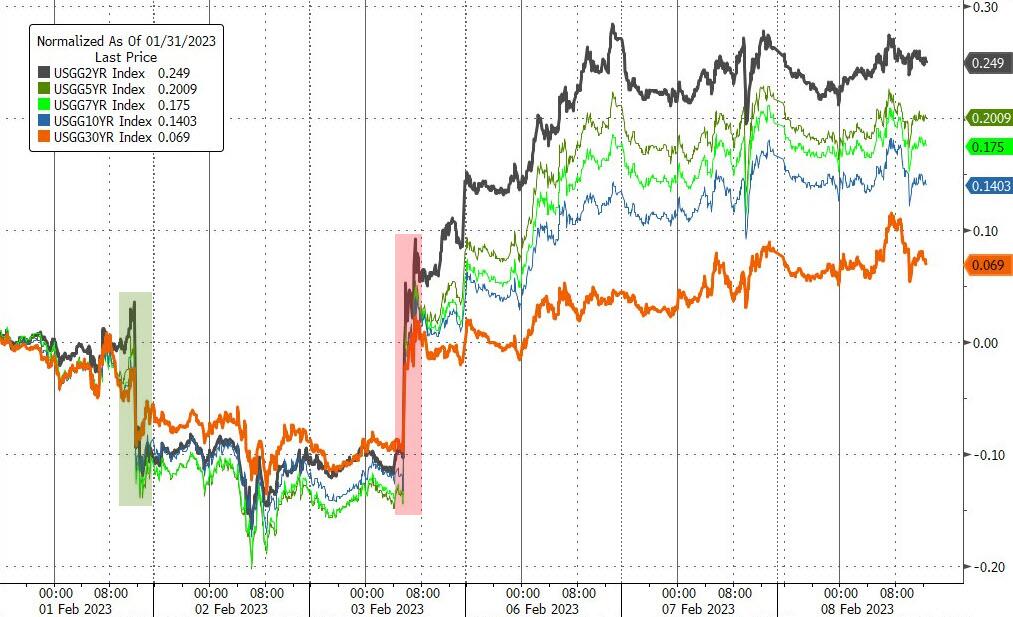
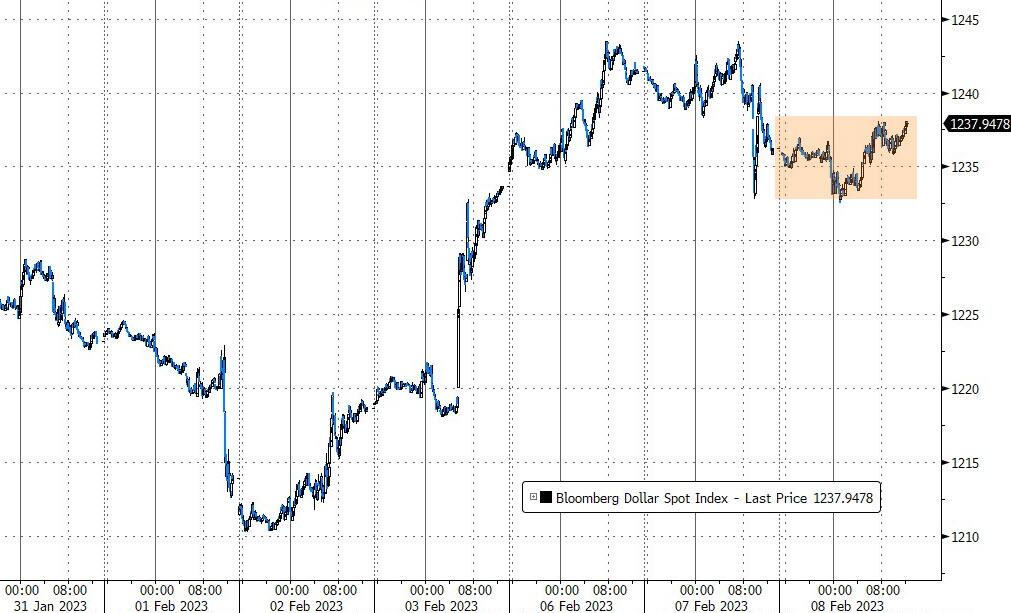
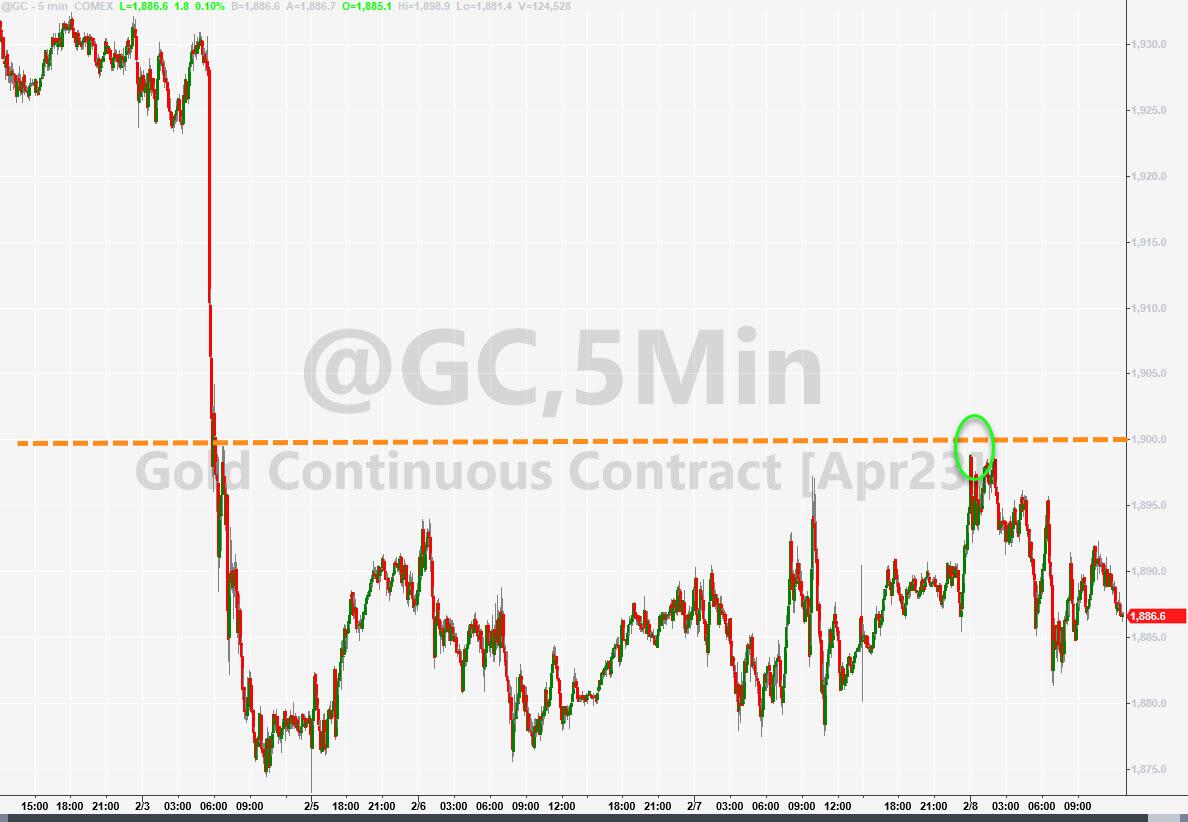
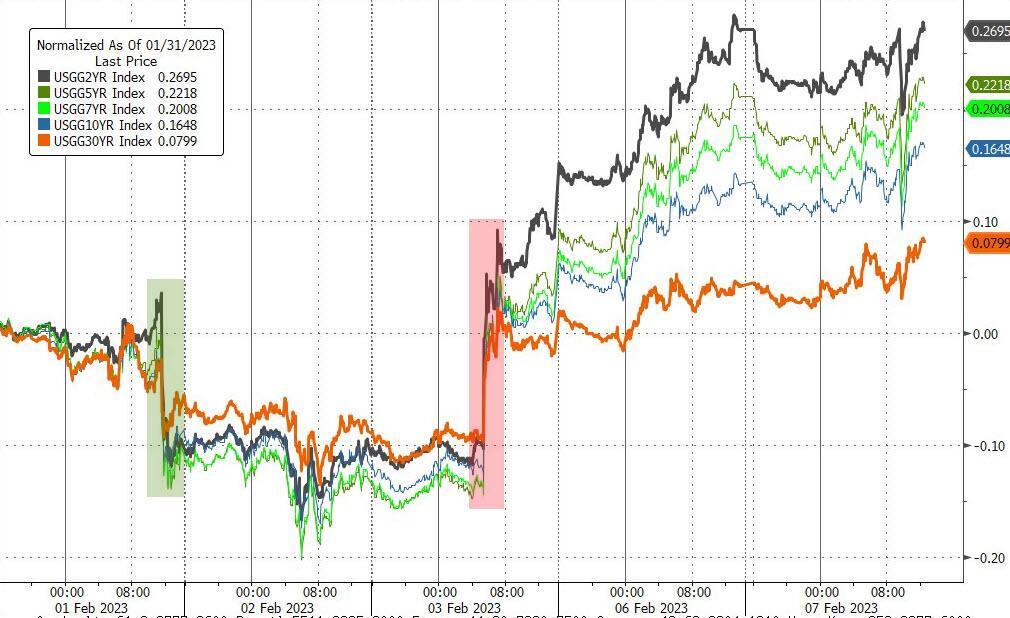
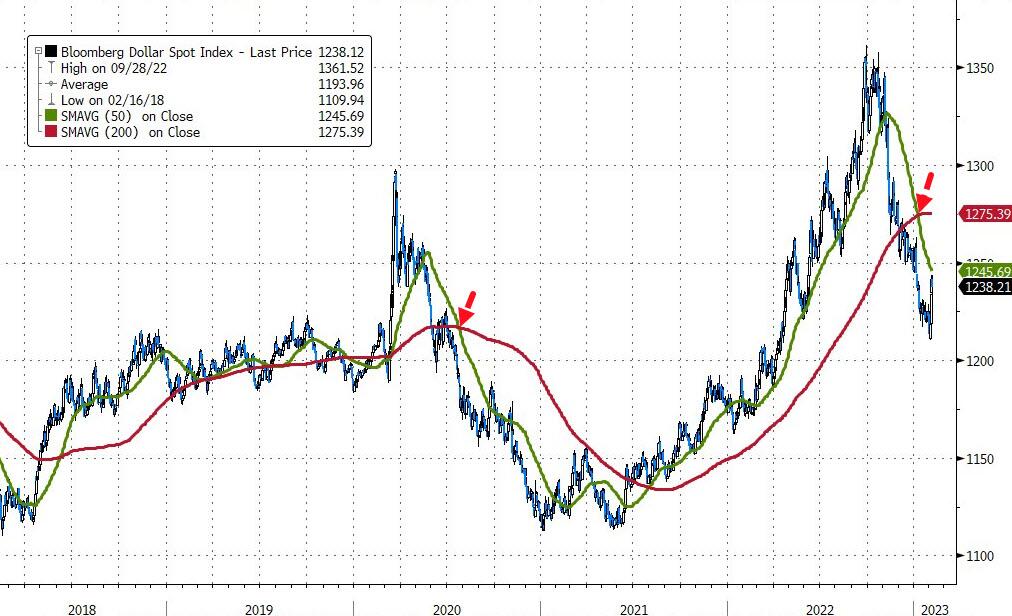
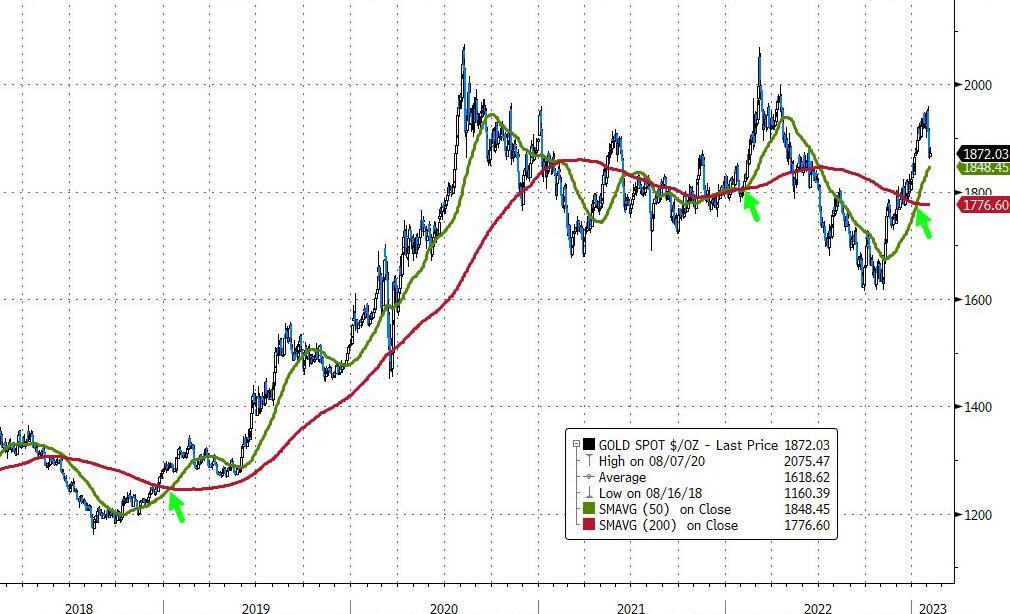
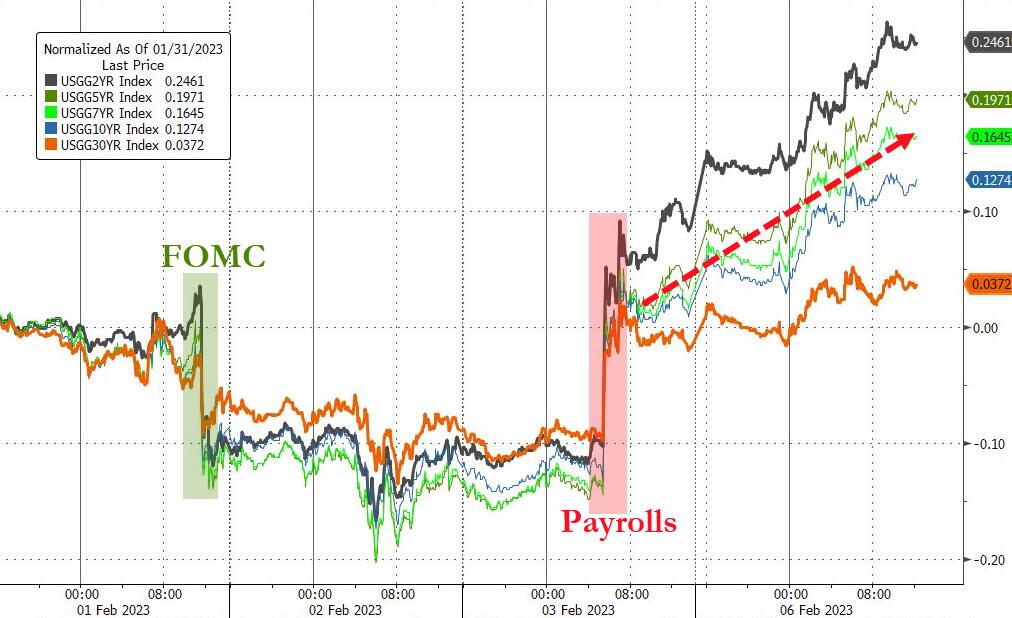
Bond yields ratcheted higher, as financial conditions tightened, causing the most shorted stocks a much needed reversal and helped the US Dollar to climb moderately for the week. Given those facts, it comes as no surprise that Gold suffered by giving up its $1,900 level.    

Next week looks like more volatility is on the horizon, with the much-awaited CPI lurking on deck followed by Friday’s options expirations event.

Read More

Weekly StatSheet For The ETF Tracker Newsletter – Updated Through 02/09/2023

Ulli ETF StatSheet Contact

ETF Data updated through Thursday, February 9, 2023

Methodology/Use of this StatSheet:

1. From the universe of over 1,800 ETFs, I have selected only those with a trading volume of over $5 million per day (HV ETFs), so that liquidity and a small bid/ask spread are assured.

2. Trend Tracking Indexes (TTIs)

Buy or Sell decisions for Domestic and International ETFs (section 1 and 2), are made based on the respective TTI and its position either above or below its long-term M/A (Moving Average). A crossing of the trend line from below accompanied by some staying power above constitutes a “Buy” signal. Conversely, a clear break below the line constitutes a “Sell” signal. Additionally, I use a 12% trailing stop loss on all positions in these categories to control downside risk.

3. All other investment arenas do not have a TTI and should be traded based on the position of the individual ETF relative to its own respective trend line (%M/A). That’s why those signals are referred to as a “Selective Buy.” In other words, if an ETF crosses its own trendline to the upside, a “Buy” signal is generated. Here too, I recommend trailing sell stop of 12%, or less, depending on your risk tolerance.

If you are unfamiliar with some of the terminology, please see Glossary of Terms and new subscriber information in section 9.     

1. DOMESTIC EQUITY ETFs: BUY — since 12/01/2022

Click on chart to enlarge

Our main directional indicator, the Domestic Trend Tracking Index (TTI-green line in the above chart) has reclaimed its long-term trend line (red) by +6.78% and remains in “Buy” mode for the time being.

Read More

Pondering A Subpar Earnings Season And Future Fed Moves

Ulli Market Commentary Contact

[Chart courtesy of MarketWatch.com]

  1. Moving the markets

Traders were stuck in limbo today trying to assess future monetary policy, the current earnings season, which was subpar at best, and the profit outlook for the remainder of 2023.

None of the above deliberations created much motivation by the bulls to drive this market higher, so the path of least resistance was down, with the S&P 500 surrendering some -1.11%.

Company guidance took center stage, as data provider Refinitiv announced that 42 companies in the S&P 500 have issued negative earnings guidance, 8 have posted positive numbers, while many others have not changed their forecast or issued any to begin with.

Alphabet stock took it on the chin this morning by tumbling more than 7%, as competition in the Artificial Intelligence space has heated up thereby limiting the first mover advantage.

However, capping any potential bullish sentiment were a few Fed mouthpieces, who uttered market unfriendly comments like the ones I have repeatedly mentioned: “More work to do, higher for longer, no rate cuts this year.” As a result, terminal rate expectations surged and have now reached a new cycle high of 5.18%, as per ZeroHedge.

Most shorted stocks reversed from last week’s Ramp-A-Thon and did what they are supposed to, namely head south, and bite the dust, which is what we saw over the past 3 trading days.

Bond yields went sideways, the US Dollar eked out a tiny gain, while Gold kissed the $1,900 level briefly but was not able to hold on. Still, the precious metal gained a tad.

The tug-of-war with the Fed continues, but I think next week’s eagerly awaited CPI report may shed some light on the future direction of the markets.

Read More

Whipsawing Higher On “Transitory Disinflation”

Ulli Market Commentary Contact

[Chart courtesy of MarketWatch.com]

  1. Moving the markets

As the chart above shows, pumping, dumping, and pumping was the theme of the day, as traders tried to incorporate Powell’s “transitionary disinflation” in their vocabulary, while assessing if it would produce a bullish or bearish outcome.

Judging by the ramp into the close, the current picture is positive for equities, but traders and algos alike had to sort through seemingly opposing statements during his latest speech.

Here are some of the highlights:

  • …disinflation has barely begun and there’s still a long way to go…
  • …financial conditions have tightened.
  • …more rate hikes are likely to be needed. This process is likely to take quite a bit of time…
  • My guess is it will take certainly into not just this year but next year, to get to 2%.
  • The reality is if we continue to get strong labor market reports or higher inflation reports, it might be the case that we have to raise rates more than is now expected.

Yet, all Wall Street heard was “disinflation,” and off to the races we went. Never mind that he did not mention any pause or pivot in his speech, and he even stretched the timing of his projected outcome into next year.

Bloomberg’s Ira Jersey viewed market reaction with a sense of reality:

“The market (could it be algos?) again seems to take the word ‘disinflation’ and give it a greater significance than it should have.

But “the caveat of ‘early’ in the process just solidifies my view that the Fed won’t be cutting this year, which is different than the market is pricing.”

I agree with his more hawkish assessment, and that today’s euphoric reaction does not sync up with reality. However, bond yields were mixed, as the US Dollar tumbled, and triggered a ‘Death Cross,” which helped Gold to inch closer to it’s $1,900 level.

The precious metal has now triggered a golden cross, which means its 50-day M/A has crossed above its 200-day M/A, a very bullish sign.

Read More

Higher Rates Unsettle Markets

Ulli Market Commentary Contact

[Chart courtesy of MarketWatch.com]

  1. Moving the markets

Bond yields jumped sharply with the 10-year adding some 24-basis points to end the session at 3.64%. The markets vacillated predominantly below the unchanged lines, but the major indexes managed to close off their intra-day lows. Still, rate hike expectations have exploded, as the hawkish theme remains to be the dominant one.  

Uncertainty reigned, as traders were still shaken up from Friday’s jobs report, which indicated anything but a recession. That brought into question whether the Fed is truly motivated to pause hiking rated—let alone pivot—both firmly held assumptions which formed the basis of the recent rally, the continuation of which has now become questionable.

Earnings continue to be in focus, but so far profits for S&P 500 companies are on pace to be 2.7% lower than Q4 2022, according to data provider Refinitiv. That means the tug-of-war between earnings and hawkish Fed policy continues, with all players now eagerly awaiting Powell’ speech tomorrow at the Economic Club of Washington.

The US Dollar bounced for its 3rd straight day, helped by a jump in bond yields, while Gold held on to slight gains, an impressive performance in light of the dollar’s advance.

Trader’s will anxiously dissect Powell’s speech tomorrow for any indication that would clarify whether hawkishness will be the monetary direction for the foreseeable future. If so, the bullish crowd may have to rethink their reckless exuberance.

Read More

ETFs On The Cutline – Updated Through 02/03/2023

Ulli ETFs on the Cutline Contact

Below, please find the latest High-Volume ETF Cutline report, which shows how far above or below their respective long-term trend lines (39-week SMA) my currently tracked ETFs are positioned.

This report covers the HV ETF Master List from Thursday’s StatSheet and includes 312 High Volume ETFs, defined as those with an average daily volume of more than $5 million, of which currently 256 (last report: 255) are hovering in bullish territory. The yellow line separates those ETFs that are positioned above their trend line (%M/A) from those that have dropped below it.

Take a look:                                                                   

The HV ETF Master Cutline Report

In case you are not familiar with some of the terminology used in the reports, please read the Glossary of Terms. If you missed the original post about the Cutline approach, you can read it here.