
ETF Tracker StatSheet
You can view the latest version here.
GOING NOWHERE
- Moving the markets
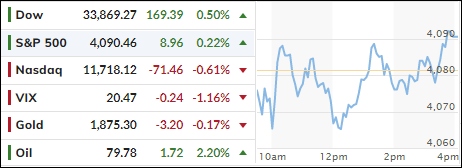
After yesterday’s Puke-A-Thon, the markets tried to find some footing but, while the Dow and S&P 500 managed to eke out a moderate last hour gain, the Nasdaq ended the session in the red.
Alternating between gains and losses, the major indexes closed the week in the red, with the S&P scoring its worst week since December and its first decline in 3 weeks.
Trying to digest not only the Fed’s hawkish commentary on interest rates, but also the words spewed by various Fed mouth pieces, which all sang from the same hymn sheet, left traders uncertain as whether their dovish conviction will really hold up in the future.
To my way of thinking, the signals from the Fed were very clear, and not mixed at all, yet traders and algos alike were simply not convinced that Powell will be firm in his conviction that there would be no rate hikes this year. This left Wall Street in a state of confusion, which markets hate, hence the increase in volatility.
Not helping bullish sentiment was the latest report pointing to an underwhelming earnings season. About 70% of S&P companies have reported and 70% of those beat analysts’ expectations, which is a drop from the historical average of 79%.
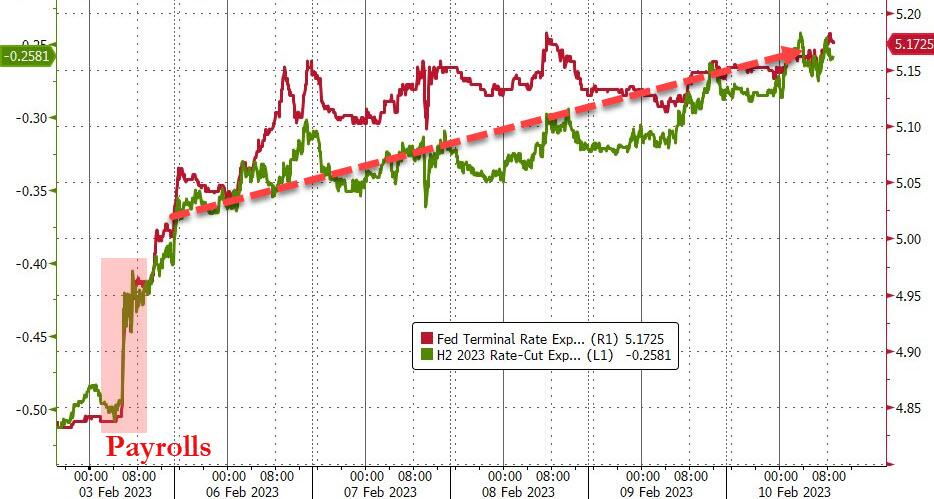
ZeroHedge called it a crash of the “Fed Pivot Party,” as some data points like the Citi Economic Surprise Index rallied unexpectedly, and the Fed’s rate hike trajectory turned decidedly more hawkish, both of which created pain for stocks and bonds this week.
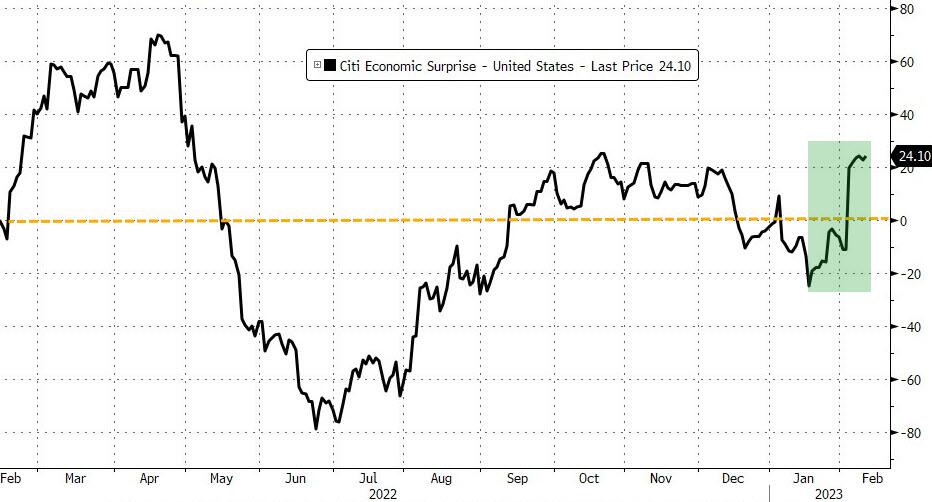
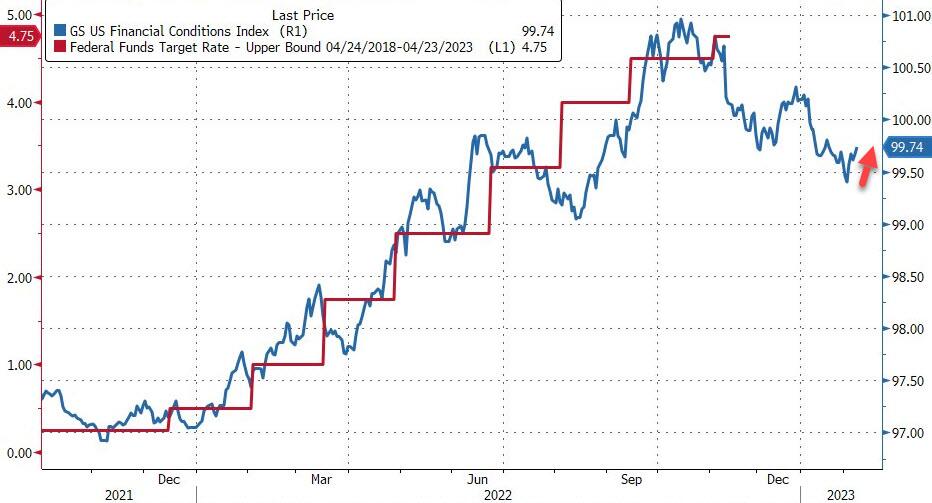
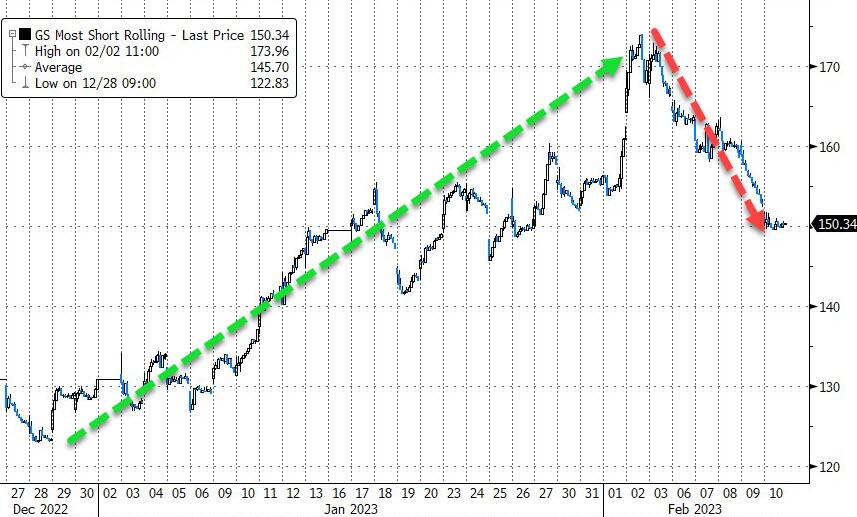
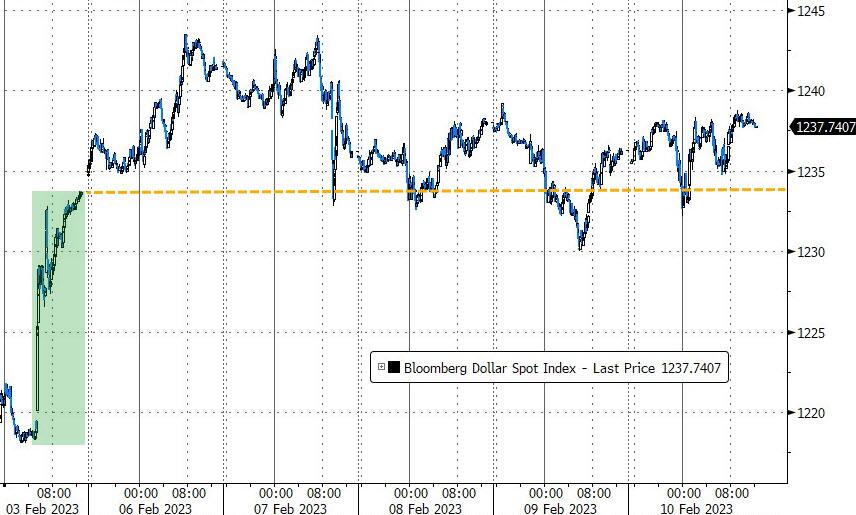
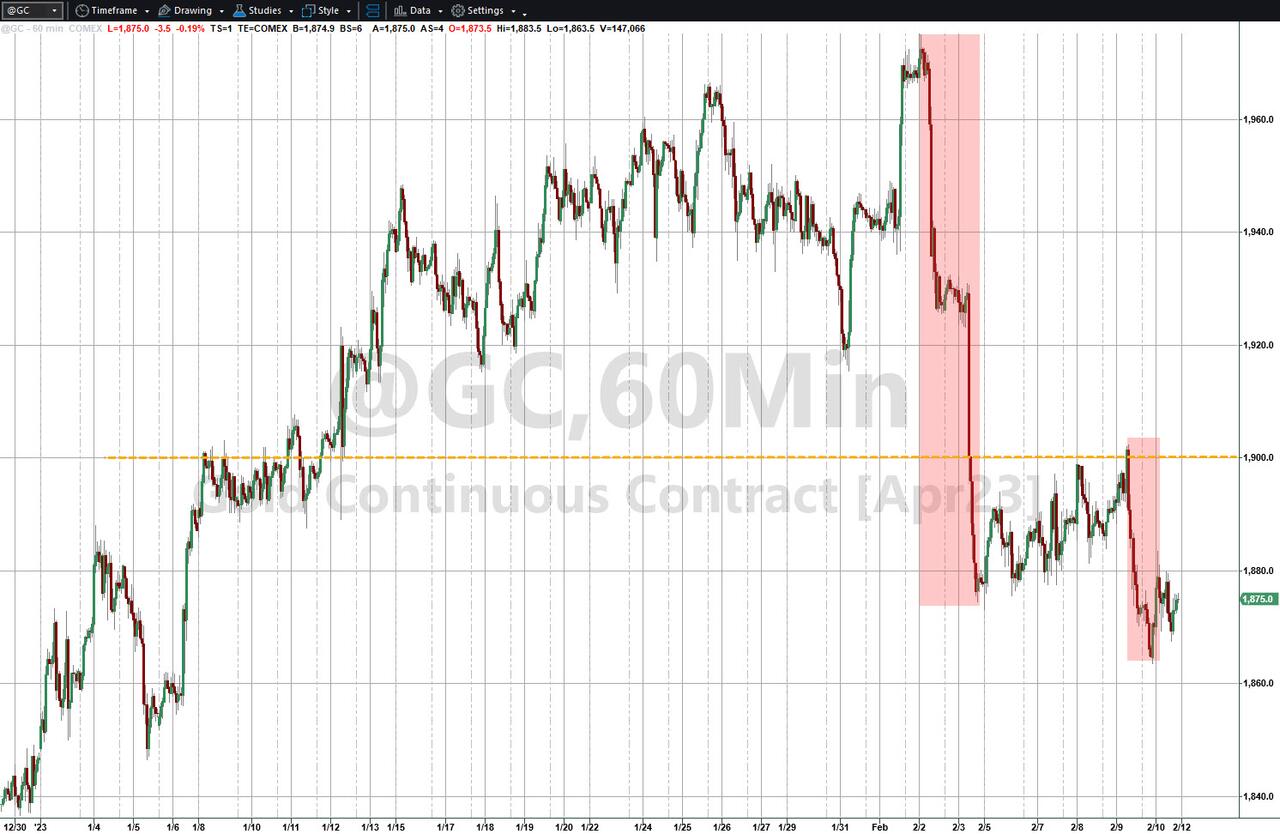
Bond yields ratcheted higher, as financial conditions tightened, causing the most shorted stocks a much needed reversal and helped the US Dollar to climb moderately for the week. Given those facts, it comes as no surprise that Gold suffered by giving up its $1,900 level.
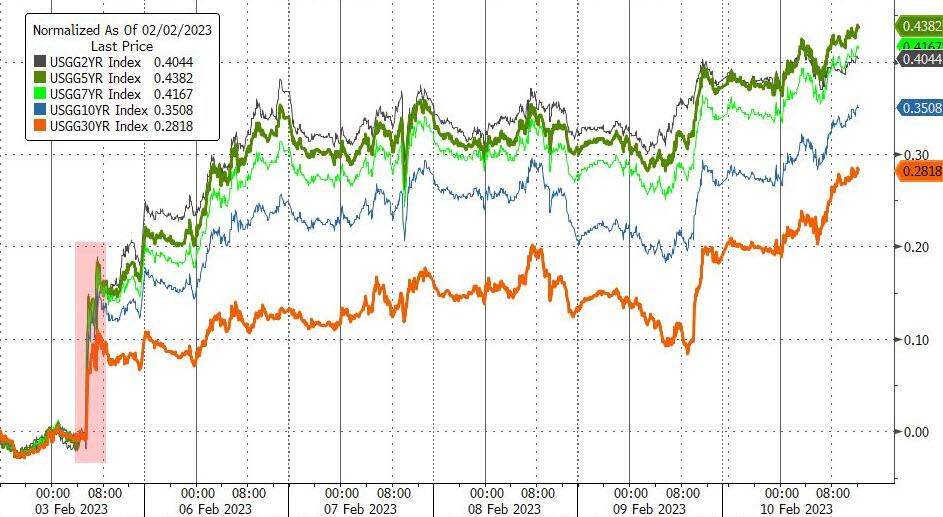
Next week looks like more volatility is on the horizon, with the much-awaited CPI lurking on deck followed by Friday’s options expirations event.
2. “Buy” Cycle Suggestions
For the current Buy cycle, which started on 12/1/2022, I suggested you reference my most for ETFs selections. However, if you came on board later, you may want to look at the most current version, which is published and posted every Thursday at 6:30 pm PST.
I also recommend for you to consider your risk tolerance when making your selections by dropping down more towards the middle of the M-Index rankings, should you tend to be more risk adverse. Likewise, a partial initial exposure to the markets, say 33% to start with, will reduce your risk in case of a sudden directional turnaround.
We are living in times of great uncertainty, with economic fundamentals steadily deteriorating, which will eventually affect earnings negatively and, by association, stock prices. I can see this current Buy signal to be short lived, say to the end of the year, and would not be surprised if it ends at some point in January.
In my advisor practice, we are therefore looking for limited exposure in value, some growth and dividend ETFs. Of course, gold has been a core holding for a long time.
With all investments, I recommend the use of a trailing sell stop in the range of 8-12% to limit your downside risk.
3. Trend Tracking Indexes (TTIs)
Our TTIs presented a mixed picture and changed only immaterially from yesterday’s close.
This is how we closed 02/10/2023:
Domestic TTI: +6.94% above its M/A (prior close +6.78%)—Buy signal effective 12/1/2022.
International TTI: +9.04% above its M/A (prior close +9.45%)—Buy signal effective 12/1/2022.
All linked charts above are courtesy of Bloomberg via ZeroHedge.
———————————————————-
WOULD YOU LIKE TO HAVE YOUR INVESTMENTS PROFESSIONALLY MANAGED?
Do you have the time to follow our investment plans yourself? If you are a busy professional who would like to have his portfolio managed using our methodology, please contact me directly to get more details.
Contact Ulli