ETF Tracker Newsletter For February 3, 2023

Ulli ETF Tracker Contact

ETF Tracker StatSheet          

You can view the latest version here.

A WINNING WEEK ENDS ON A WHIMPER

[Chart courtesy of MarketWatch.com]

  1. Moving the markets

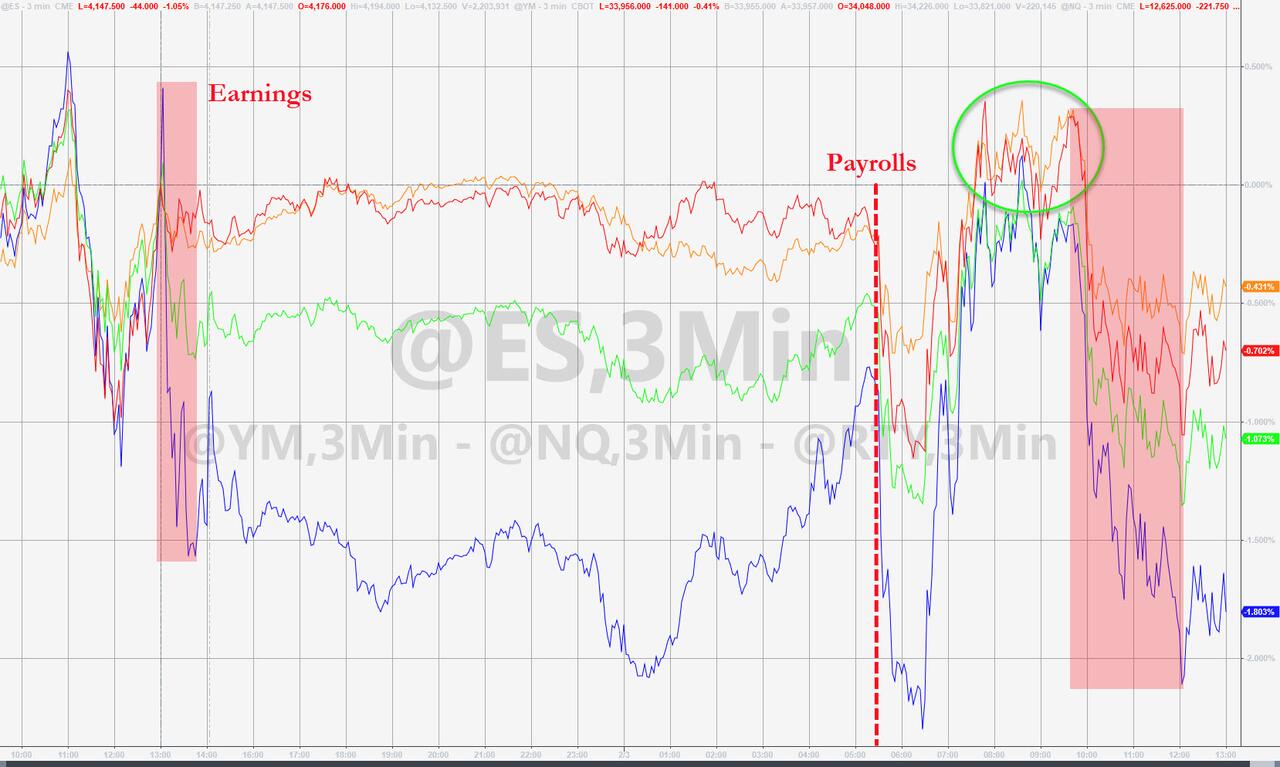
Traders were simply blown away by Friday’s jobs report, which allegedly added some 517k new jobs in January, which was quite the opposite of the expected 187k. The number was so out of line that some analysts referred to it as the seasonal adjustment statement. After all, having witnessed 10s out thousands of layoffs announced in January, these massive job creation numbers simply seem out of line with reality.

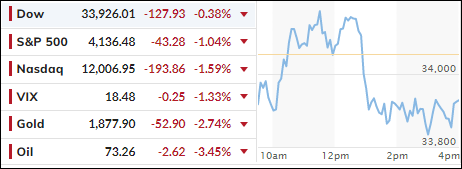
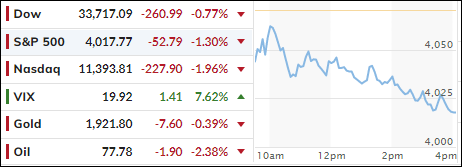
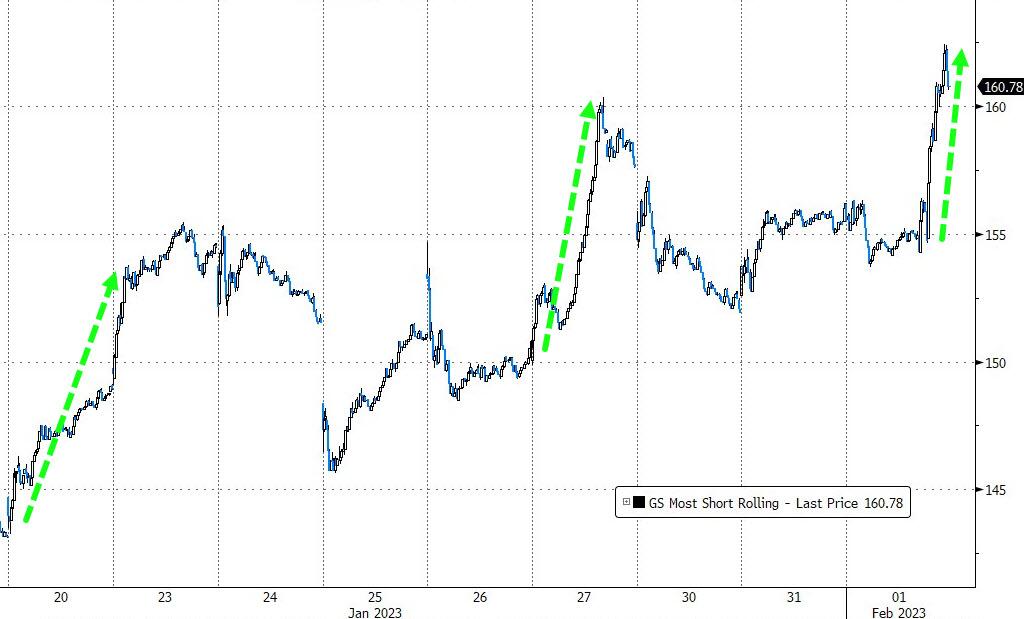
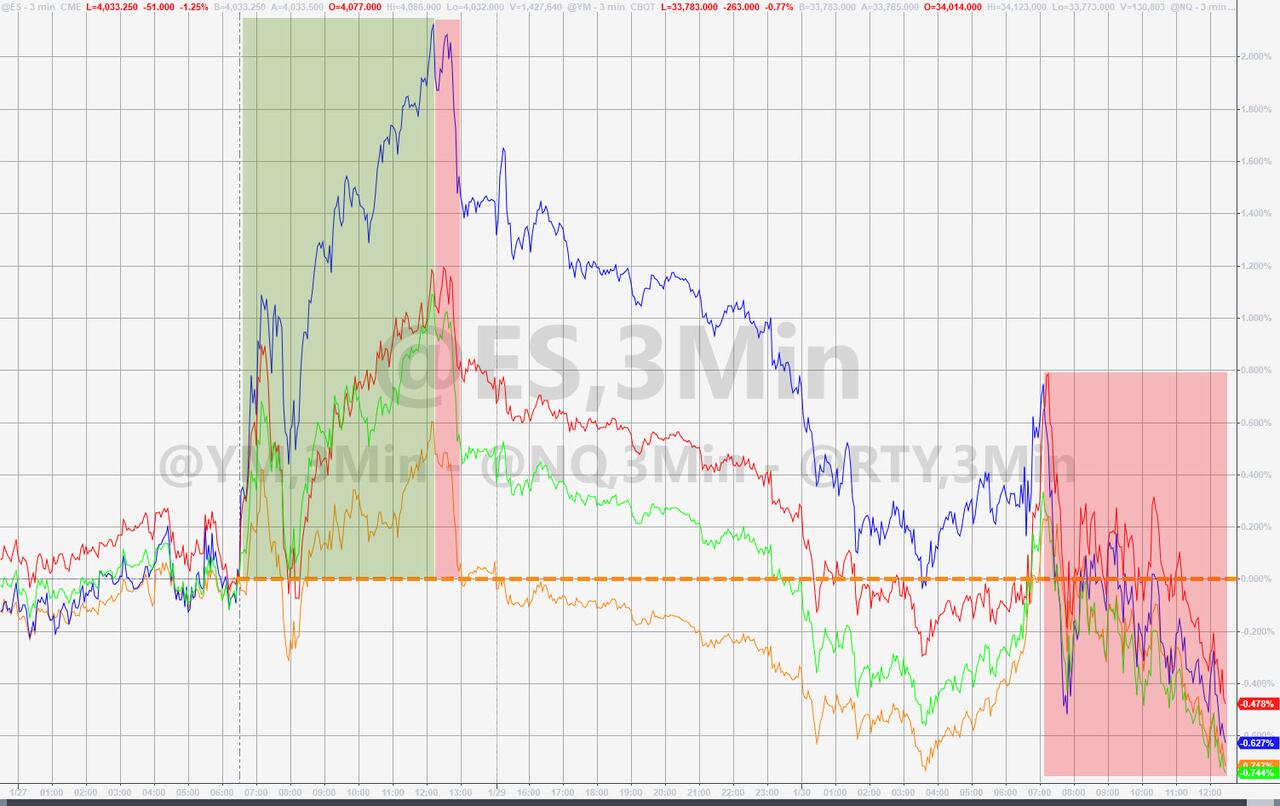
Yesterday’s disappointing earnings reports from tech giants like Amazon, Alphabet and Apple, should have crushed that sector, but its impact was far less than expected. In the end, we saw another short squeeze pushing the major indexes higher, with the Nasdaq gaining over 3% prior to the release of big tech earnings. Today’s retreat of only -1.59% was modest given its recent advances, as the squeeze ran out of ammo.

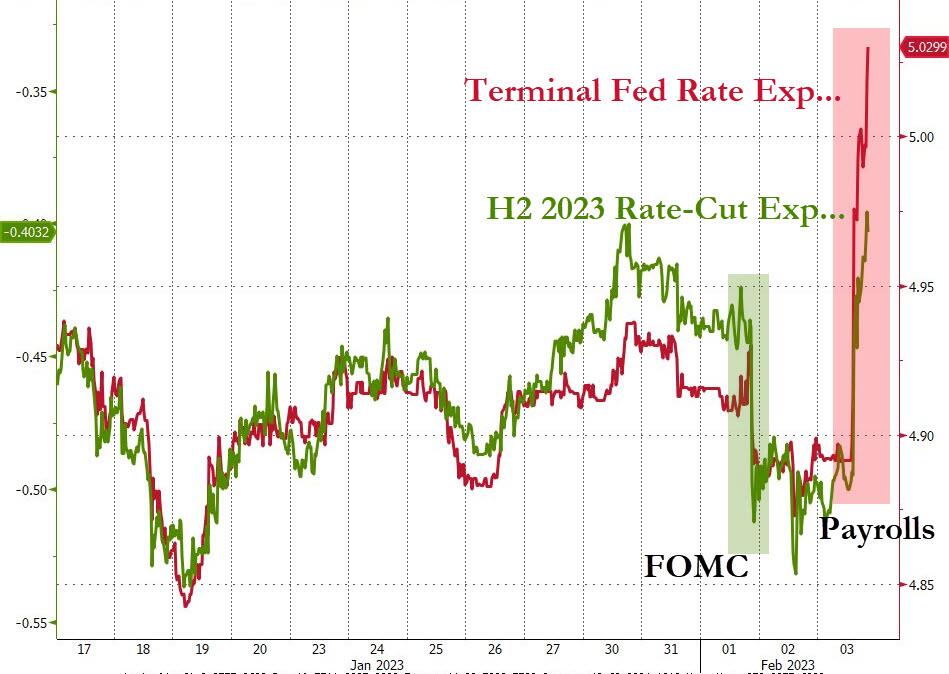
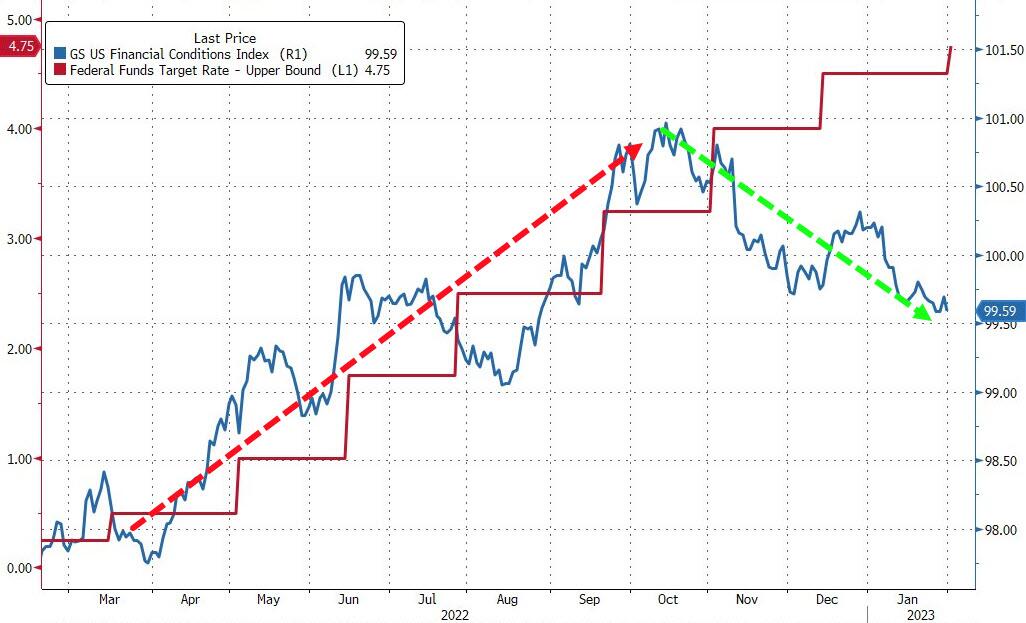
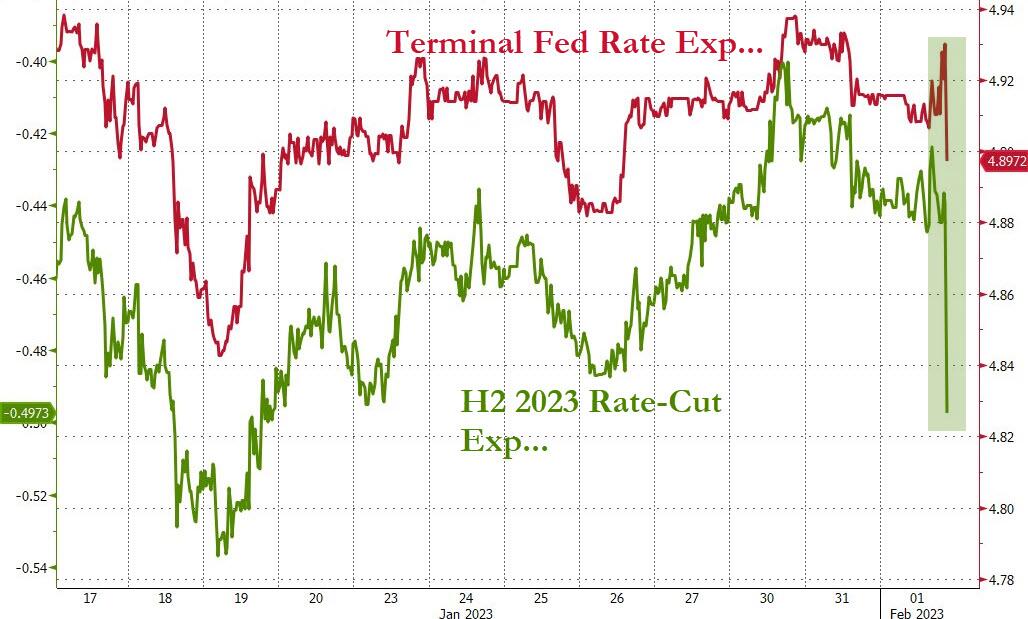
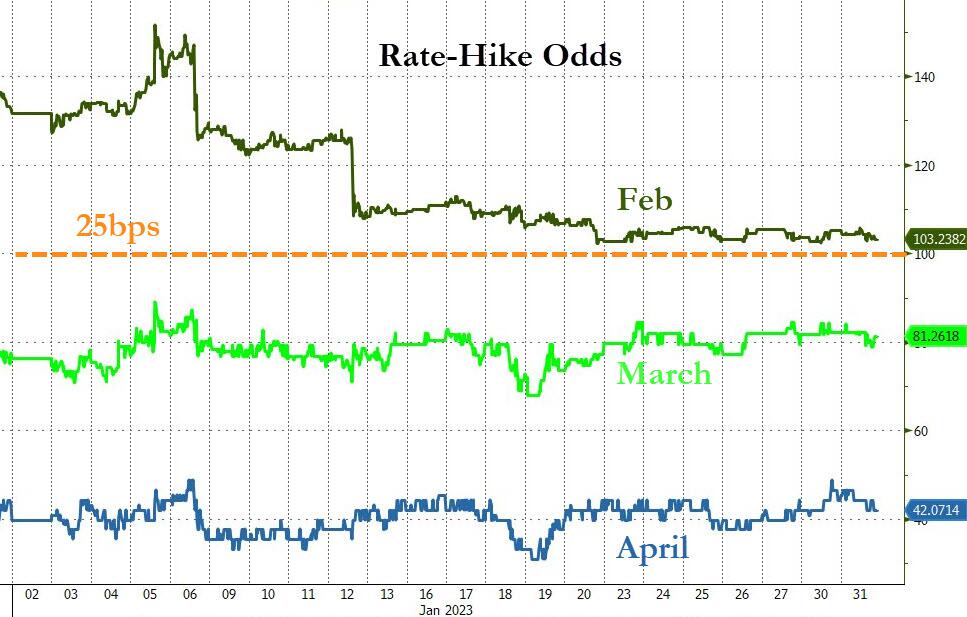
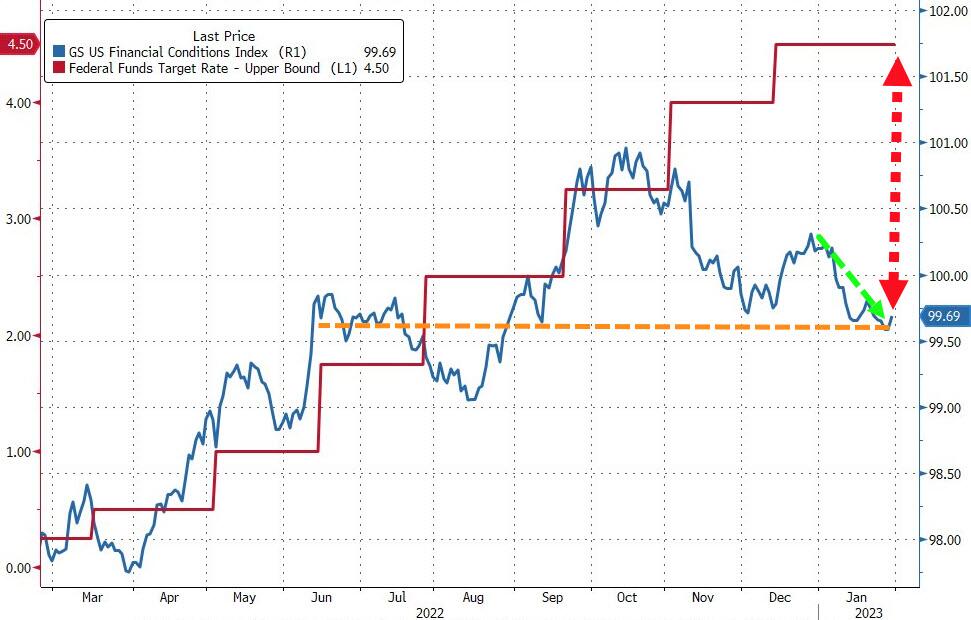
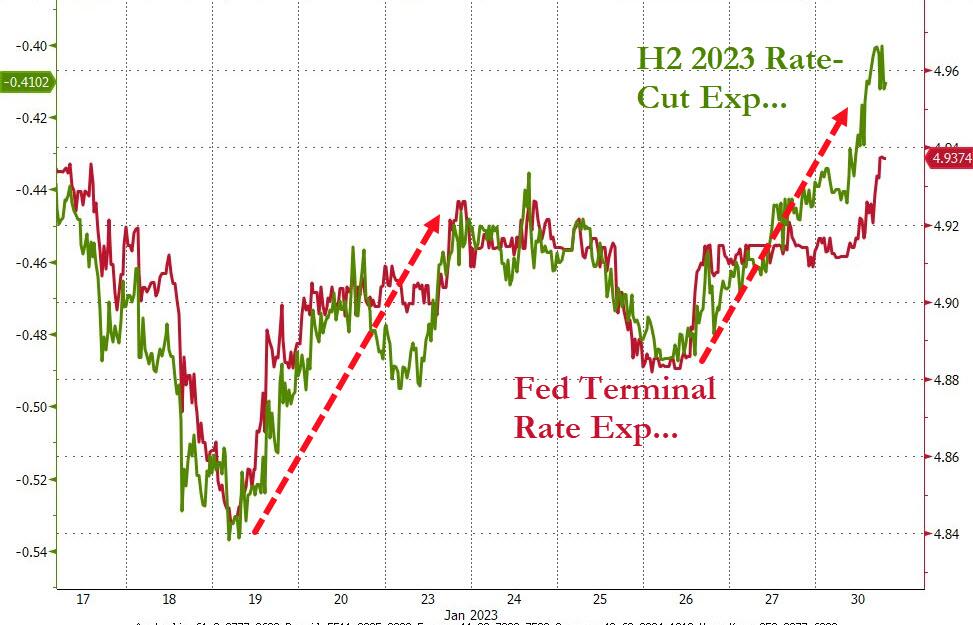
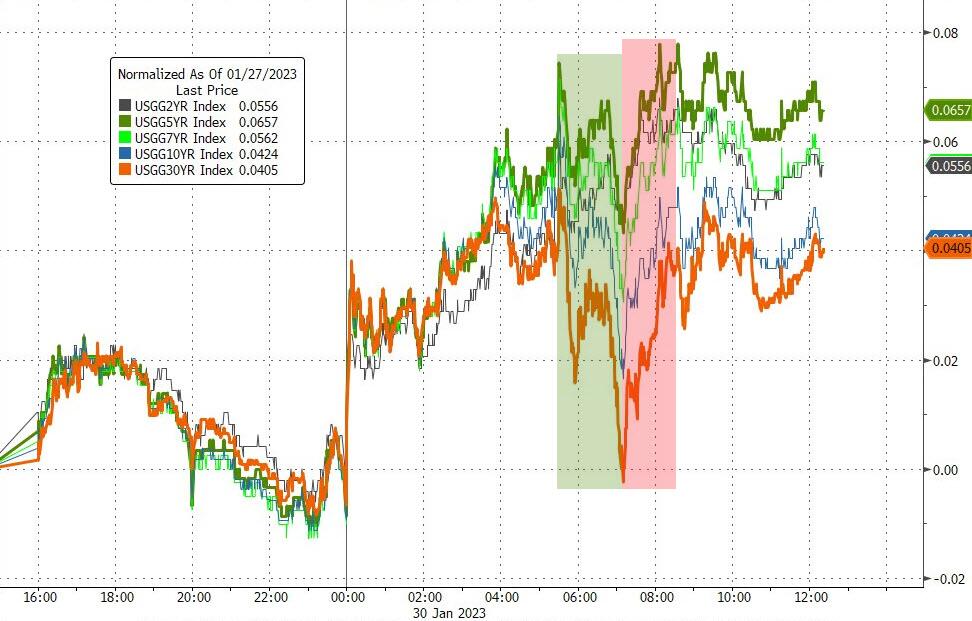
Of course, all this good news about jobs growth, and the unemployment rates sinking to its lowest since 1969, may have unintended consequences in that the Fed, considering this economic strength, may very well continue its tightening path (and not cut this year), as the terminal rate moved back up into hawkish territory.

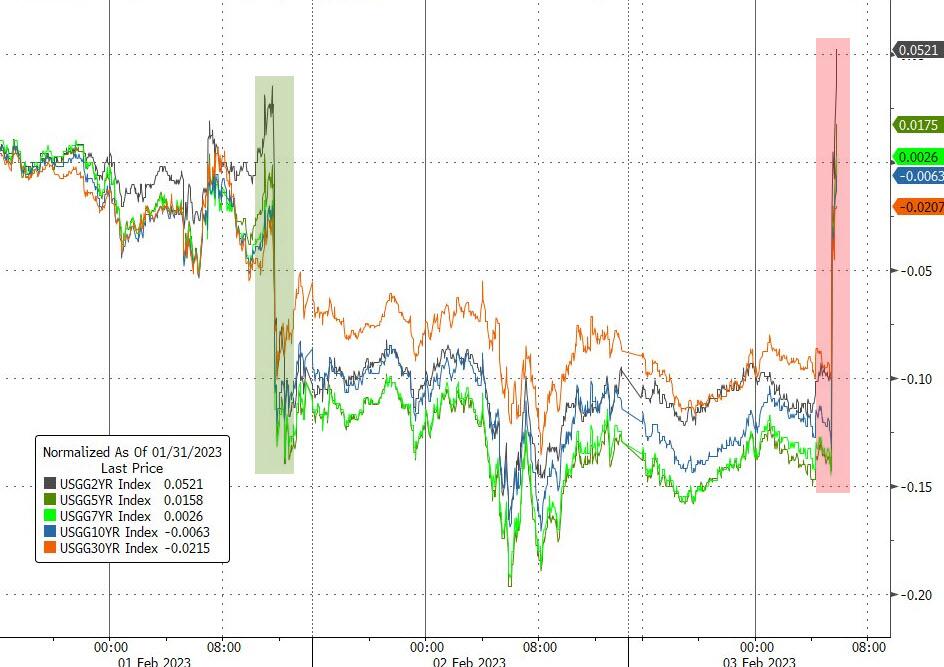
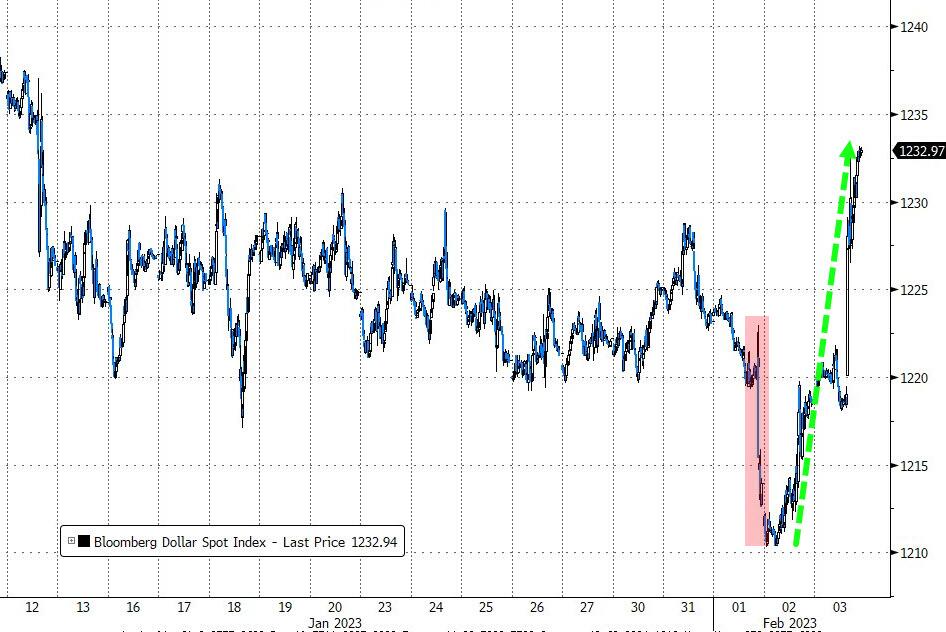
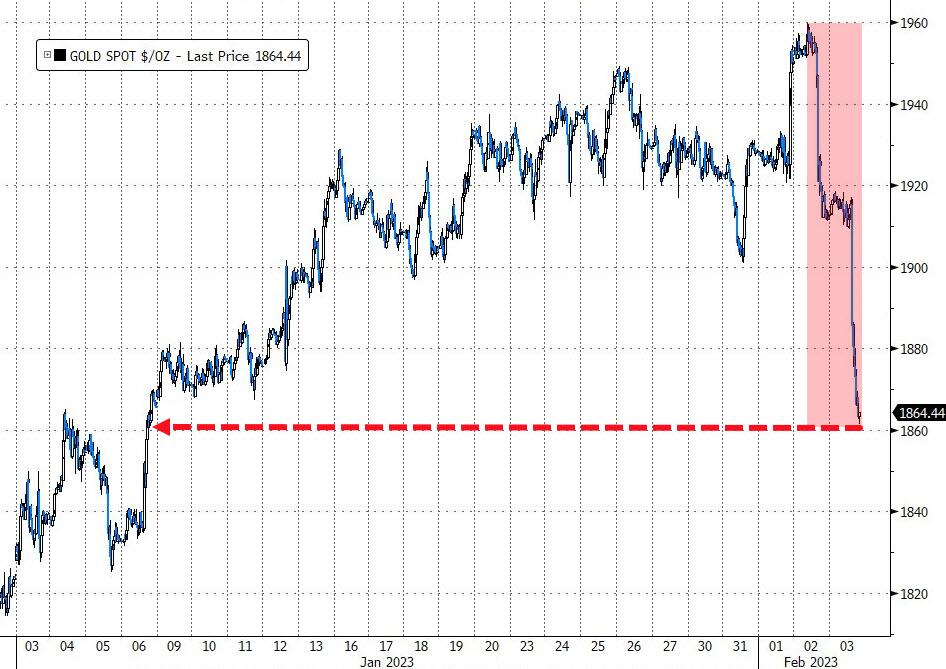
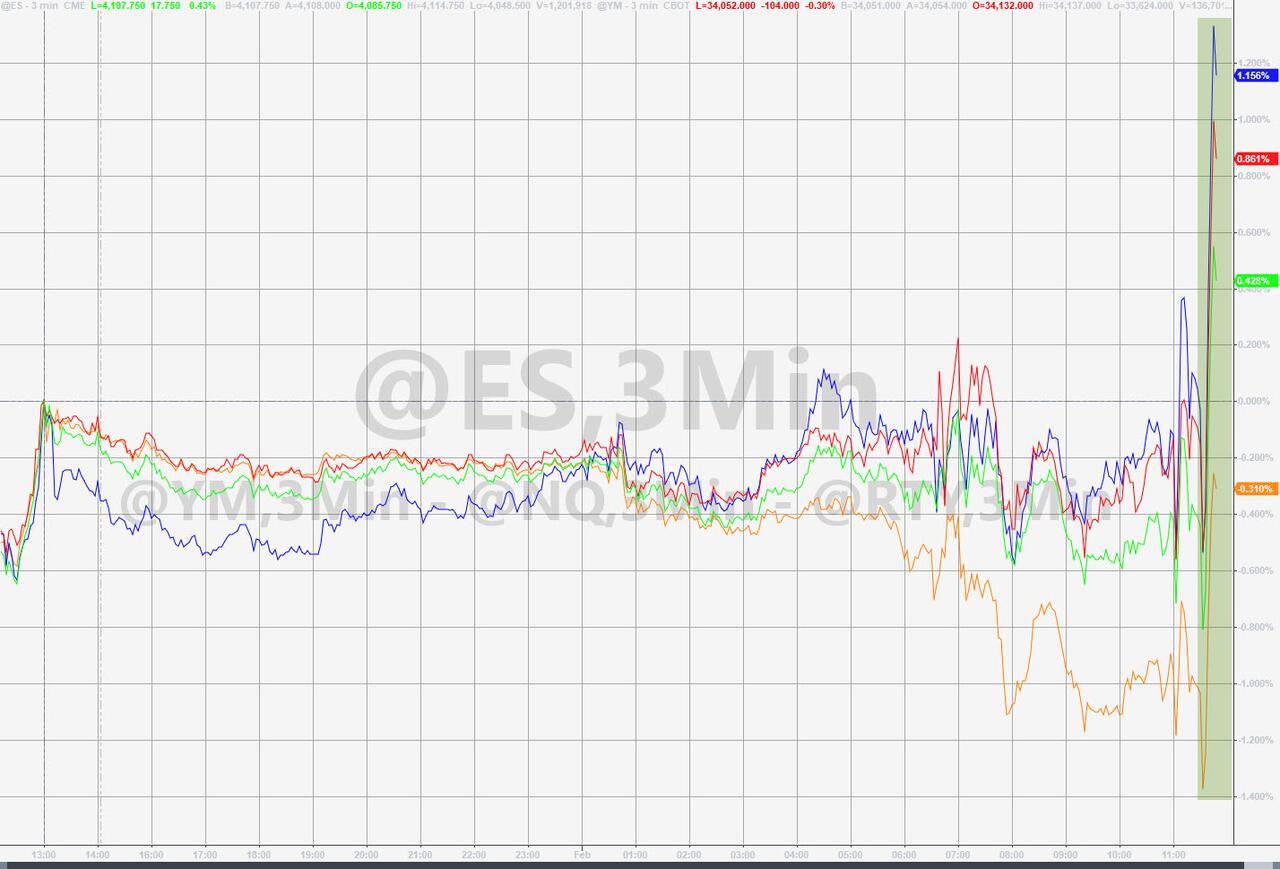
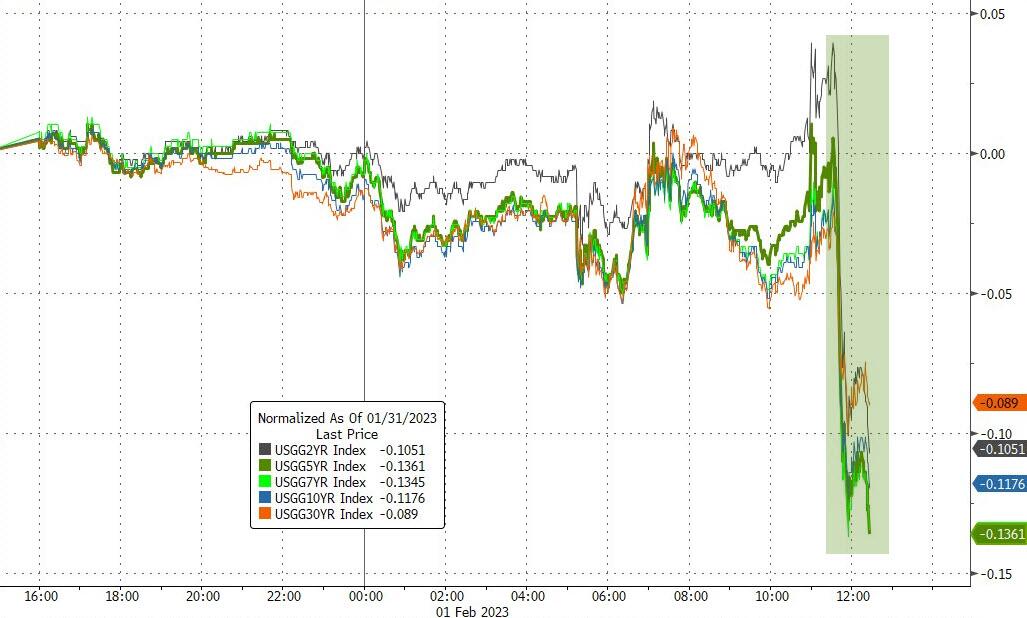
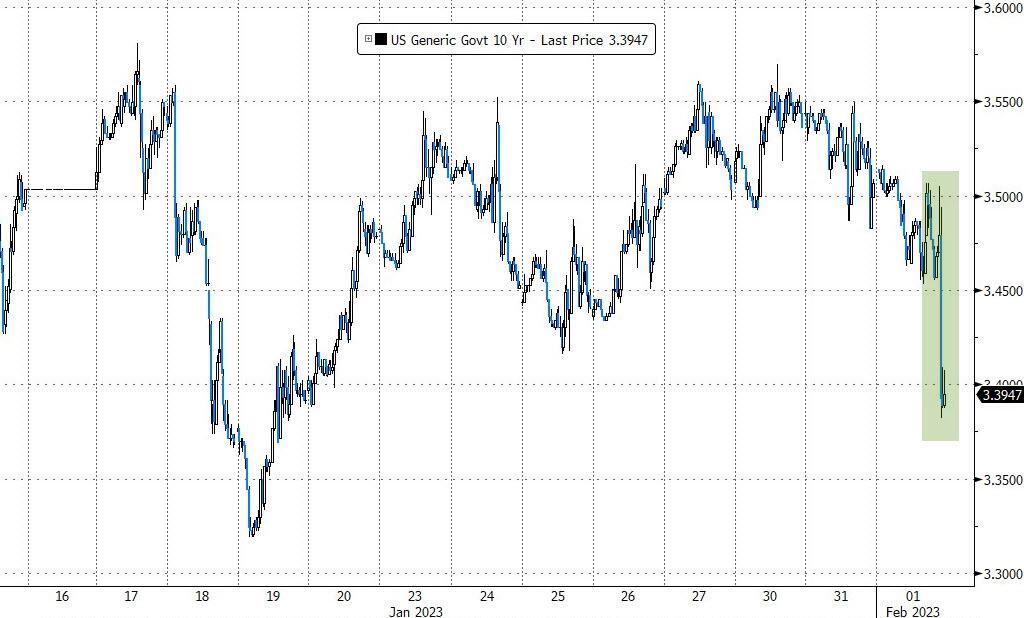
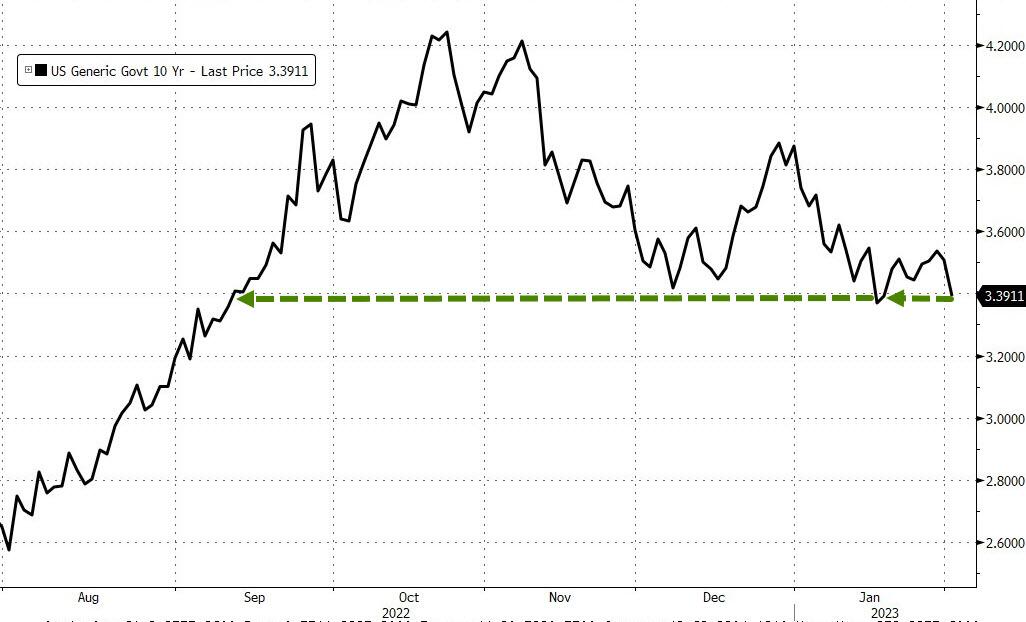
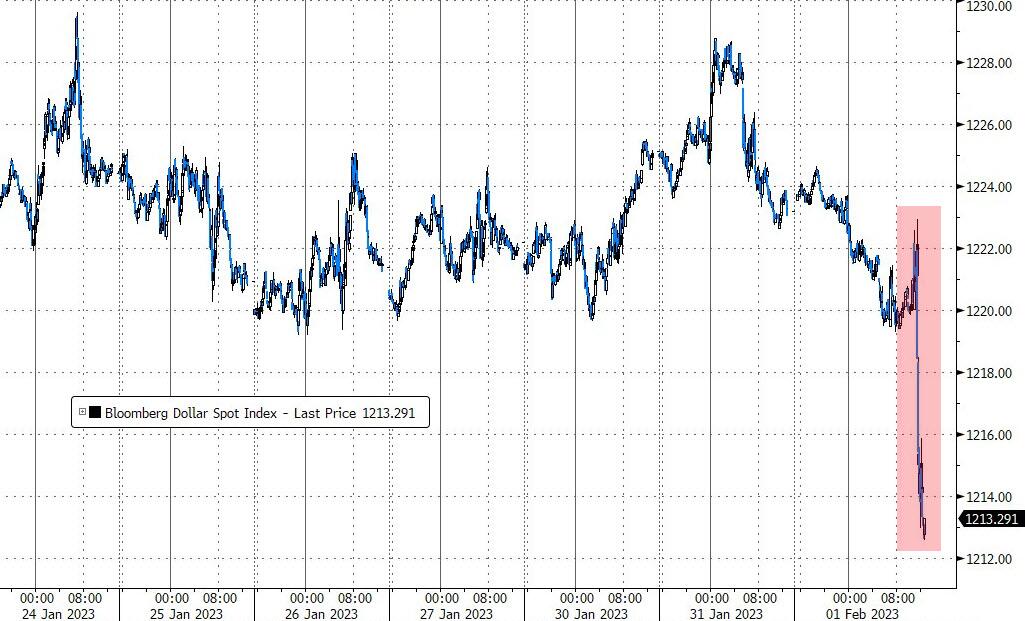
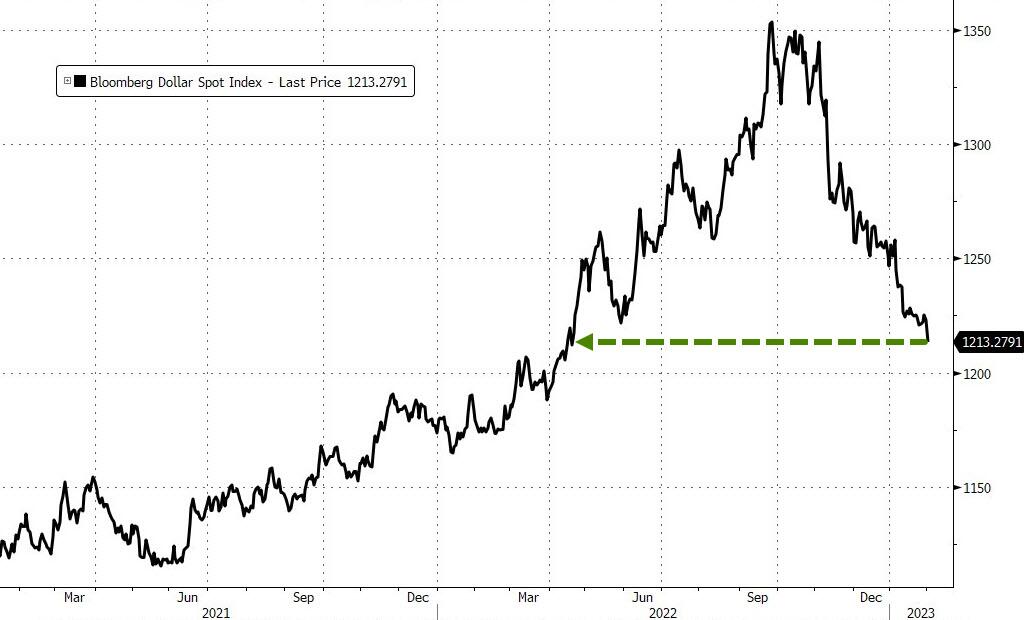
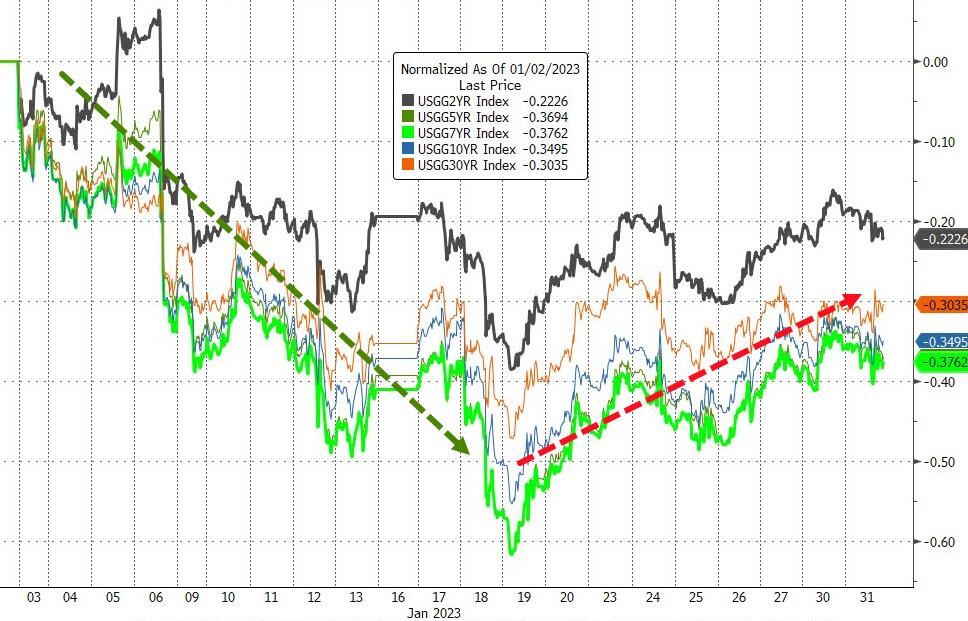
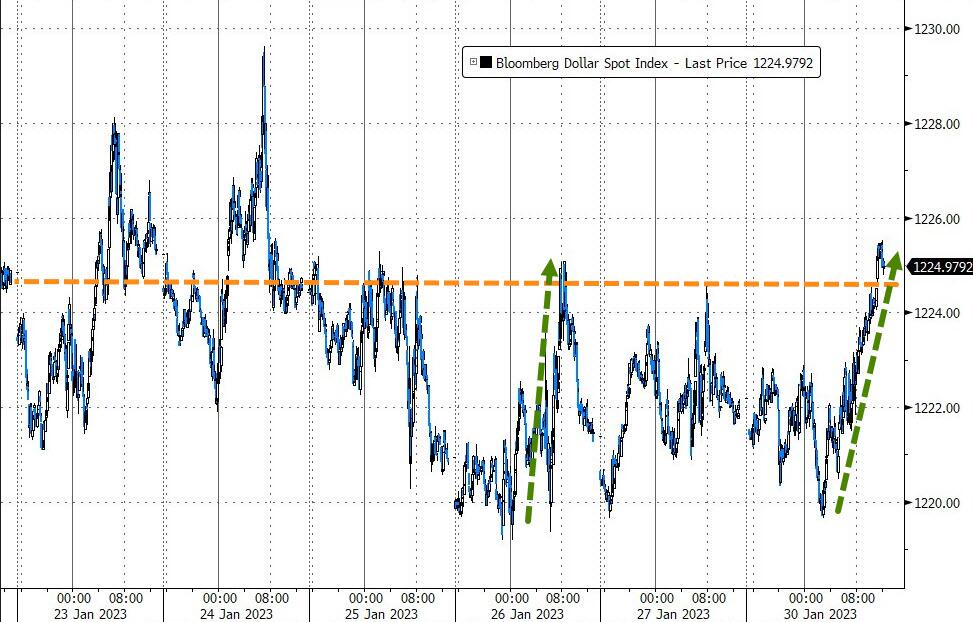
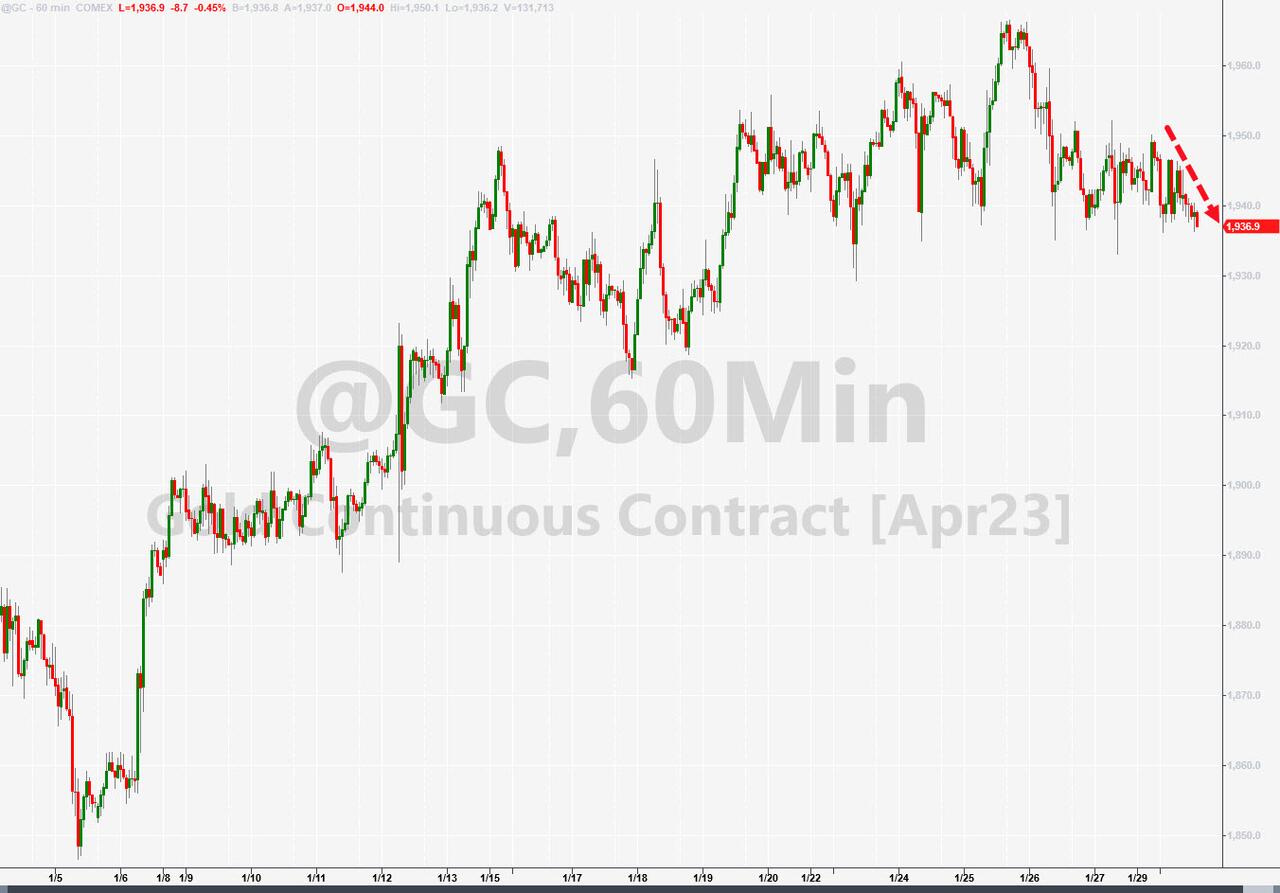
Stocks reversed and headed south and lingered in the red for the remainder of the session. Bond yields spiked, as did the US Dollar, which pulled Gold off its lofty level and back below the $1,900 mark.

It was simply a chaotic day on Wall Street, which portfolio manager Jeffrey Rosenberg categorized like this:

“This is a reminder of what Powell tried to say, but the market was not listening.”

Read More

Weekly StatSheet For The ETF Tracker Newsletter – Updated Through 02/02/2023

Ulli ETF StatSheet Contact

ETF Data updated through Thursday, February 2, 2023

Methodology/Use of this StatSheet:

1. From the universe of over 1,800 ETFs, I have selected only those with a trading volume of over $5 million per day (HV ETFs), so that liquidity and a small bid/ask spread are assured.

2. Trend Tracking Indexes (TTIs)

Buy or Sell decisions for Domestic and International ETFs (section 1 and 2), are made based on the respective TTI and its position either above or below its long-term M/A (Moving Average). A crossing of the trend line from below accompanied by some staying power above constitutes a “Buy” signal. Conversely, a clear break below the line constitutes a “Sell” signal. Additionally, I use a 12% trailing stop loss on all positions in these categories to control downside risk.

3. All other investment arenas do not have a TTI and should be traded based on the position of the individual ETF relative to its own respective trend line (%M/A). That’s why those signals are referred to as a “Selective Buy.” In other words, if an ETF crosses its own trendline to the upside, a “Buy” signal is generated. Here too, I recommend trailing sell stop of 12%, or less, depending on your risk tolerance.

If you are unfamiliar with some of the terminology, please see Glossary of Terms and new subscriber information in section 9.     

1. DOMESTIC EQUITY ETFs: BUY — since 12/01/2022

Click on chart to enlarge

Our main directional indicator, the Domestic Trend Tracking Index (TTI-green line in the above chart) has reclaimed its long-term trend line (red) by +10.10% and remains in “Buy” mode for the time being.

Read More

Fed’s “All Bark No Bite” Delights Markets

Ulli Market Commentary Contact

[Chart courtesy of MarketWatch.com]

  1. Moving the markets

The Fed offered no surprise and followed the expected theme of hiking rates by only 0.25% with more to come. A mid-day sell-off reversed with traders focusing on chairman Powell’s acknowledgement of falling inflation:

We can now say for the first time that the disinflationary process has started. We can really see that, and we see it really on goods prices so far.

While that was music to the bullish crowd, Powell gave no real hint of a pause in hikes, maintaining that:

Ongoing increases in the target range will be appropriate to a attain a stance of monetary policy that is sufficiently restrictive to return inflation to 2% over time.

But, he appeared to shrug off the fact that financial conditions have dramatically loosened recently, as ZeroHedge pointed out, a dovish fact that surprised traders and created additional upward momentum off the mid-session bottom supported by another short squeeze.

In the end, the markets expected some hawkish tones during the presser, yet Powell did not bite but maintained a more dovish tone pushing terminal rate expectations to much lower levels. Market participants took that as a Fed in capitulation mode.

This affected bond yields, which retreated sharply, with the 10-year dropping all the way below the 3.4% level, which is its lowest point since last September. As a result, the US Dollar got spanked to its smallest since last April, while Gold shifted into overdrive by adding over 1% for the day to close at $1,967.

$2,000 gold looks to be on the horizon.

Read More

Storming Into The Fed Meeting

Ulli Market Commentary Contact

[Chart courtesy of MarketWatch.com]

  1. Moving the markets

Traders and algos alike continued with their relentless efforts to challenge the Fed’s resolve of hiking rates for “higher and longer” by propelling the major indexes higher on the last day of the month and the day prior to the Fed’s much-awaited policy announcement.

Again, much of this January move was based on the Fed at least shifting into “pause” mode, which they eventually will, but likely because of the economy is turning over, which will then mean the rally could be short-lived due to earnings taking a hit.

For right now, the overriding theme is a bullish one with S&P 500 having scored its best January since 2019. The anticipation is for the Fed to hike only a meager 0.25% tomorrow, with an 83% chance of another 0.25% in March being baked in the cake.

A massive MOC (Market on Close) order erased all of yesterday’s losses, while the seemingly ever-present short squeeze contributed to January’s comeback. All this exuberance has now reduced the financial conditions to their loosest since June, as ZeroHedge pointed out. This is just the opposite of what the Fed wanted to see, when they called “unwarranted easing” in the last release of their Minutes.

Bond yields slipped during January, the US Dollar fell for the 4th straight month, all of which benefited Gold, as the precious metal not only surged for the 3rd straight month in a row but also gained a solid +5.74% just for January—only a hair below the S&P’s +6.29%.   

Read More

Diving Ahead Of A High Impact Week

Ulli Market Commentary Contact

[Chart courtesy of MarketWatch.com]

  1. Moving the markets

Anxiety reigned supreme ahead of the Fed’s decision on interest rates, with the markets having priced in a meager 0.25% hike. That is despite the countless announcements by a host of speakers that “higher rates for longer” are the current policy theme, yet traders have battled the Fed every step of the way.

It’s likely that the Fed eventually will reverse its tightening schedule, but it’s questionable whether that point in time has been reached already. Wednesday’s release of their decision will shed some light on where they are at with their policies. Will the hawkishness continue? The H2 2023 Rate Cut Expectations seem to indicate so.

Adding to the nervousness in the markets will be the continued earnings barrage with some 20% of the S&P members releasing their report cards this week, including some of the tech giants like Apple, Amazon, Meta, and Alphabet.

At session’s end, today’s reality check erased all of Friday’s gains and then some, as the short squeeze ran out of ammo again.

Bond yields rose due to uncertainty about the Fed’s policy decision, the US Dollar dipped and ripped, which caused Gold to drift modestly lower yet remain firmly anchored above its $1,900 level.

We might see more of the same tomorrow.

Read More

ETFs On The Cutline – Updated Through 01/27/2023

Ulli ETFs on the Cutline Contact

Below, please find the latest High-Volume ETF Cutline report, which shows how far above or below their respective long-term trend lines (39-week SMA) my currently tracked ETFs are positioned.

This report covers the HV ETF Master List from Thursday’s StatSheet and includes 312 High Volume ETFs, defined as those with an average daily volume of more than $5 million, of which currently 255 (last report: 234) are hovering in bullish territory. The yellow line separates those ETFs that are positioned above their trend line (%M/A) from those that have dropped below it.

Take a look:                                                                   

The HV ETF Master Cutline Report

In case you are not familiar with some of the terminology used in the reports, please read the Glossary of Terms. If you missed the original post about the Cutline approach, you can read it here.