Inflation Fears Spook The Market, Small Caps Crash

Ulli Market Commentary Contact

[Chart courtesy of MarketWatch.com]

  1. Moving the markets 

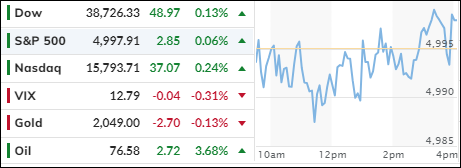
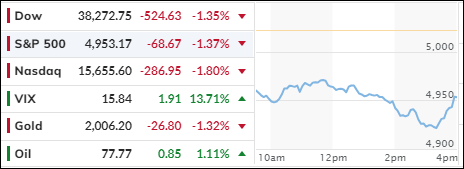
The market had a bad day on Tuesday, thanks to the inflation report for January that showed consumer prices rising more than expected. This sent bond yields soaring and made traders doubt that the Fed could lower interest rates as much as they hoped, which was a big reason why stocks were doing so well.

Small caps were the biggest losers, dropping 5% on their worst day since June 2020. The major indexes also fell but recovered some of their losses in the last hour.

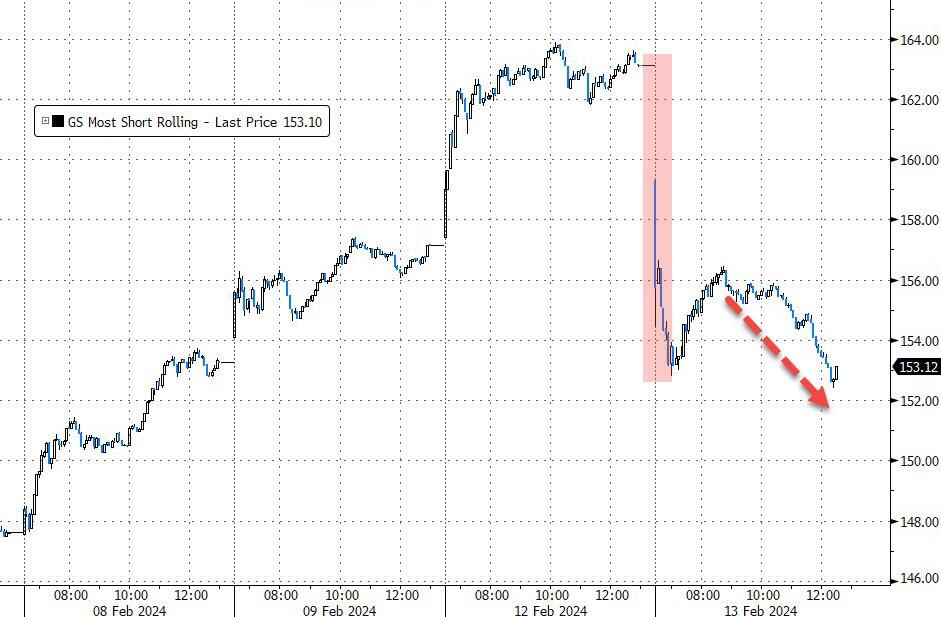
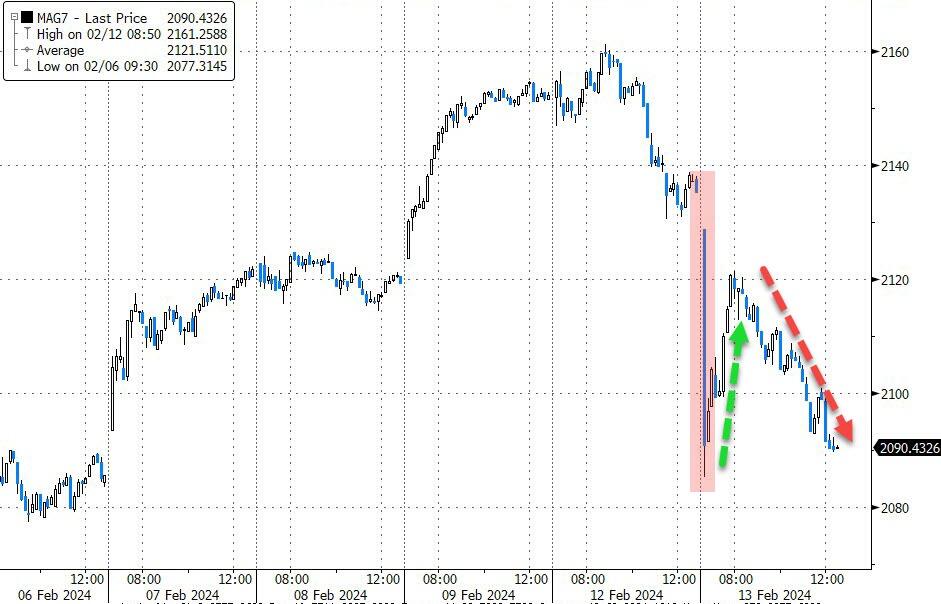
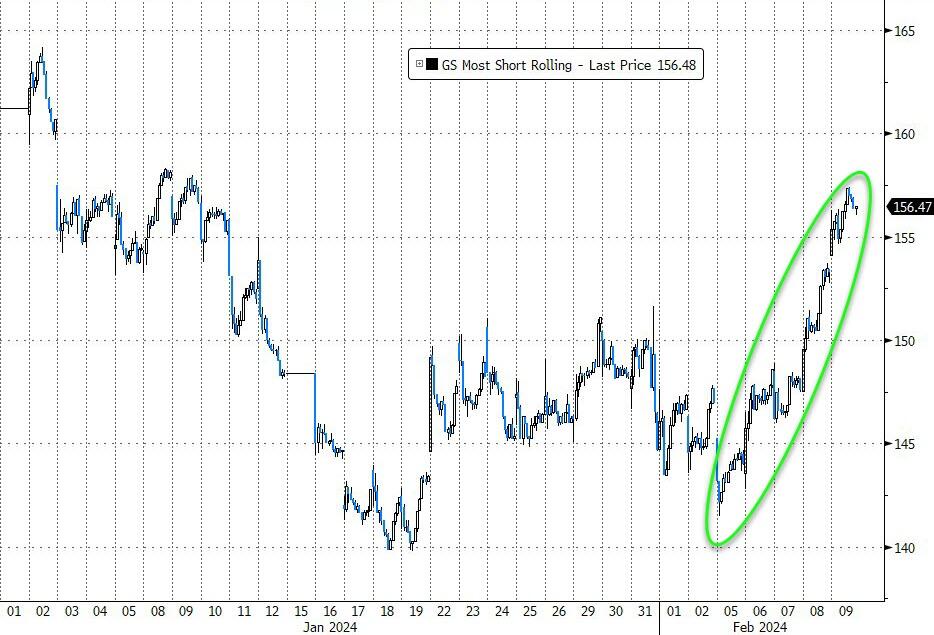
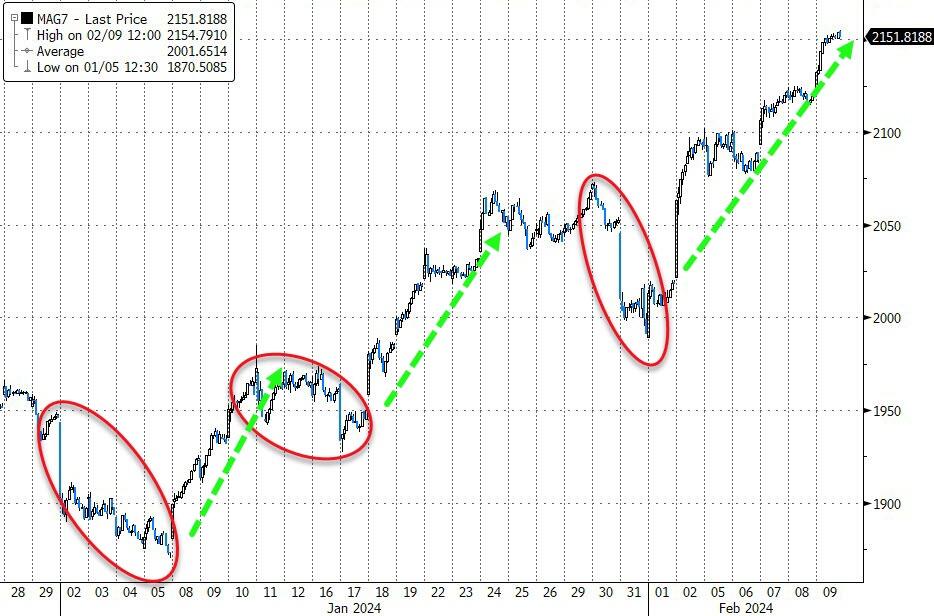
Short sellers had a good day, as the most hated stocks tanked over 6%, the largest drop since June 2022. Even the mighty Mag7, the seven tech giants that have been leading the market, took a hit and closed near their lows.

There was nowhere to hide, as all kinds of investments got hammered. This was a wake-up call that the market’s rally in the past few months was based on wishful thinking that inflation was under control and the Fed was ready to cut rates.

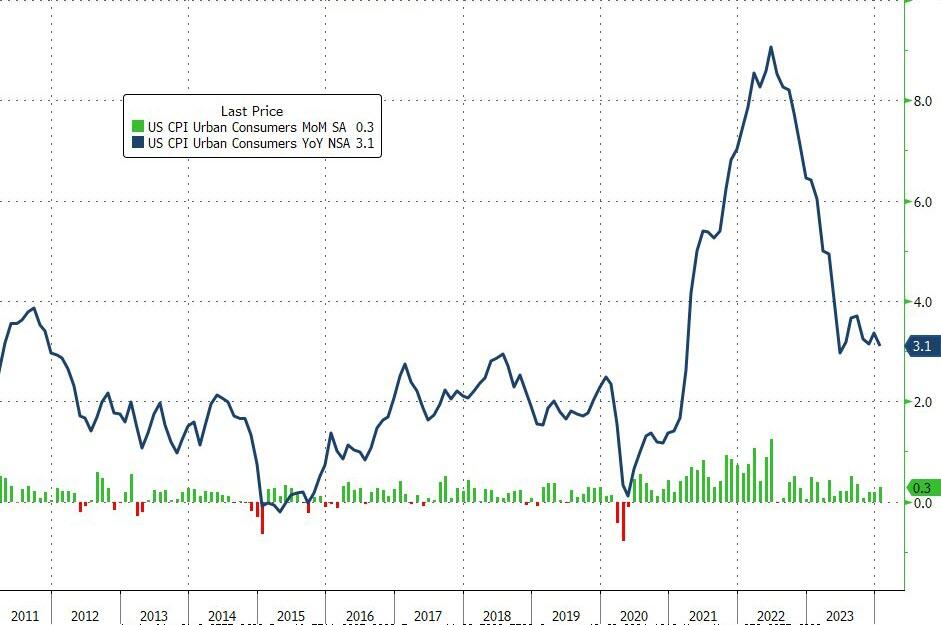
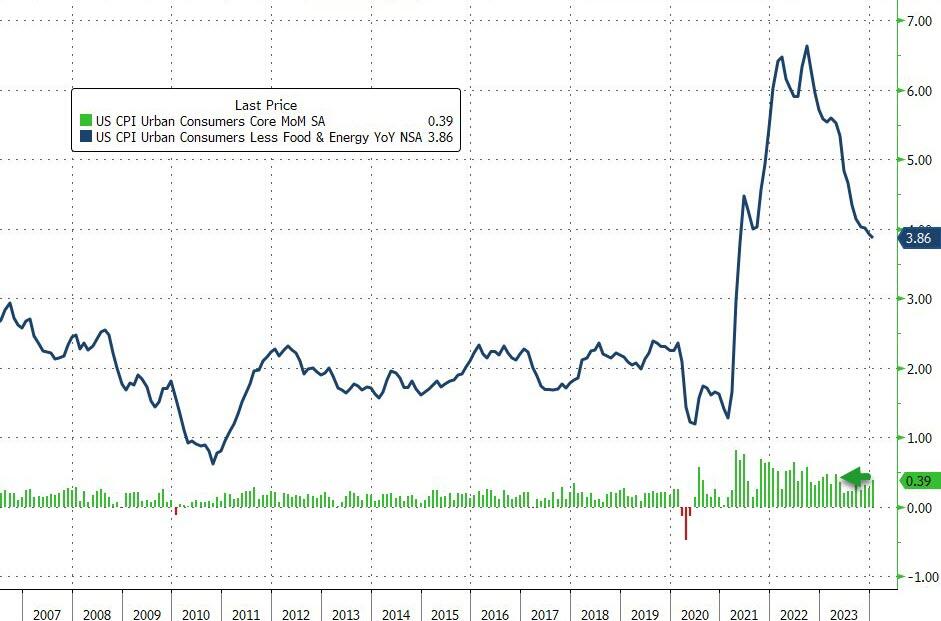
The consumer price index (CPI) rose 0.3% in January from December, and 3.1% from a year ago. Economists expected CPI to rise 0.2% and 2.9%, respectively. Core prices, which exclude food and energy and are the Fed’s preferred measure, rose 0.4% in January from December, and 3.86% from a year ago. Economists expected core prices to rise 0.3% and 3.7%, respectively.

Traders used this as an excuse to take some profits off the table, after the market had been going up almost non-stop this year. The CPI was slightly higher than expected, and showed that inflation was not going down, but up. Or at least that’s the pessimistic view.

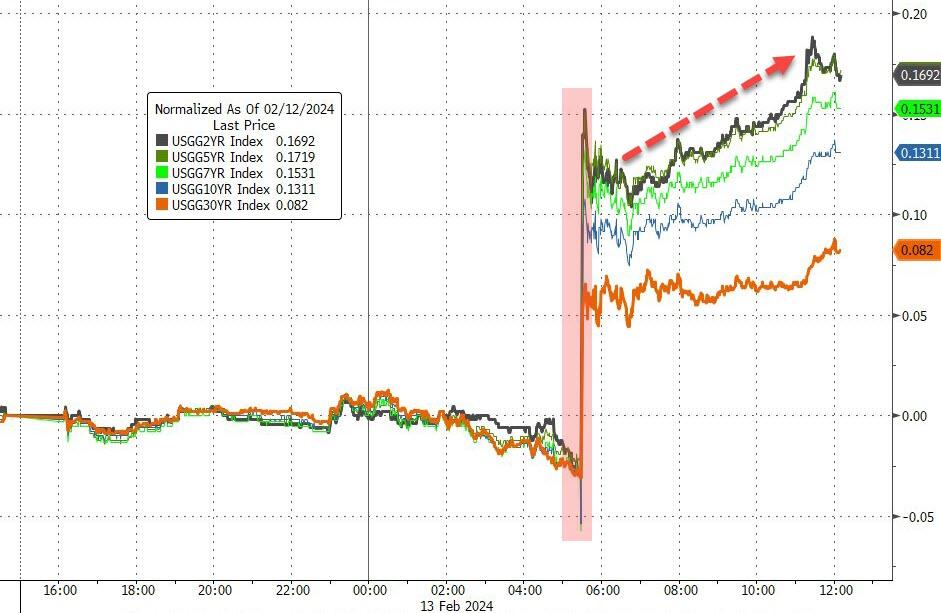
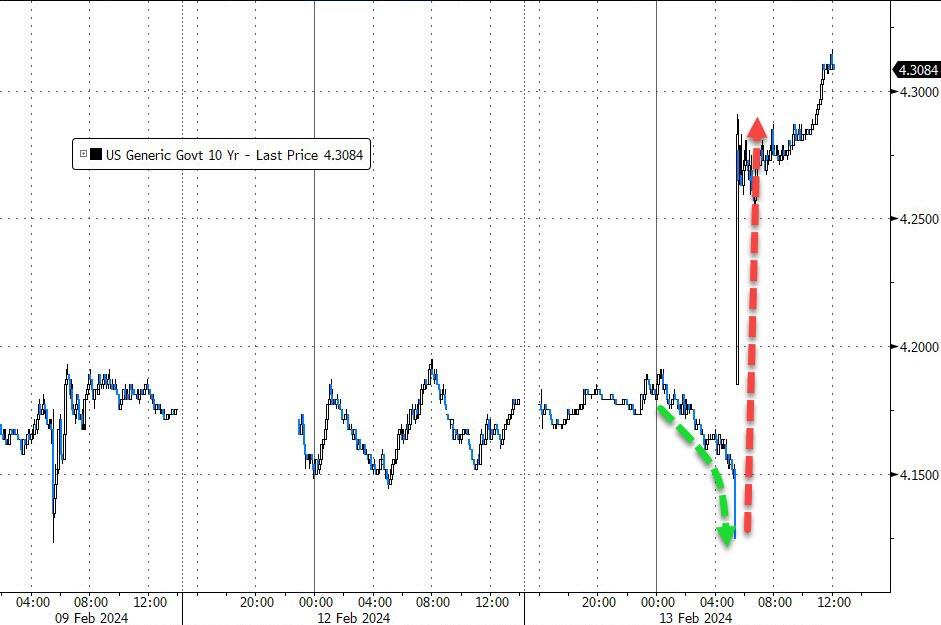
Bond yields jumped, with the 2-year Treasury yield rising above 4.6%, and the 10-year yield reaching 4.32% after the CPI data. Tech stocks like Microsoft and Amazon, which have been driving the market to record highs as rates fell, led the losses today.

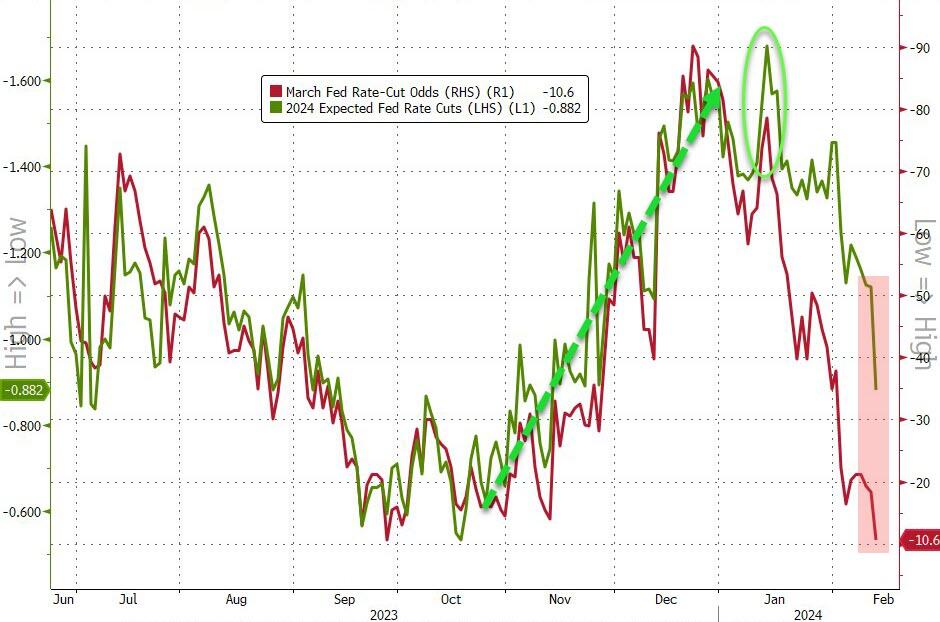
Rate cut odds got slashed, with March now having less than 10% chance and 2024 now pricing in less than 4 total cuts.

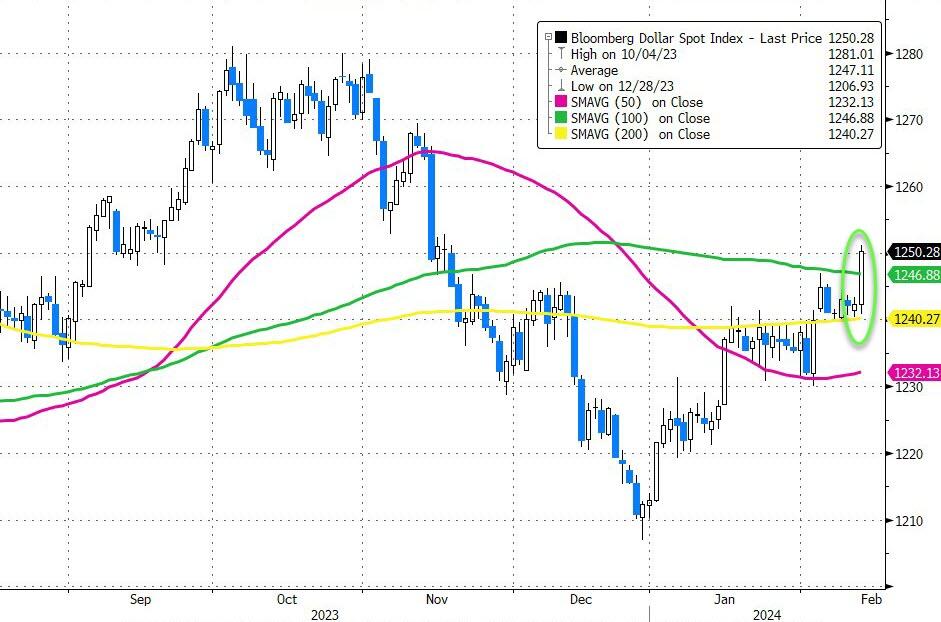
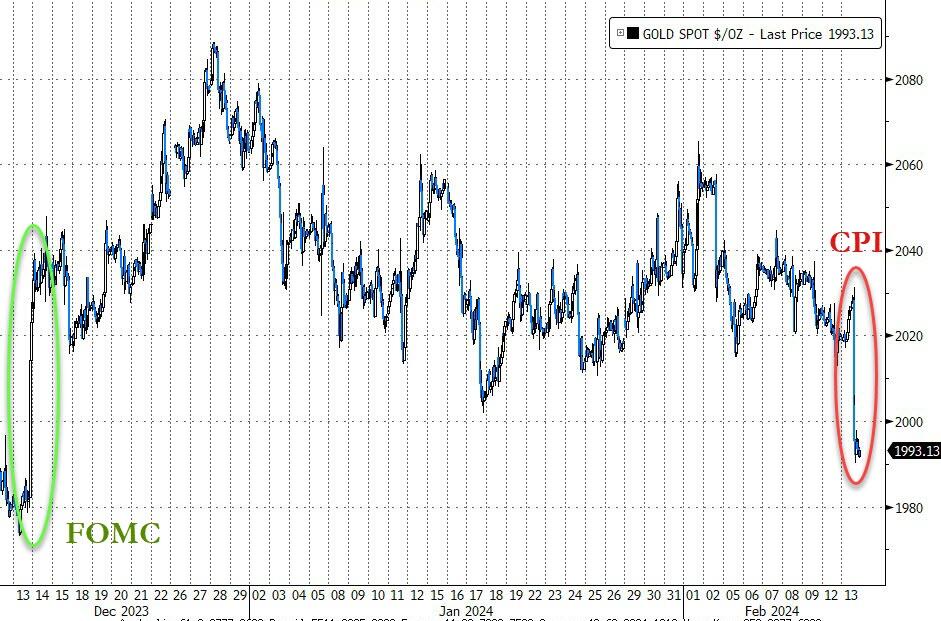
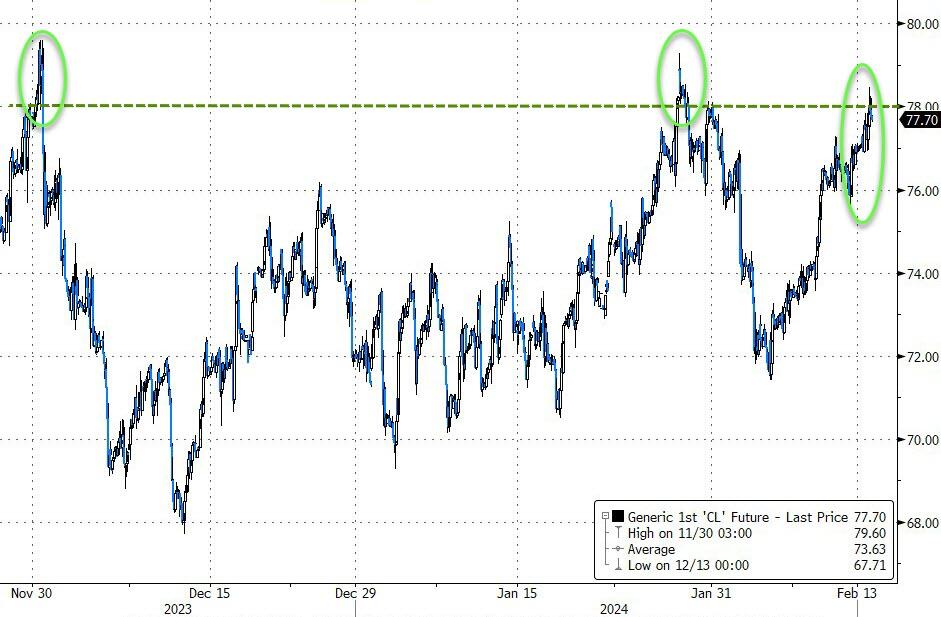
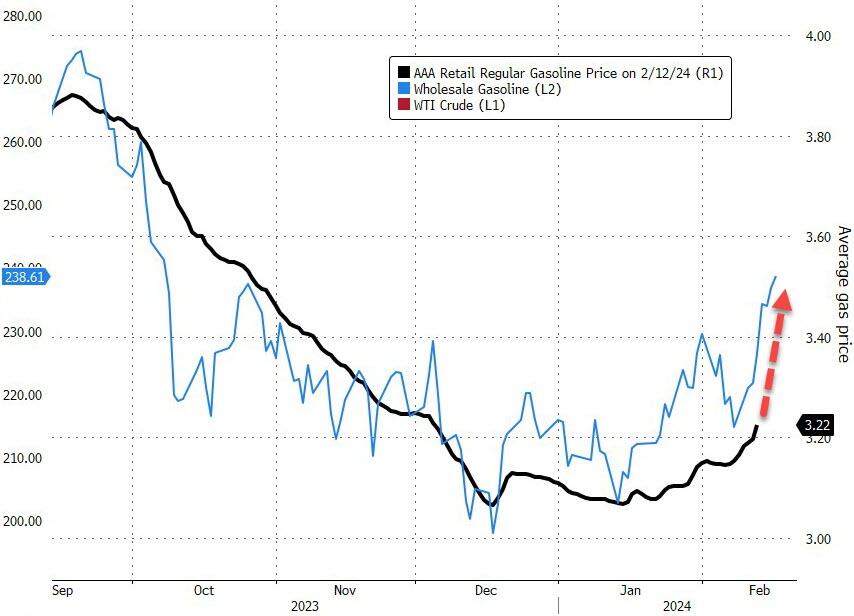
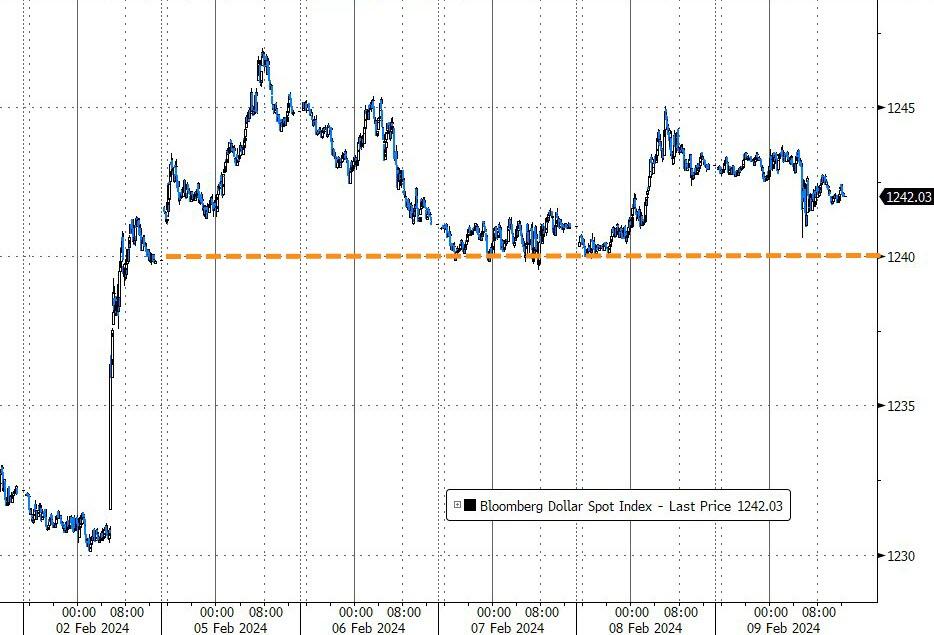
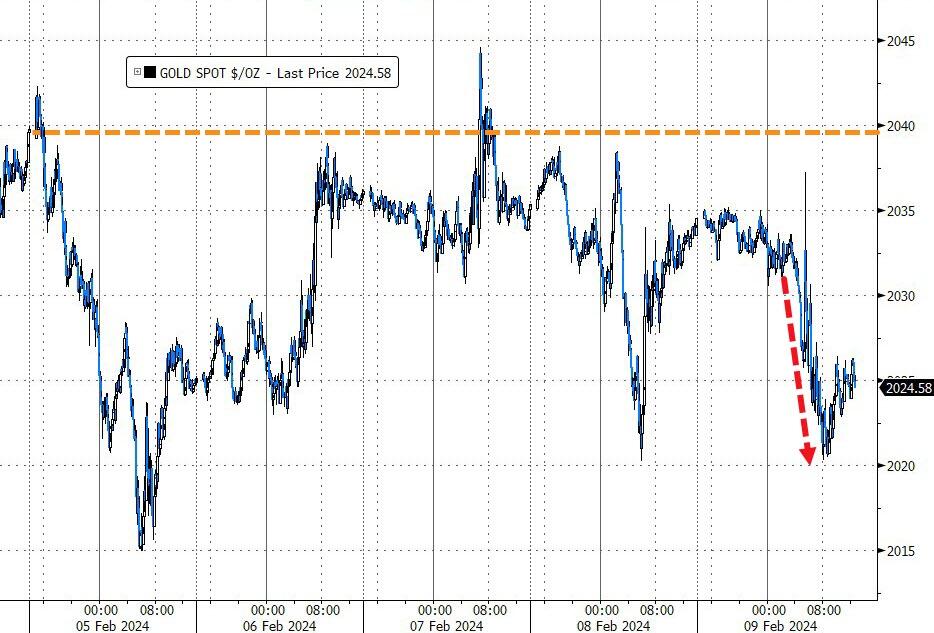
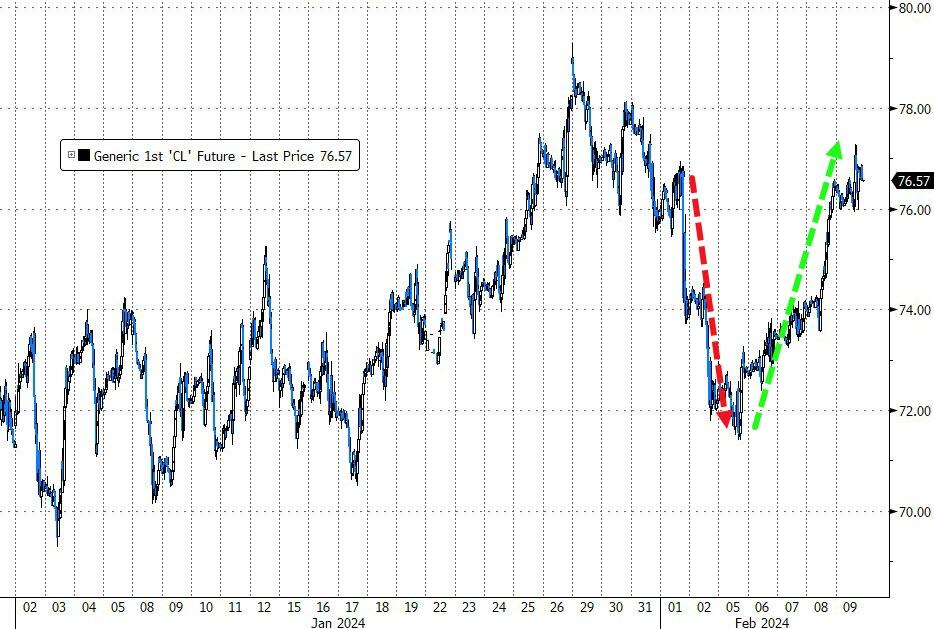
As bond yields rose, the dollar followed suit, gold went the opposite way but stayed above its 2k level. Oil prices climbed, which will not help the next CPI reading, as the Fed will see that gas prices are about to rise.

Traders are now wondering if today’s sell-off was a one-time event or a sign of more trouble ahead.

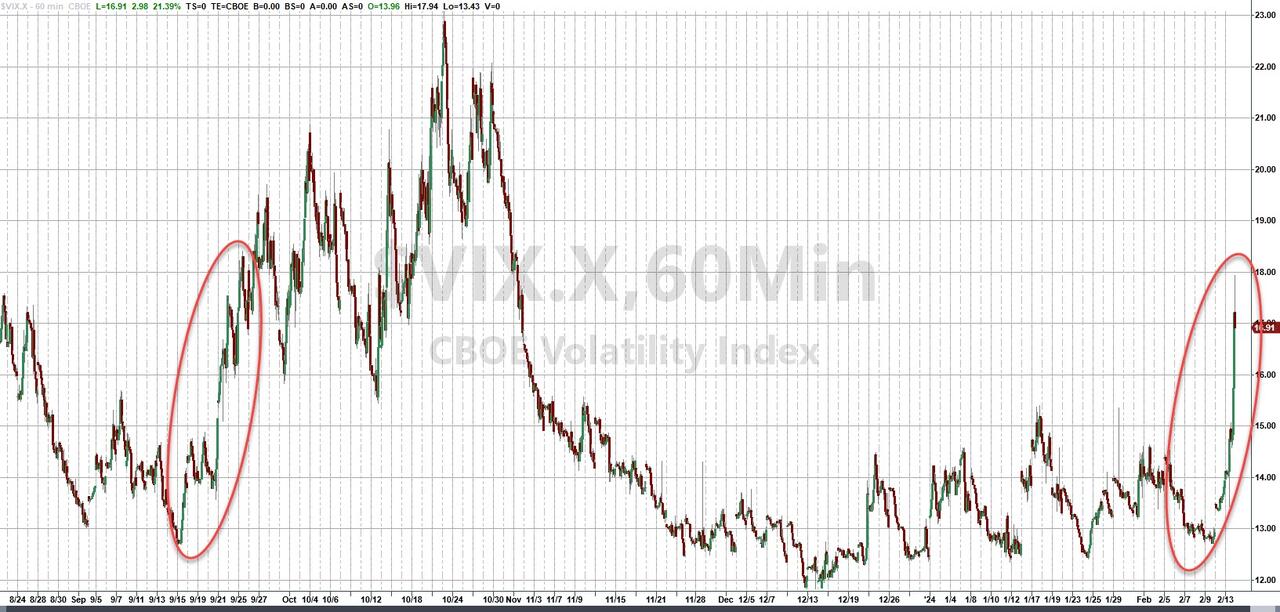
The VIX (volatility index) spiked almost 18%—will it keep going up tomorrow?

Read More
Calm Before The Storm? Markets Await Key Economic Reports

Ulli Market Commentary Contact

[Chart courtesy of MarketWatch.com]

  1. Moving the markets 

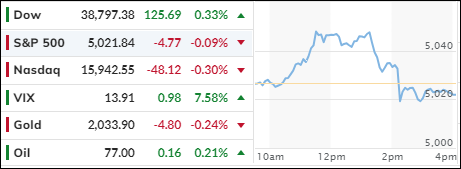
The Dow hit a record high today, while traders waited for new inflation and earnings reports.

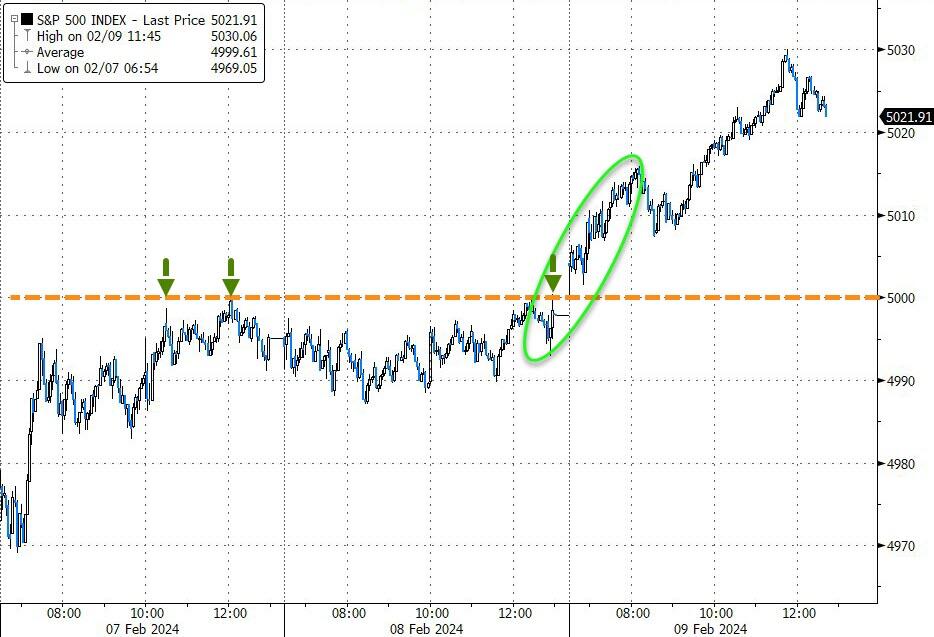
The S&P 500 also made history on Friday, closing above 5,000 for the first time ever. The index has gained more than 5% since January. The S&P 500, the Nasdaq, and the Dow all extended their winning streaks to five weeks, with the Nasdaq leading the way with a 2.3% increase last week.

Traders are optimistic that the market rally is backed by solid fundamentals, as more stocks are participating in the upward movement.

However, some jitters remain as the consumer price index (CPI), a measure of inflation, is due on Tuesday morning. Other important economic indicators, such as retail sales, production, trade, housing, and the producer price index (PPI), will follow later in the week.

Wall Street may be bullish, but it should also be cautious, as the market has been unusually steady and strong for the past three months. The S&P 500 has not seen a 2% drop in over 70 trading days.

Bond yields stayed flat, with the 10-year at 4.168%. The dollar and gold also moved little, with gold ending slightly lower.

In summary, the markets were calm and directionless today, but they could get a lot more interesting soon.

Will the data surprise us or confirm our expectations?

Read More

ETFs On The Cutline – Updated Through 02/09/2024

Ulli ETFs on the Cutline Contact

Do you want to know which ETFs are hot and which ones are not? Then you need my High-Volume ETF Cutline report. It tells you how close or far each of the 311 ETFs I follow is from its long-term trend line (39-week SMA). These are the ETFs that trade more than $5 million a day, so they are not some obscure funds that nobody cares about.

The report is split into two parts: The winners that are above their trend line (%M/A), and the losers that are below it. The yellow line is the line of shame that separates them. You can see how many ETFs are in each group and how they have changed since the last report (252 vs. 251 current).

Take a peek:

The HV ETF Master Cutline Report

If you are confused by some of the terms we use, don’t panic. I have a helpful Glossary of Terms for you.

If you want to learn more about the Cutline method and how it can make you rich (or at least less poor), read my original post here.

ETF Tracker Newsletter For February 9, 2024

Ulli Market Commentary Contact

ETF Tracker StatSheet          

You can view the latest version here.

S&P 500 TOPS 5,000 ON LOWER INFLATION, BUT TECH-BOND GAP RAISES QUESTIONS

[Chart courtesy of MarketWatch.com]

  1. Moving the markets 

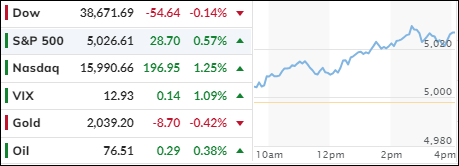
The S&P 500 finally cracked the 5,000 mark today, thanks to a belated Christmas gift from the government: a lower inflation rate for December.

The index had flirted with the milestone on Thursday, but only sealed the deal today. Small Caps had a big week, squeezing the shorts and beating the Nasdaq (and the S&P) in the race for returns. The Dow, on the other hand, was a snooze fest, ending the week flat.

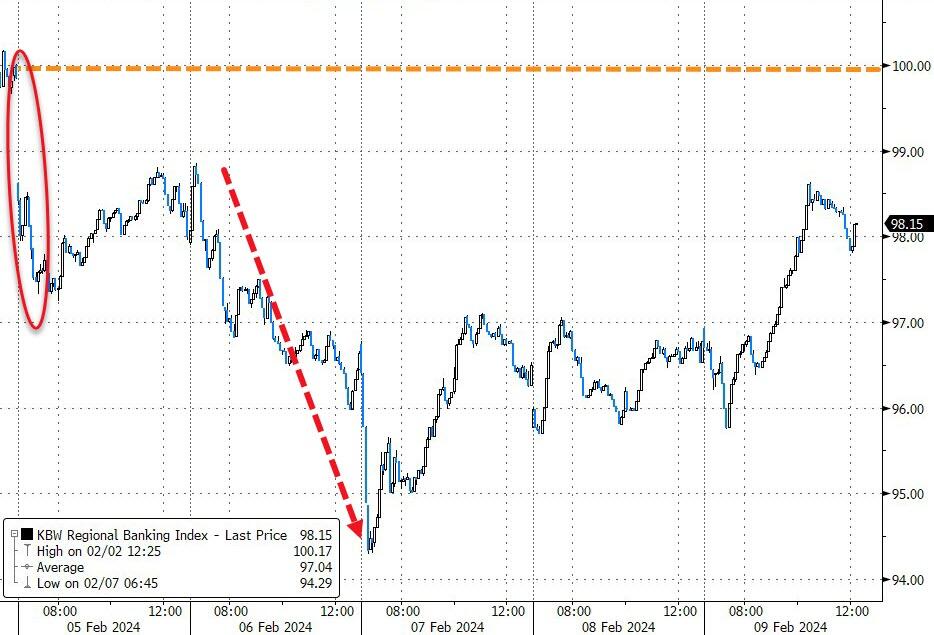
The MAG7 stocks continued their winning streak for the fifth week in a row, while Regional Bank stocks had a rough ride, but recovered from their mid-week slump.

The market rally has been fueled by strong earnings, tame inflation, and a robust economy, making this the fifth week of gains in a row. But don’t pop the champagne just yet because today’s rally was mostly driven by tech stocks, which could be a sign of trouble ahead.

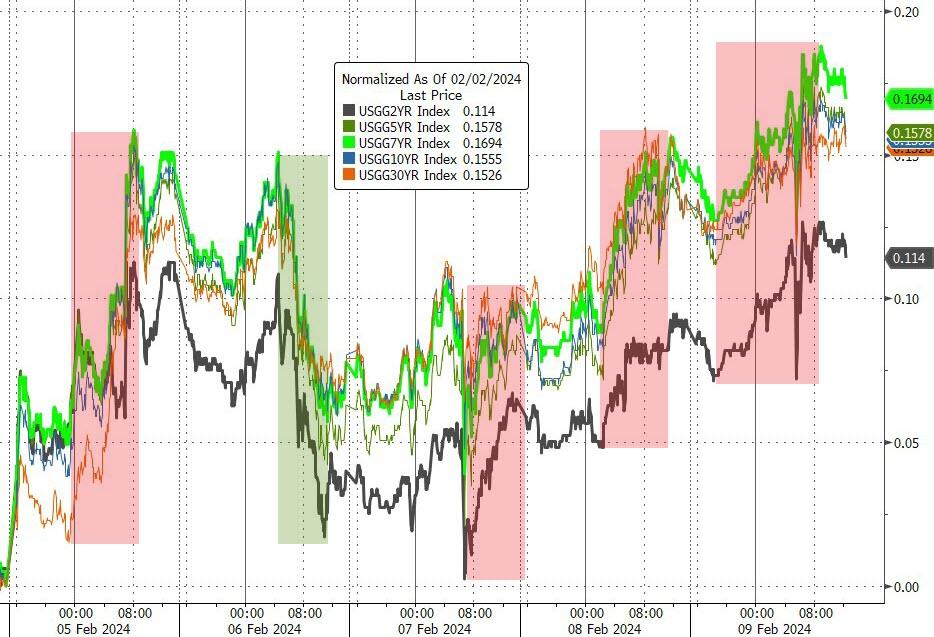
The government revised the December consumer price index down to 0.2%, from 0.3%, giving investors a reason to cheer. The core inflation rate, which excludes food and energy, was unchanged. Treasury yields dipped briefly after the news, but then bounced back to around 4.17% for the 10-year.

Next week, we’ll see if January’s inflation data can keep the party going. Tech stocks were the stars of the show today, pushing the S&P 500 over the 5,000 mark. Nvidia and Alphabet each gained about 1%, while Cloudflare soared 18% on stellar earnings and lifted the cloud sector with it.

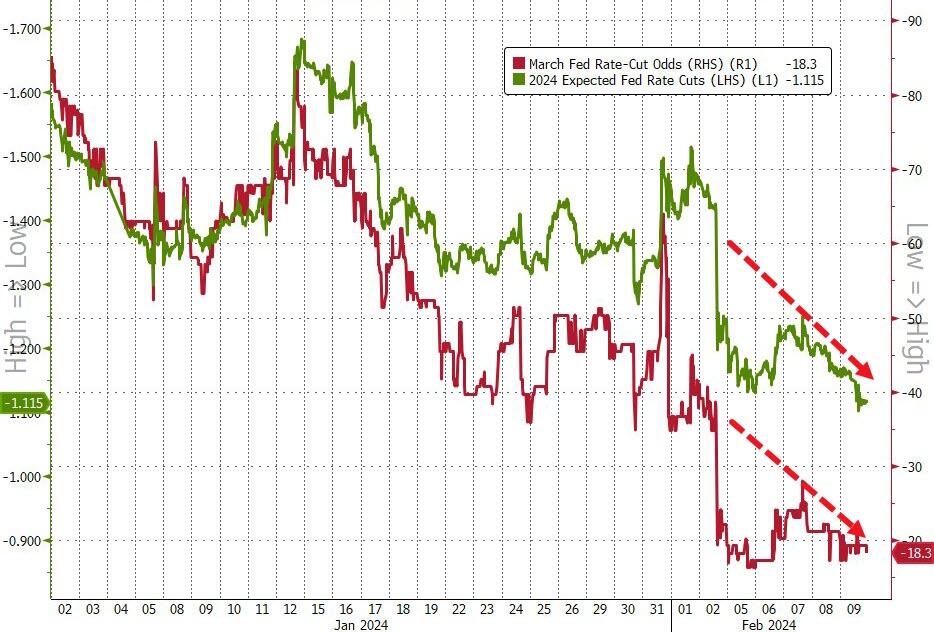
The market is acknowledging that the Fed will be less aggressive in cutting rates this year, with the odds of a March cut below 20% and less than five cuts priced in for 2024.

The dollar was steady this week, but edged up slightly, while gold edged down slightly. Oil prices bounced back to over $76, after last week’s plunge.

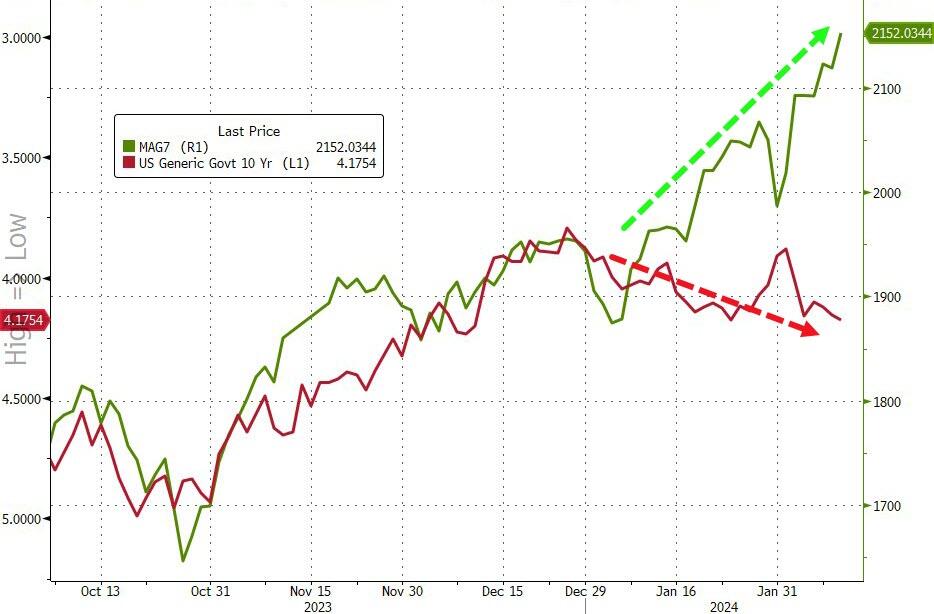
This chart shows the divergence between tech stocks and bond yields, which usually move in sync.

Is this a temporary glitch, or a sign that tech stocks are in a bubble that will burst when yields rise?

Read More

Weekly StatSheet For The ETF Tracker Newsletter – Updated Through 02/08/2024

Ulli ETF StatSheet Contact

ETF Data updated through Thursday, February 8, 2024

How to use this StatSheet:

  1. Out of the 1,800+ ETFs out there, I only pick the ones that trade over $5 million per day (HV ETFs), so you don’t get stuck with a lemon that nobody wants to buy or sell.
  1. Trend Tracking Indexes (TTIs)

These are the main indicators that tell you when to buy or sell Domestic and International ETFs (section 1 and 2). They do that by comparing their position to their long-term M/A (Moving Average). If they cross above, and stay there, it’s a green light to buy. If they fall below, and keep going, it’s a red light to sell. And to make sure you don’t lose your shirt if things go south, I also use a 12% trailing stop loss on all positions in these categories.

  1. All other investment areas don’t have a TTI and should be traded based on the position of each ETF relative to its own trend line (%M/A). That’s why I call them “Selective Buy.” In other words, if an ETF goes above its own trend line, you can buy it. But don’t forget to use a trailing sell stop of 12%, or less if you’re feeling nervous.

If some of these words sound like Greek to you, please check out the Glossary of Terms and new subscriber information in section 9.

  1. DOMESTIC EQUITY ETFs: BUY— since 11/21/2023

Click on chart to enlarge

This is our main compass, the Domestic Trend Tracking Index (TTI-green line in the above chart). It has broken above its long-term trend line (red) by +7.83% and is in “Buy” mode as posted.

Read More

Will CPI Revisions Shock The Market? S&P 500 Hovers Near 5,000

Ulli Market Commentary Contact

[Chart courtesy of MarketWatch.com]

  1. Moving the markets 

The major indexes barely budged today, except for the S&P 500, which flirted with the 5,000 mark for the first time in history. Small caps, on the other hand, had a blast and soared by more than 1% thanks to a huge short squeeze.

Traders were busy digesting earnings reports, with some big winners and losers. Disney soared 10% after smashing earnings expectations and raising its outlook. Arm, the chipmaker and designer, also jumped 55% after delivering a stellar earnings report and a rosy profit forecast.

Bond yields climbed higher today, with the 10-year Treasury note reaching 4.15%. This put a damper on stocks, even though most companies have reported better-than-expected earnings that have boosted Wall Street’s confidence in the economy and corporate growth.

This season, 77% of S&P companies have beaten their lowered earnings estimates, while 68% have surpassed their sales targets. These strong results, along with the relentless rise of mega cap tech stocks, have lifted the market in recent days. But not everyone is happy. Some traders are worried about the narrow leadership of 2023′s favorites.

They blame the Fed for dampening hopes of a rate cut in March, after Powell and his colleagues said it was not needed. NY Community Bank sank lower today, fueling fears of another banking crisis.

The MAG7 stocks were mostly flat, the dollar surged on higher yields and solid claims data, while gold was unchanged. Oil recovered from last week’s slump and jumped over 3.5% to above $76.

Traders are now eagerly awaiting tomorrow’s CPI revisions.

Will they shock the market with a huge upside surprise?

Read More