
- Moving the markets
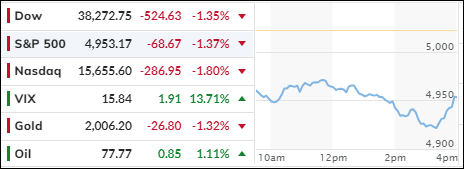
The market had a bad day on Tuesday, thanks to the inflation report for January that showed consumer prices rising more than expected. This sent bond yields soaring and made traders doubt that the Fed could lower interest rates as much as they hoped, which was a big reason why stocks were doing so well.
Small caps were the biggest losers, dropping 5% on their worst day since June 2020. The major indexes also fell but recovered some of their losses in the last hour.
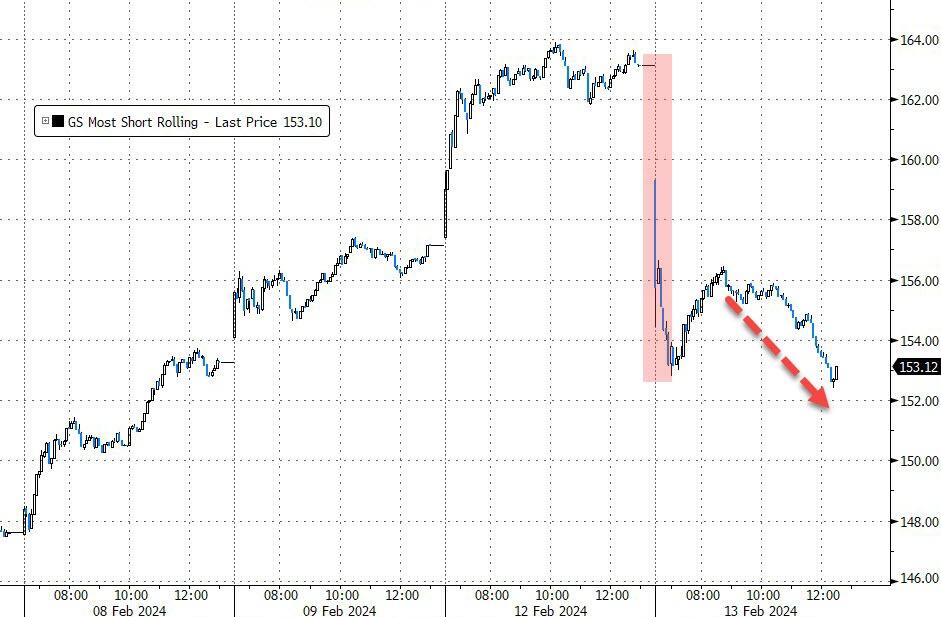
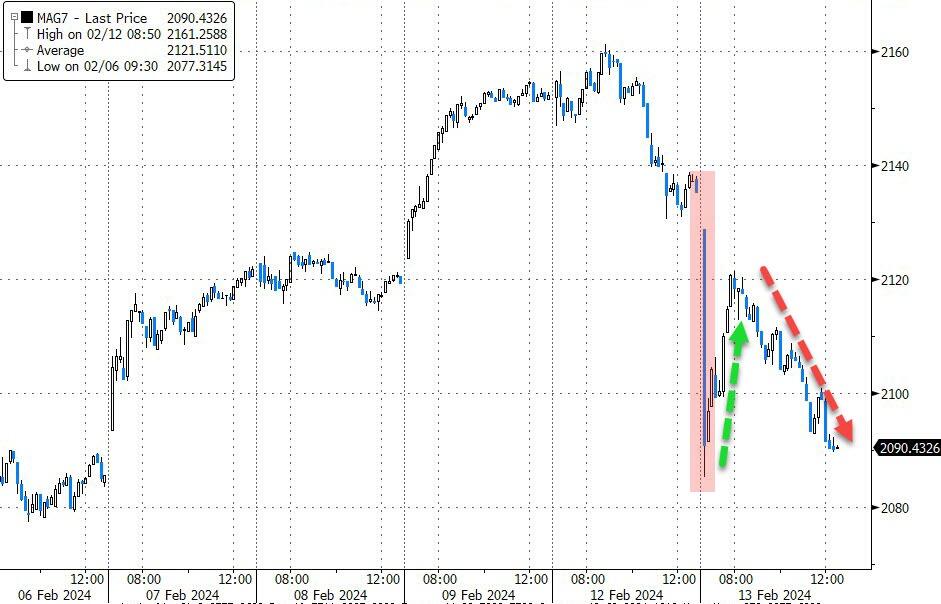
Short sellers had a good day, as the most hated stocks tanked over 6%, the largest drop since June 2022. Even the mighty Mag7, the seven tech giants that have been leading the market, took a hit and closed near their lows.
There was nowhere to hide, as all kinds of investments got hammered. This was a wake-up call that the market’s rally in the past few months was based on wishful thinking that inflation was under control and the Fed was ready to cut rates.
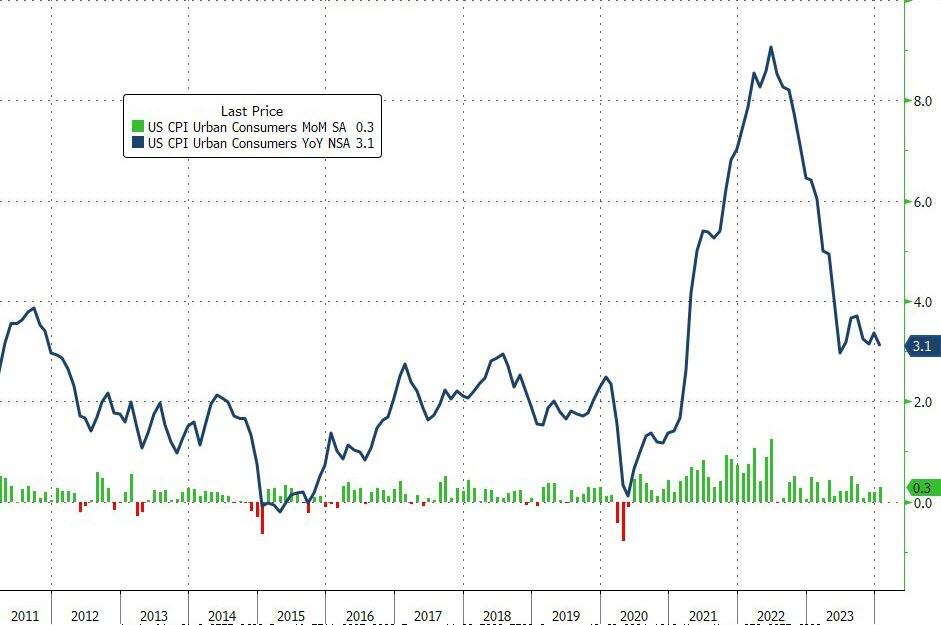
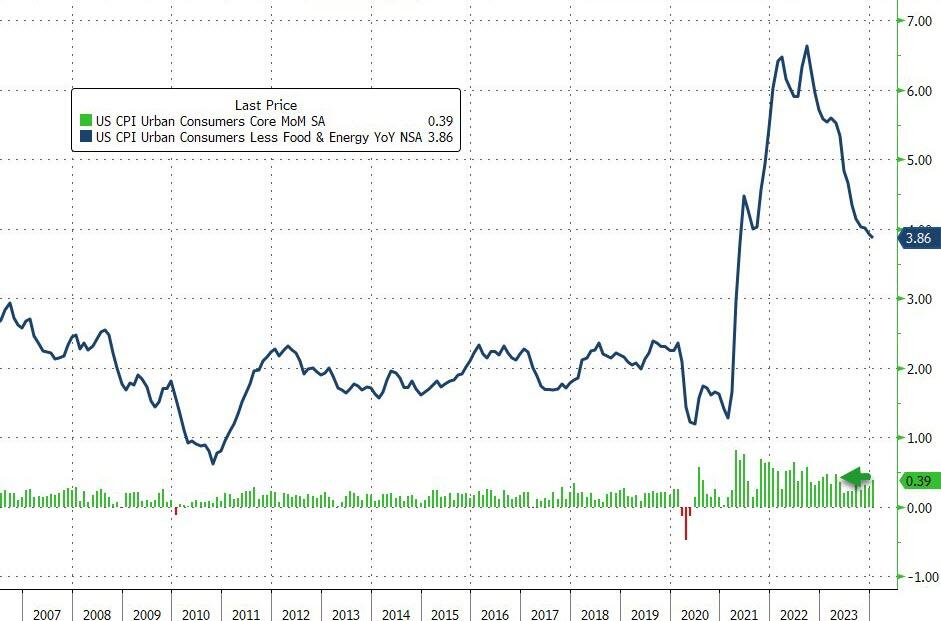
The consumer price index (CPI) rose 0.3% in January from December, and 3.1% from a year ago. Economists expected CPI to rise 0.2% and 2.9%, respectively. Core prices, which exclude food and energy and are the Fed’s preferred measure, rose 0.4% in January from December, and 3.86% from a year ago. Economists expected core prices to rise 0.3% and 3.7%, respectively.
Traders used this as an excuse to take some profits off the table, after the market had been going up almost non-stop this year. The CPI was slightly higher than expected, and showed that inflation was not going down, but up. Or at least that’s the pessimistic view.
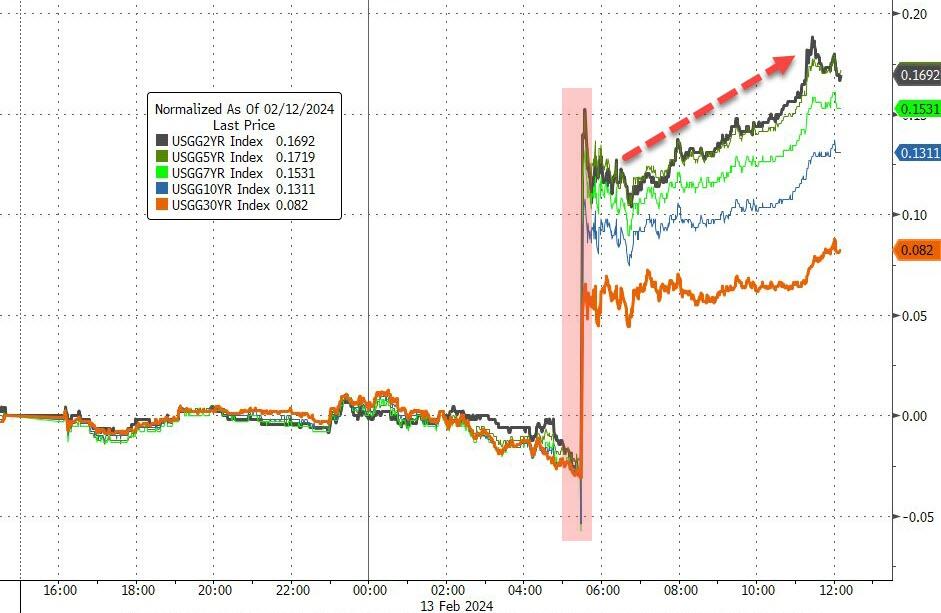
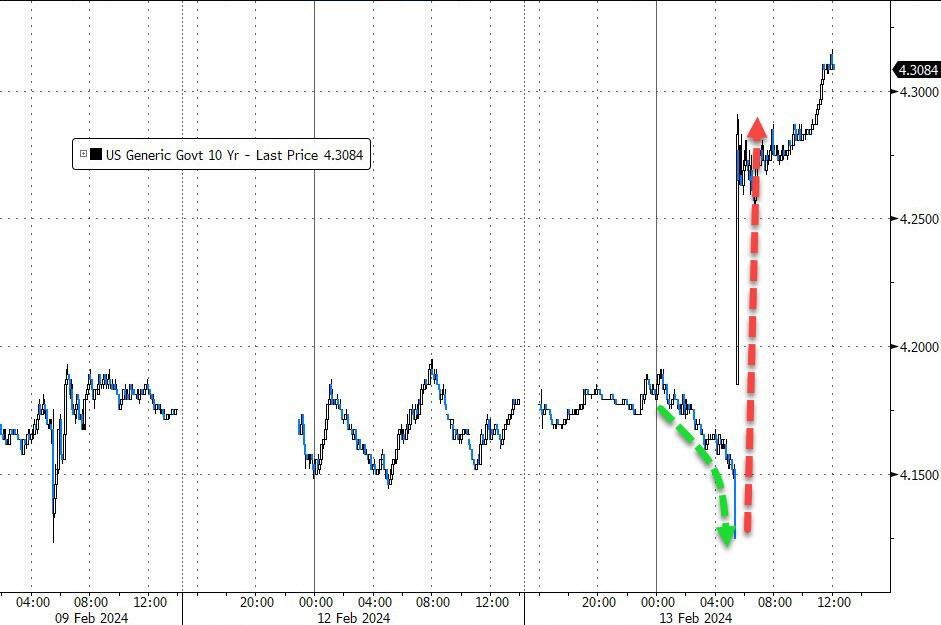
Bond yields jumped, with the 2-year Treasury yield rising above 4.6%, and the 10-year yield reaching 4.32% after the CPI data. Tech stocks like Microsoft and Amazon, which have been driving the market to record highs as rates fell, led the losses today.
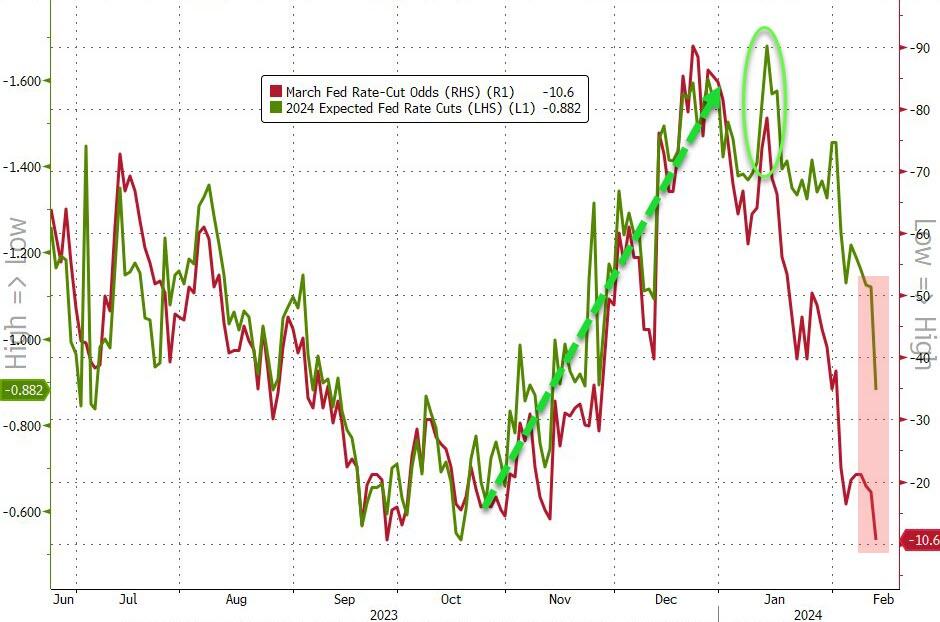
Rate cut odds got slashed, with March now having less than 10% chance and 2024 now pricing in less than 4 total cuts.
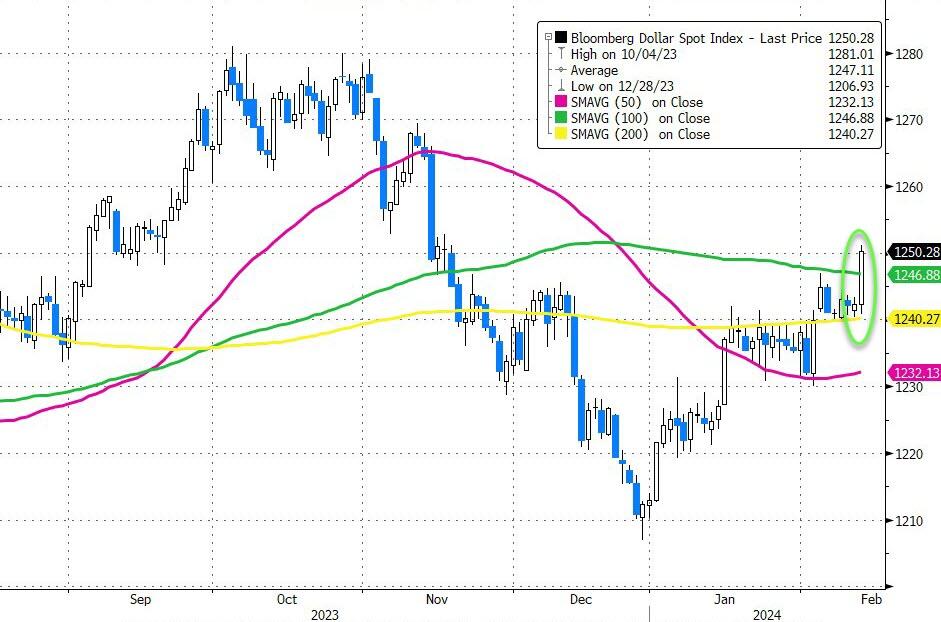
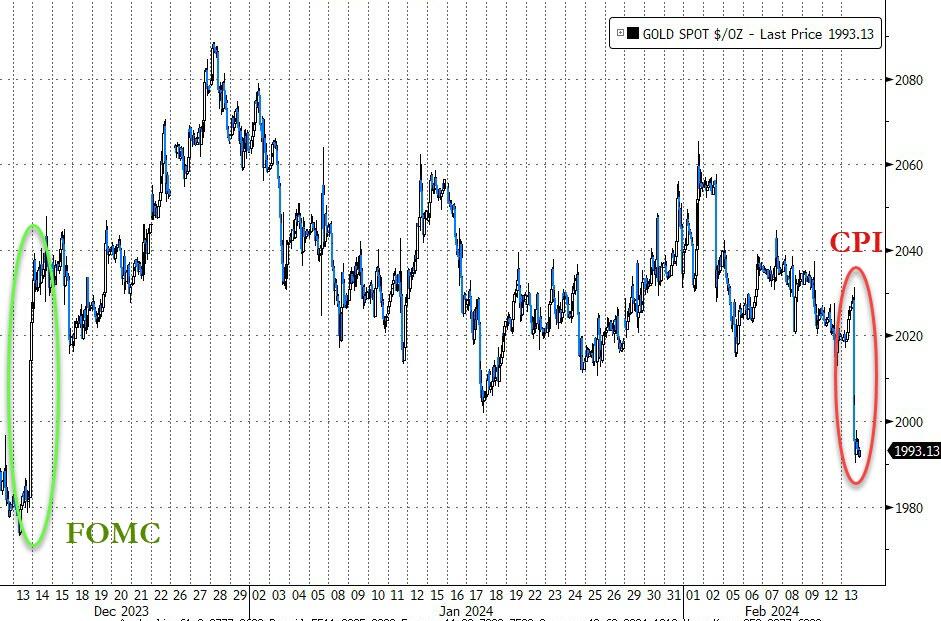
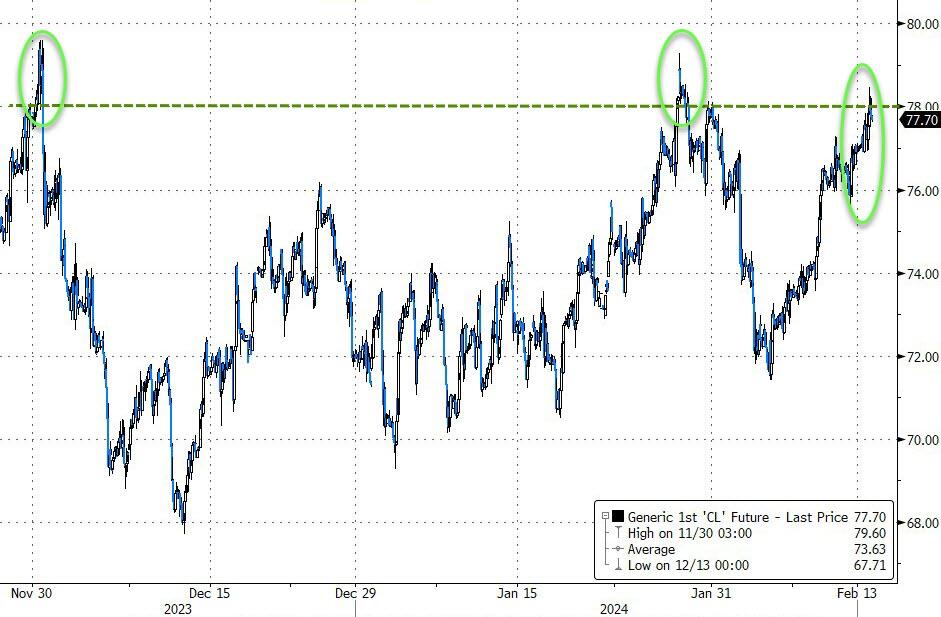
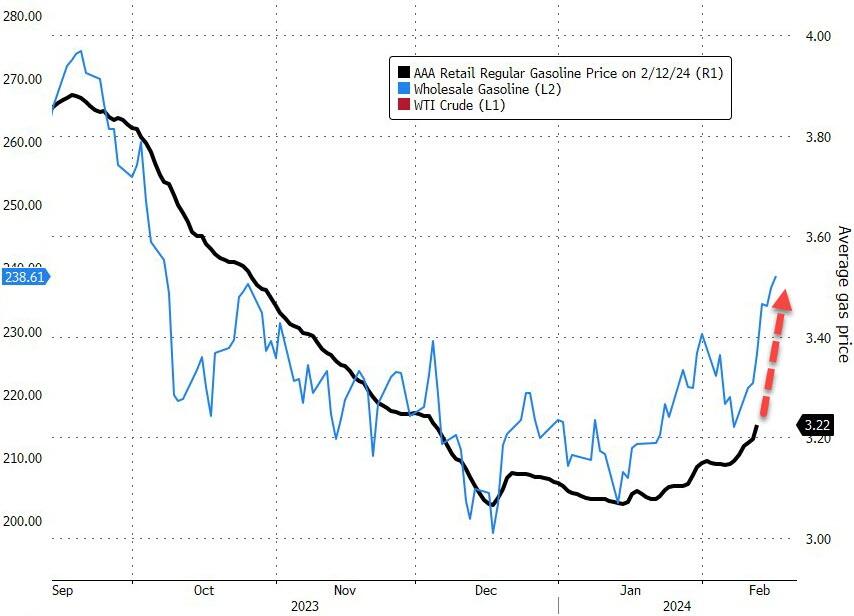
As bond yields rose, the dollar followed suit, gold went the opposite way but stayed above its 2k level. Oil prices climbed, which will not help the next CPI reading, as the Fed will see that gas prices are about to rise.
Traders are now wondering if today’s sell-off was a one-time event or a sign of more trouble ahead.
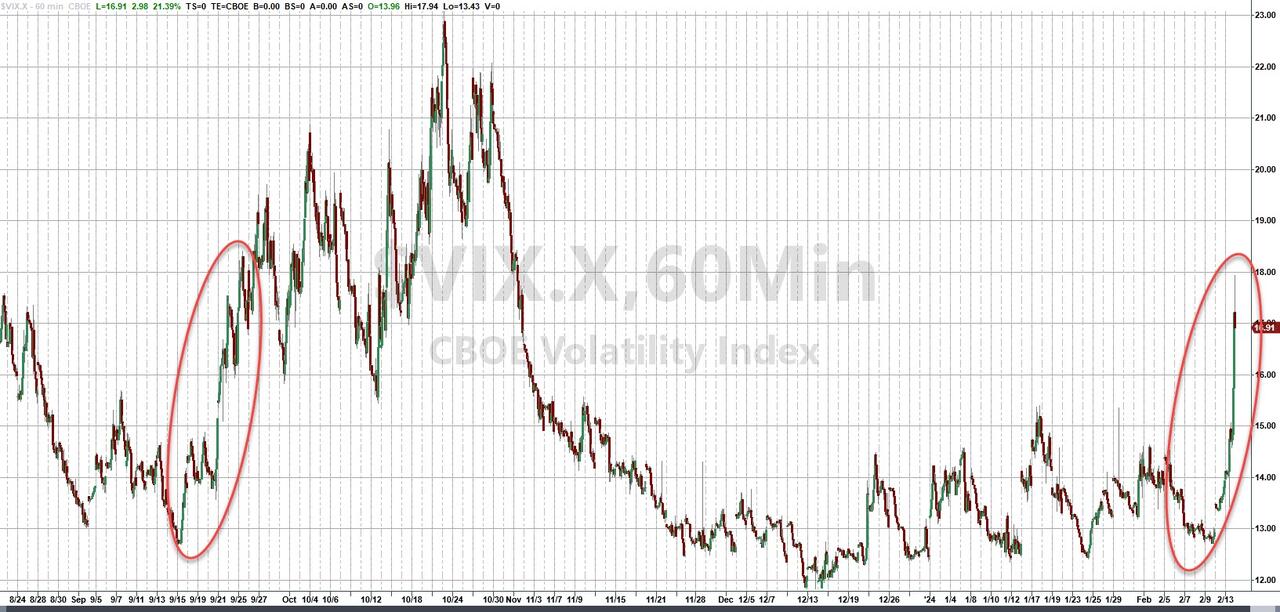
The VIX (volatility index) spiked almost 18%—will it keep going up tomorrow?
2. Current “Buy” Cycles (effective 11/21/2023)
Our Trend Tracking Indexes (TTIs) have both crossed their trend lines with enough strength to trigger new “Buy” signals. That means, Tuesday, 11/21/2023, was the official date for these signals.
If you want to follow our strategy, you should first decide how much you want to invest based on your risk tolerance (percentage of allocation). Then, you should check my Thursday StatSheet and Saturday’s “ETFs on the Cutline” report for suitable ETFs to buy.
3. Trend Tracking Indexes (TTIs)
The market was disappointed by the high inflation report for January, which showed that consumer prices rose more than expected. This dampened the hopes for lower interest rates and hurt the performance of all types of investments.
Our TTIs, which measure the overall direction of the market, also declined but stayed above their critical levels that separate a positive from a negative trend.
This is how we closed 2/13/2024:
Domestic TTI: +6.53% above its M/A (prior close +8.35%)—Buy signal effective 11/21/2023.
International TTI: +6.36% above its M/A (prior close +7.32%)—Buy signal effective 11/21/2023.
All linked charts above are courtesy of Bloomberg via ZeroHedge.
———————————————————-
WOULD YOU LIKE TO HAVE YOUR INVESTMENTS PROFESSIONALLY MANAGED?
Do you have the time to follow our investment plans yourself? If you are a busy professional who would like to have his portfolio managed using our methodology, please contact me directly to get more details.
—————————————————————-
Contact Ulli