
ETF Tracker StatSheet
You can view the latest version here.
S&P 500 TOPS 5,000 ON LOWER INFLATION, BUT TECH-BOND GAP RAISES QUESTIONS
- Moving the markets
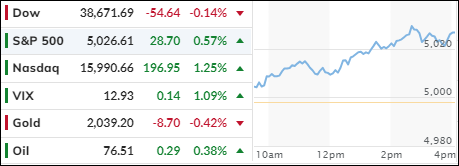
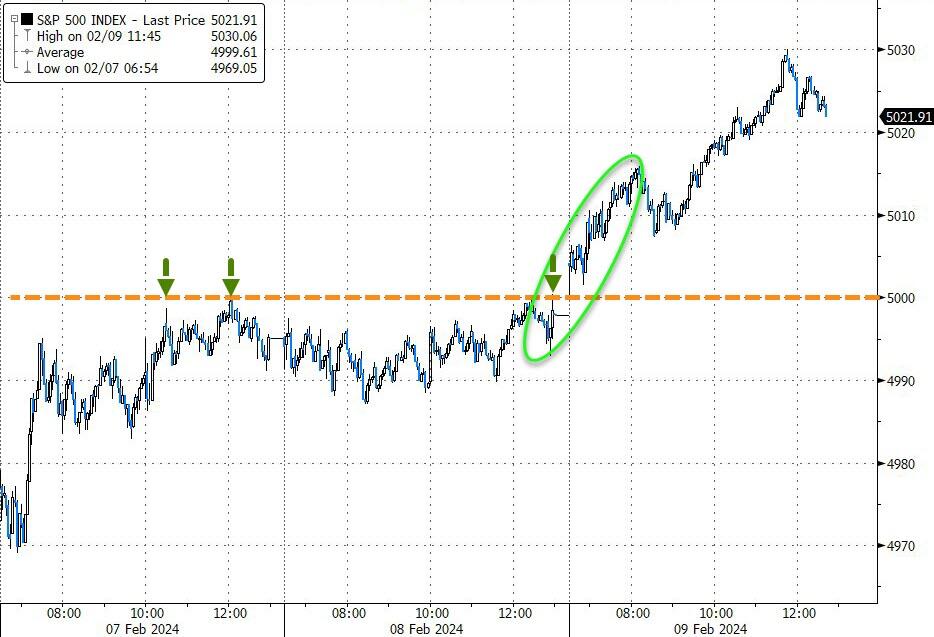
The S&P 500 finally cracked the 5,000 mark today, thanks to a belated Christmas gift from the government: a lower inflation rate for December.
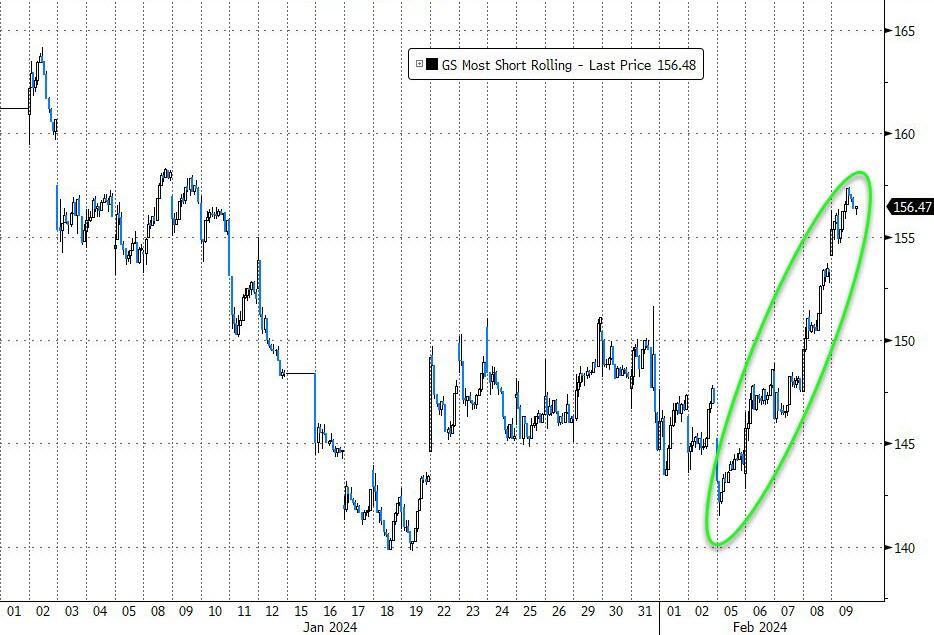
The index had flirted with the milestone on Thursday, but only sealed the deal today. Small Caps had a big week, squeezing the shorts and beating the Nasdaq (and the S&P) in the race for returns. The Dow, on the other hand, was a snooze fest, ending the week flat.
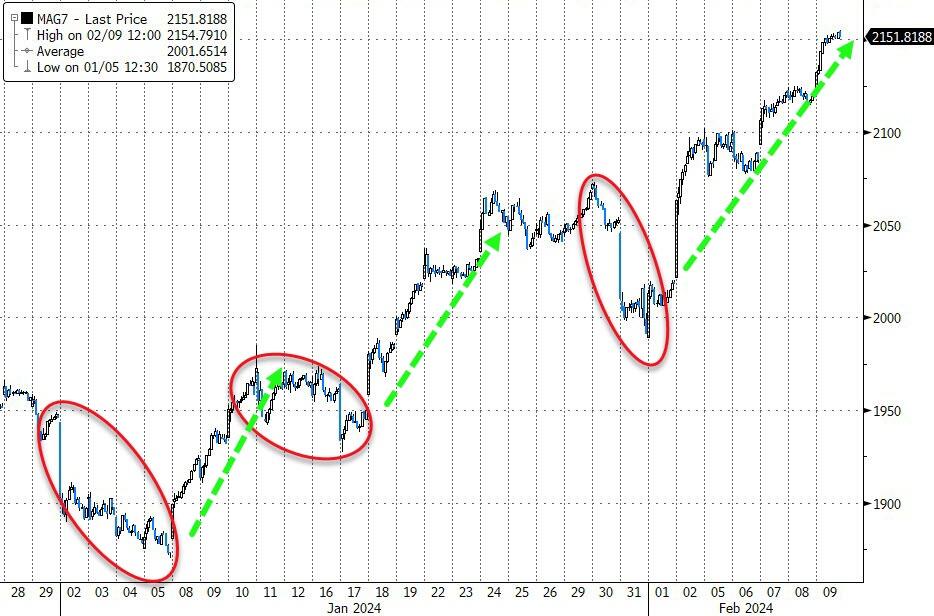
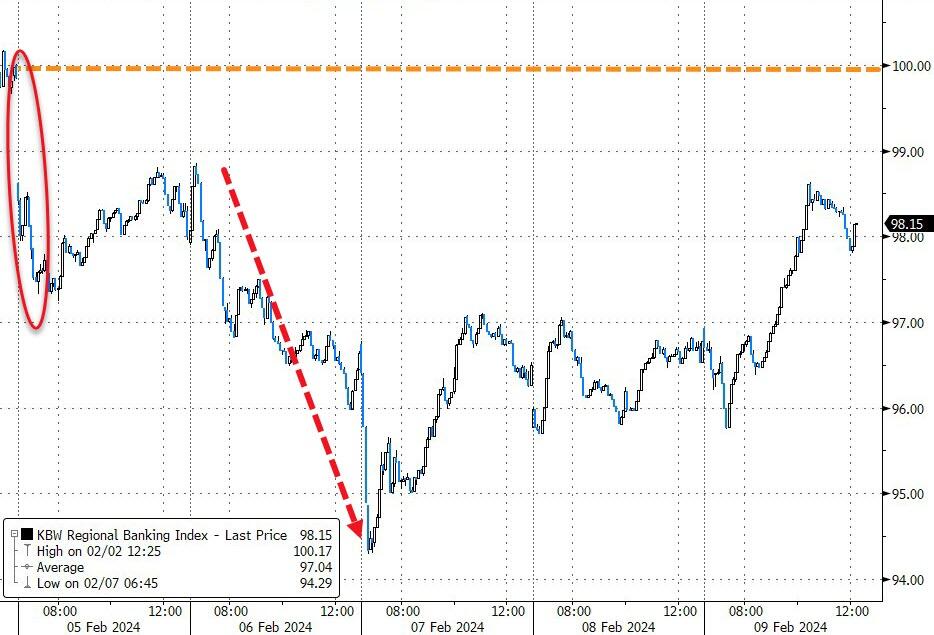
The MAG7 stocks continued their winning streak for the fifth week in a row, while Regional Bank stocks had a rough ride, but recovered from their mid-week slump.
The market rally has been fueled by strong earnings, tame inflation, and a robust economy, making this the fifth week of gains in a row. But don’t pop the champagne just yet because today’s rally was mostly driven by tech stocks, which could be a sign of trouble ahead.
The government revised the December consumer price index down to 0.2%, from 0.3%, giving investors a reason to cheer. The core inflation rate, which excludes food and energy, was unchanged. Treasury yields dipped briefly after the news, but then bounced back to around 4.17% for the 10-year.
Next week, we’ll see if January’s inflation data can keep the party going. Tech stocks were the stars of the show today, pushing the S&P 500 over the 5,000 mark. Nvidia and Alphabet each gained about 1%, while Cloudflare soared 18% on stellar earnings and lifted the cloud sector with it.
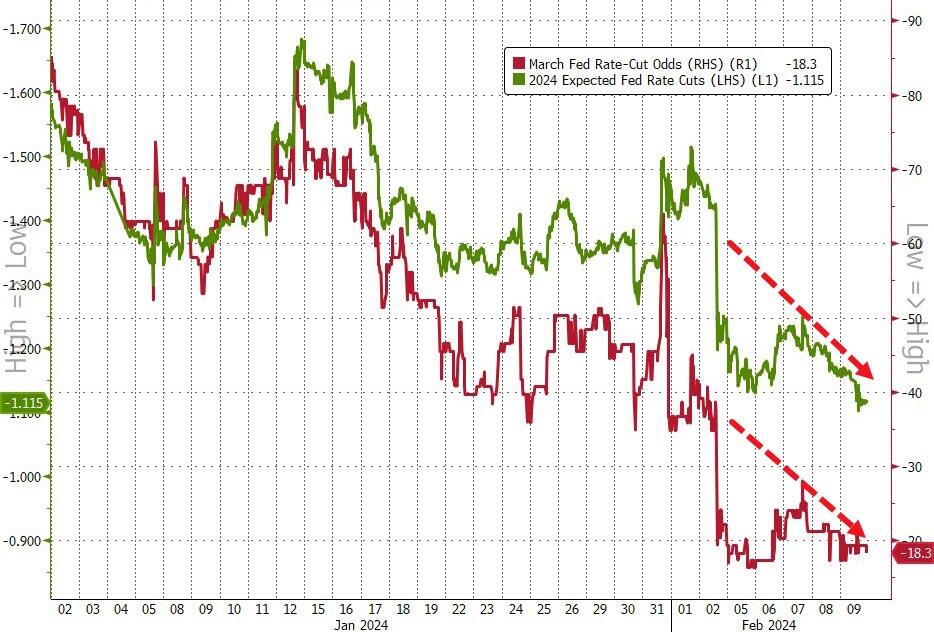
The market is acknowledging that the Fed will be less aggressive in cutting rates this year, with the odds of a March cut below 20% and less than five cuts priced in for 2024.
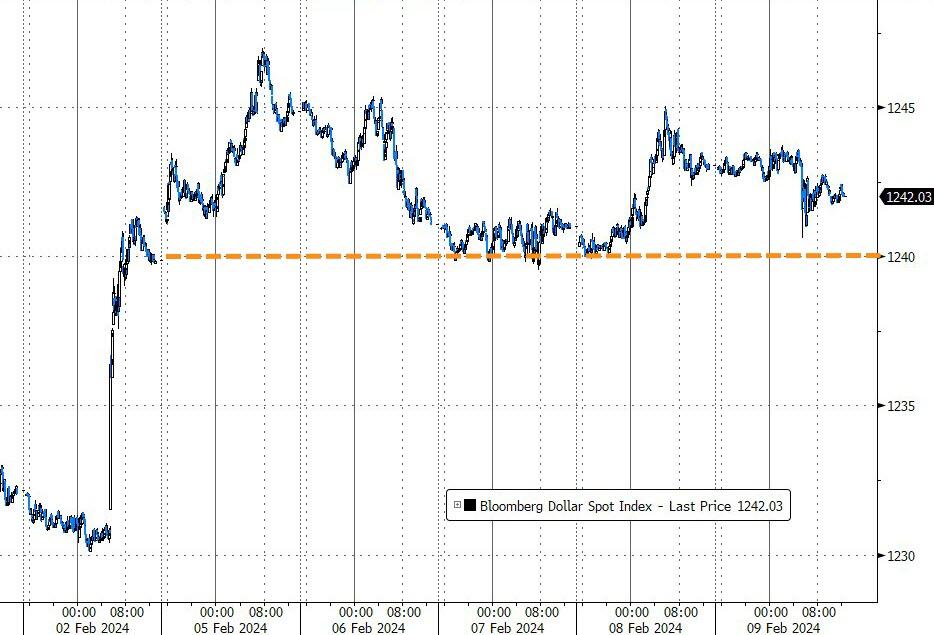
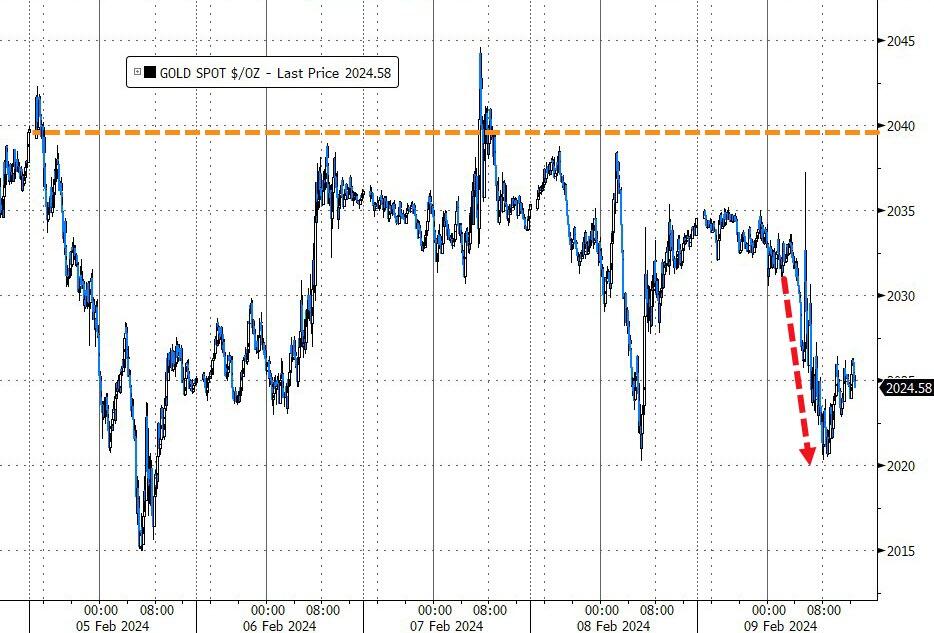
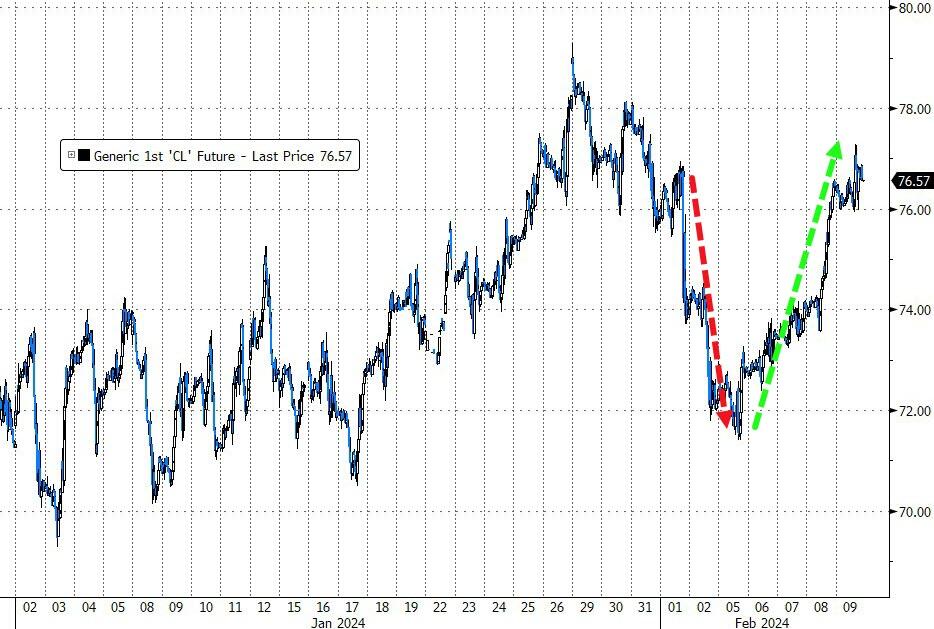
The dollar was steady this week, but edged up slightly, while gold edged down slightly. Oil prices bounced back to over $76, after last week’s plunge.
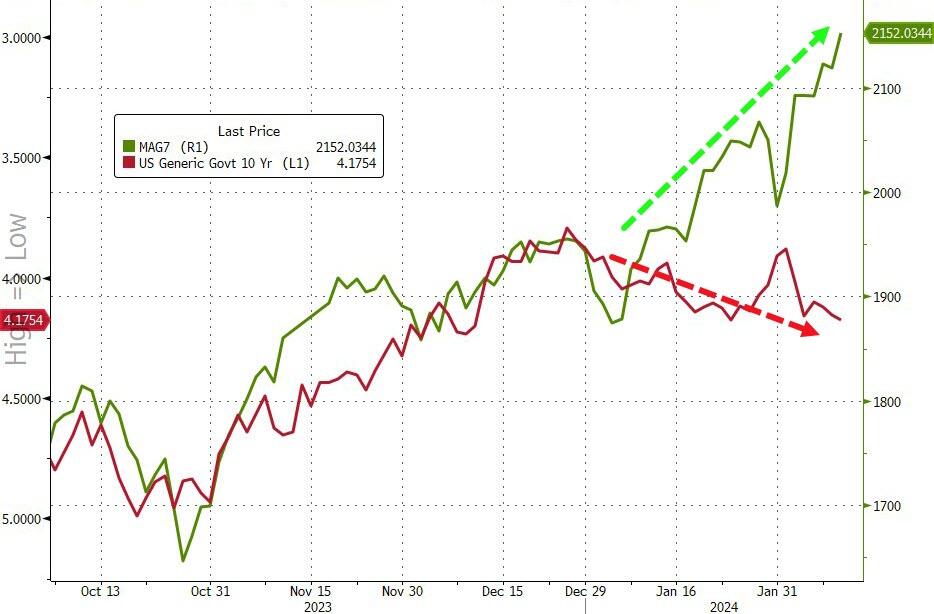
This chart shows the divergence between tech stocks and bond yields, which usually move in sync.
Is this a temporary glitch, or a sign that tech stocks are in a bubble that will burst when yields rise?
2. Current “Buy” Cycles (effective 11/21/2023)
Our Trend Tracking Indexes (TTIs) have both crossed their trend lines with enough strength to trigger new “Buy” signals. That means, Tuesday, 11/21/2023, was the official date for these signals.
If you want to follow our strategy, you should first decide how much you want to invest based on your risk tolerance (percentage of allocation). Then, you should check my Thursday StatSheet and Saturday’s “ETFs on the Cutline” report for suitable ETFs to buy.
3. Trend Tracking Indexes (TTIs)
The S&P 500 reached a new record high of over 5,000 points, as most stocks ended the day with gains. However, the best performers of the week were the Small Caps, which are companies with smaller market values.
Our TTIs, which measure the overall direction of the market, declined slightly, because the tech sector was the main driver of today’s rally.
This is how we closed 2/09/2024:
Domestic TTI: +7.60% above its M/A (prior close +7.83%)—Buy signal effective 11/21/2023.
International TTI: +6.89% above its M/A (prior close +7.25%)—Buy signal effective 11/21/2023.
All linked charts above are courtesy of Bloomberg via ZeroHedge.
———————————————————-
WOULD YOU LIKE TO HAVE YOUR INVESTMENTS PROFESSIONALLY MANAGED?
Do you have the time to follow our investment plans yourself? If you are a busy professional who would like to have his portfolio managed using our methodology, please contact me directly to get more details.
—————————————————————-
Contact Ulli