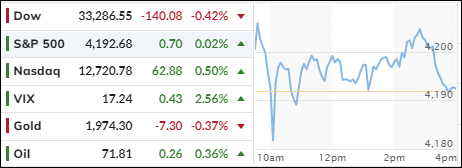
The stock market was indecisive today as investors waited for the outcome of the debt ceiling talks. The US government is running out of time and money to avoid a default that could shake the global economy. President Biden and House Minority Leader McCarthy are meeting today to try to break the impasse, but they disagree on how to cut spending.
Meanwhile, some Fed officials sounded hawkish on inflation and interest rates. Kashkari suggested that the Fed could resume its tightening cycle in July, if it skips June, while Bullard urged the Fed to fight inflation now and not repeat the mistakes of the 1970s.
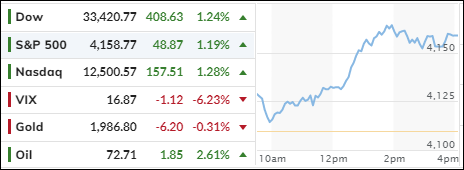
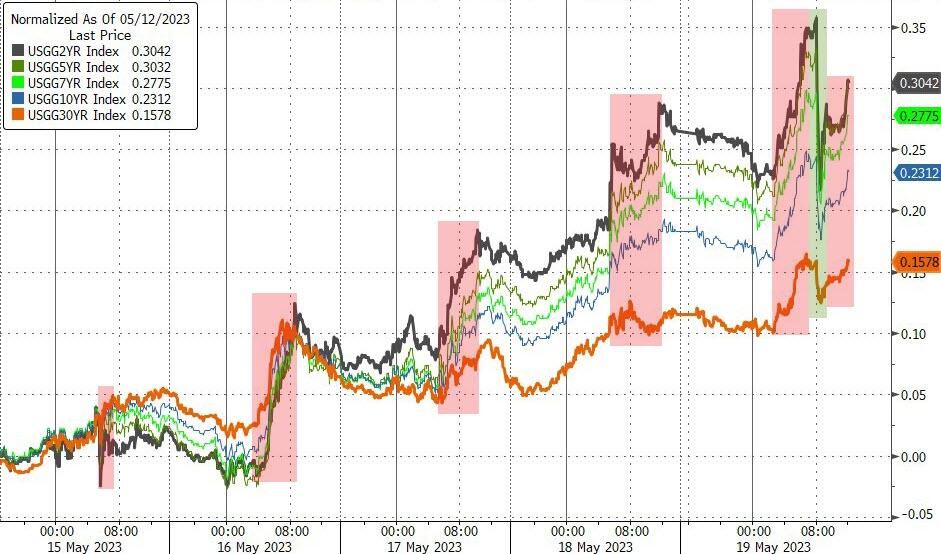
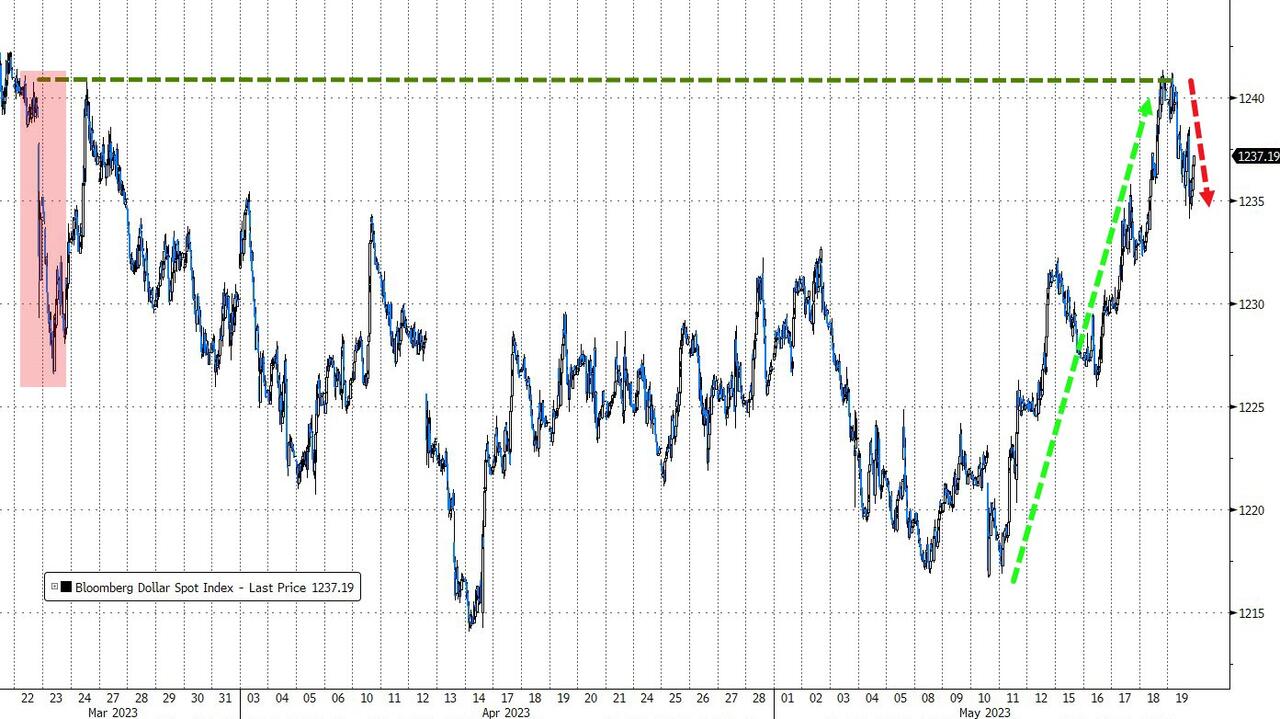
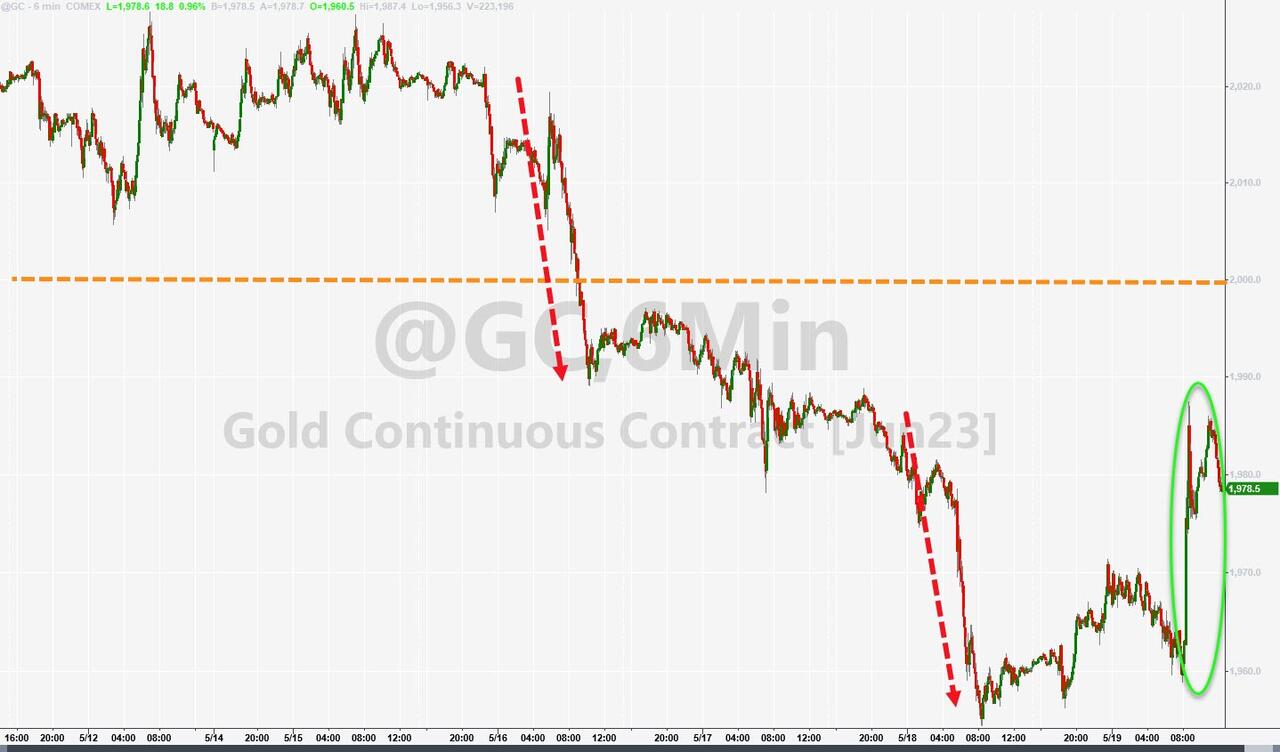
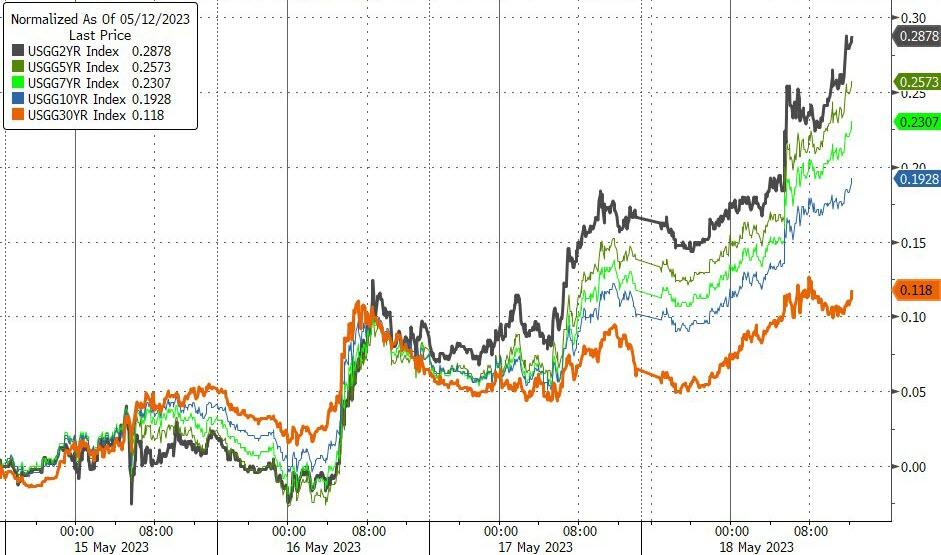
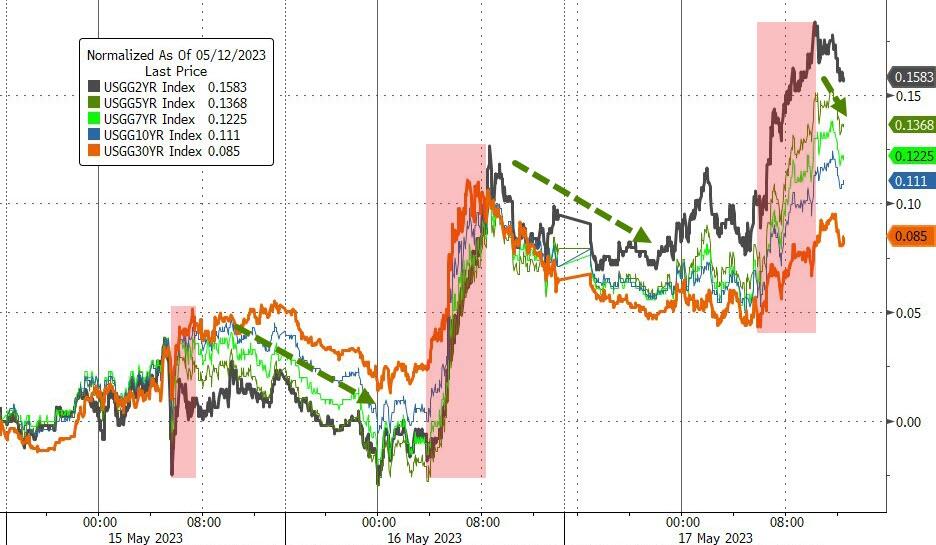
The bond market reacted to the hawkish tone by pushing yields higher for the seventh day in a row, the longest streak since September 2022. The dollar also gained strength, while gold lost some shine.
Below, you can evaluate the latest High-Volume ETF Cutline report, which shows how far above or below their respective long-term trend lines (39-week SMA) my currently tracked ETFs are positioned.
This report covers the HV ETF Master List from Thursday’s StatSheet and includes 312 High Volume ETFs, defined as those with an average daily volume of more than $5 million, of which currently 173 (last report: 180) are hovering in bullish territory. The yellow line separates those ETFs that are positioned above their trend line (%M/A) from those that have dropped below it.
In case you are not familiar with some of the terminology used in the reports, please read the Glossary of Terms. If you missed the original post about the Cutline approach, you can read it here.
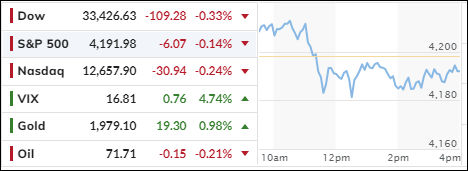
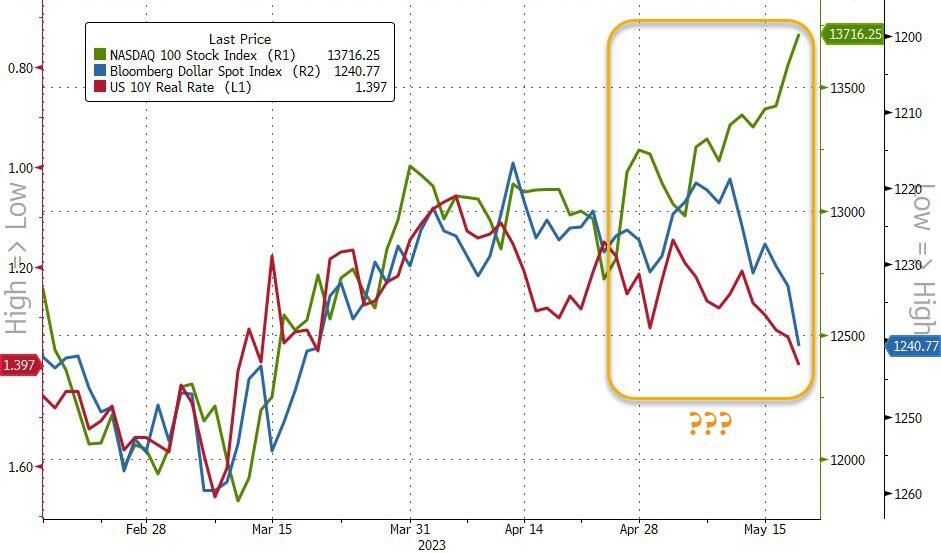
The markets went crazy this week, jumping up and down on every rumor of a debt ceiling deal. The Nasdaq (small caps) was especially nuts, soaring to new highs even as interest rates spiked. What were they thinking?
Their bubble burst today, when the Republicans walked out of the talks, throwing cold water on the hopes of avoiding a US default. Oops.
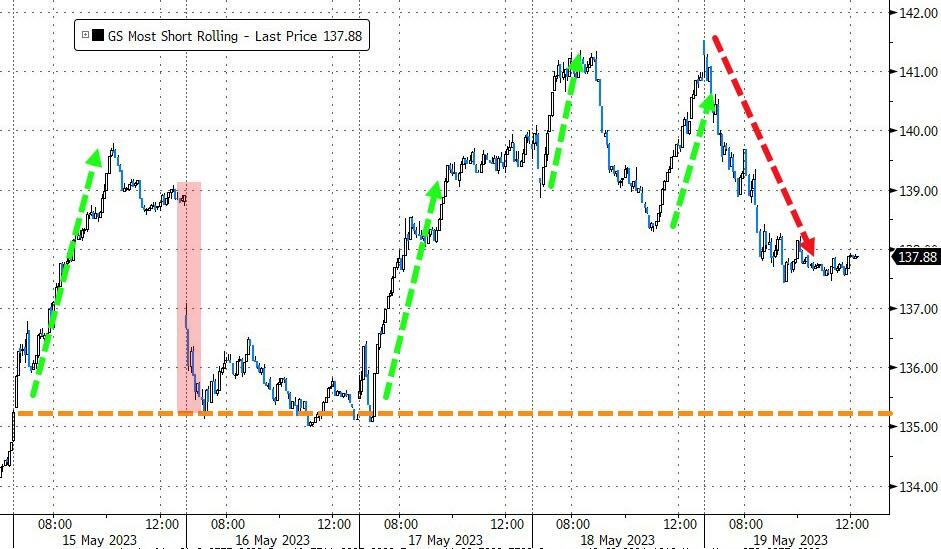
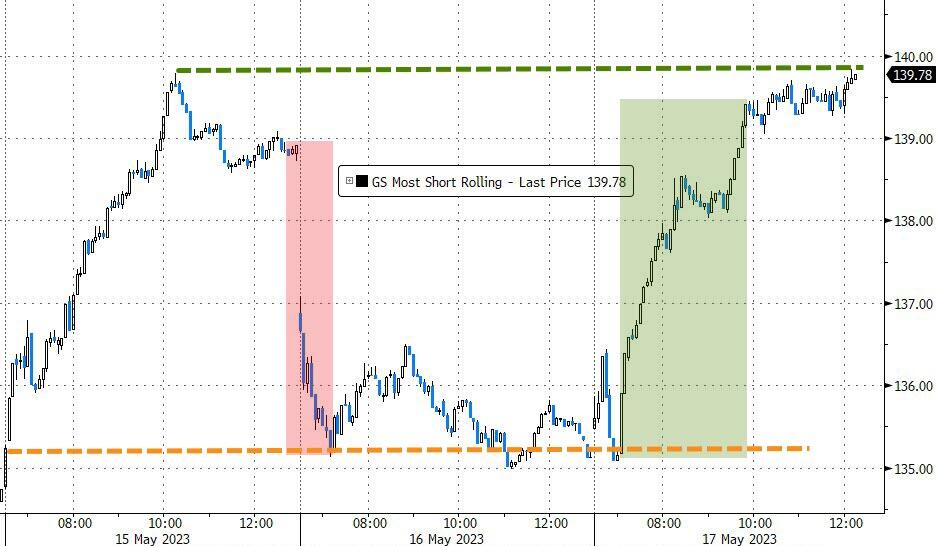
ZeroHedge had it right: there will be no deal until the market freaks out. And today’s rally was just a massive Nasdaq squeeze, the biggest since 2014!
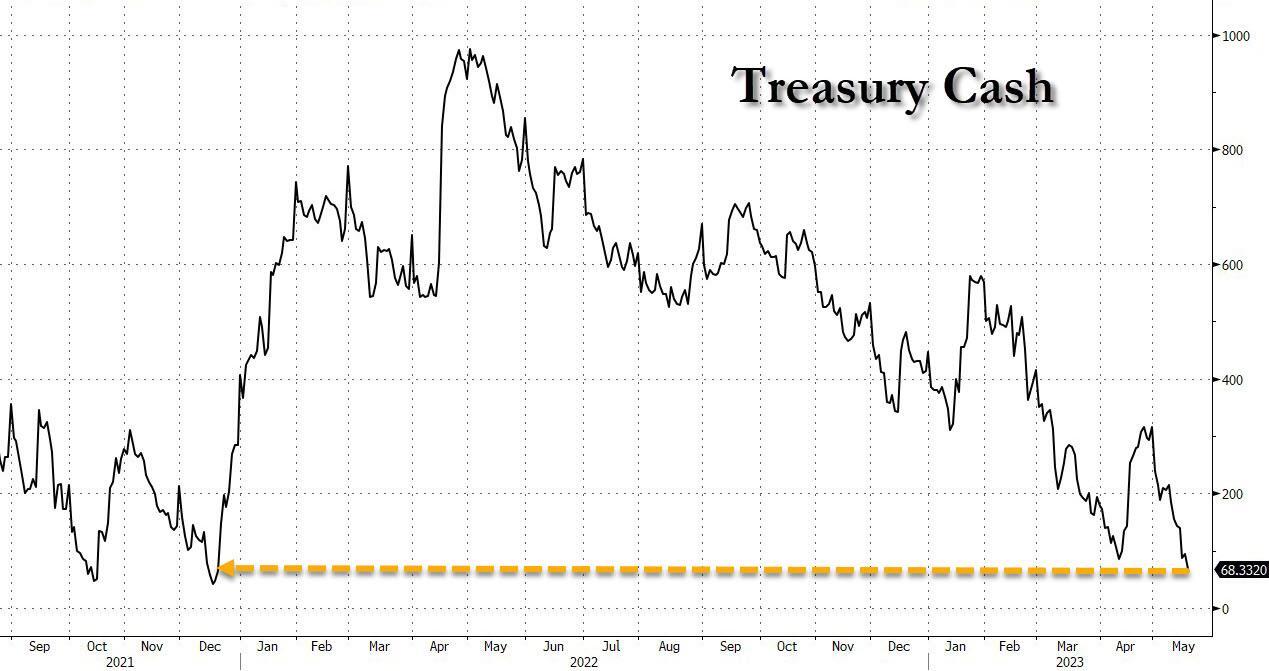
Meanwhile, the Treasury is running out of cash fast, with only $18 billion left before hitting the $50 billion danger zone. Yellen tried to calm the nerves by saying we might see more bank mergers soon. Yeah, right. That means more banks are going under!
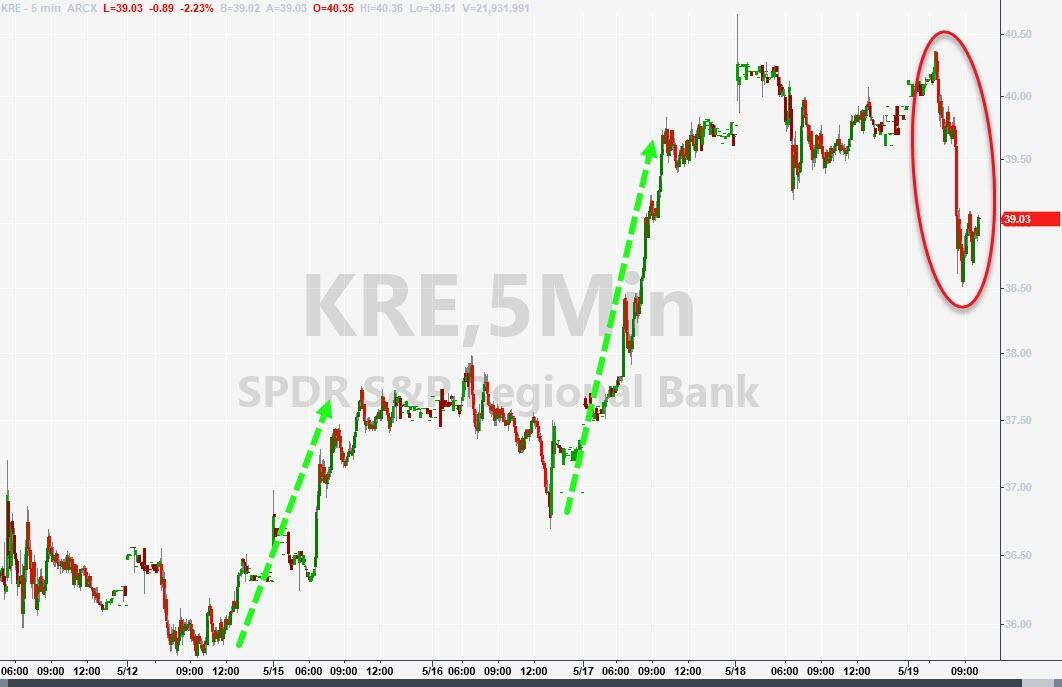
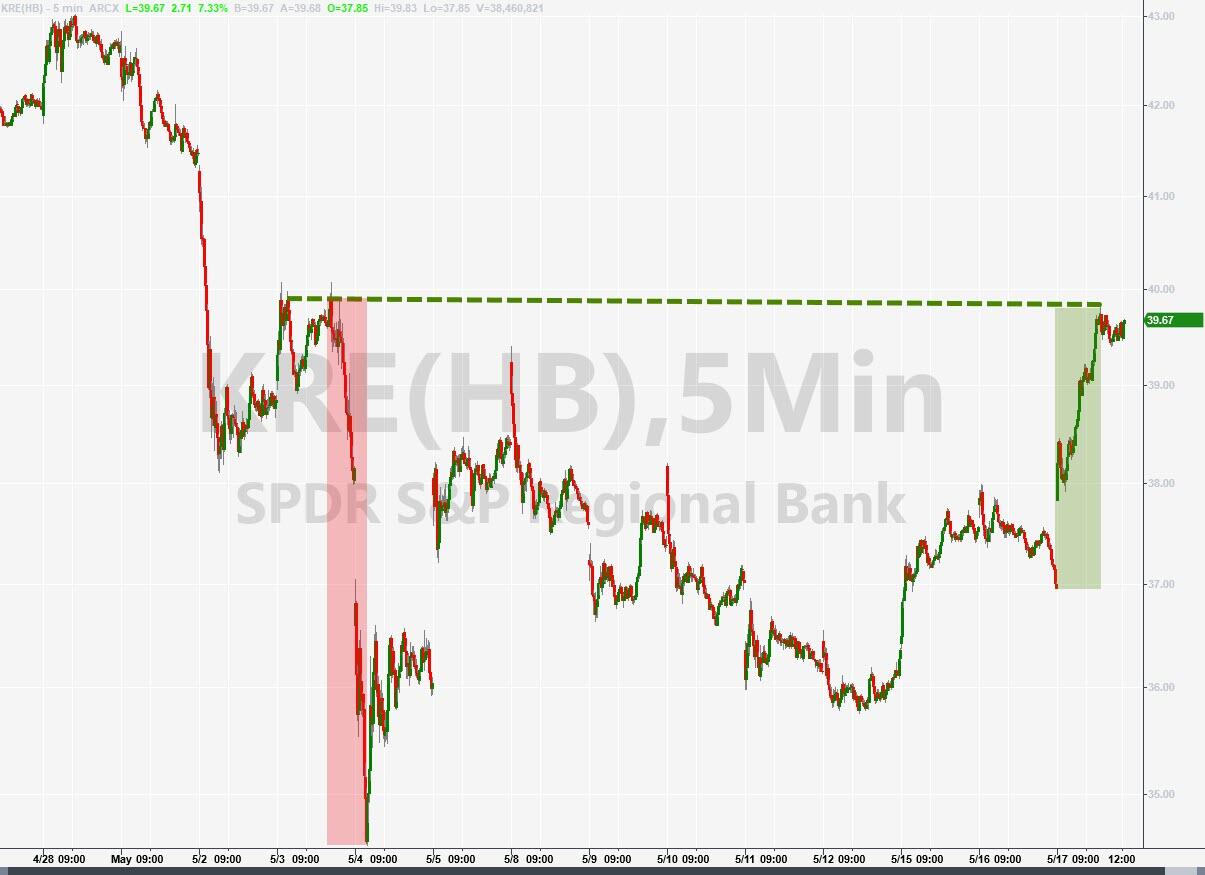
No wonder bank stocks tanked today, with the Regional Banking ETF KRE losing over 2%. That index is down -33.41% YTD, even after this week’s 8% bounce.
This week’s rally was also helped by a huge short-squeeze, but that ran out of steam today. Tech stocks did well, but retail stocks did poorly, signaling weak consumer spending ahead. This is not new. We saw this in 2011, and the S&P 500 ended up losing big.
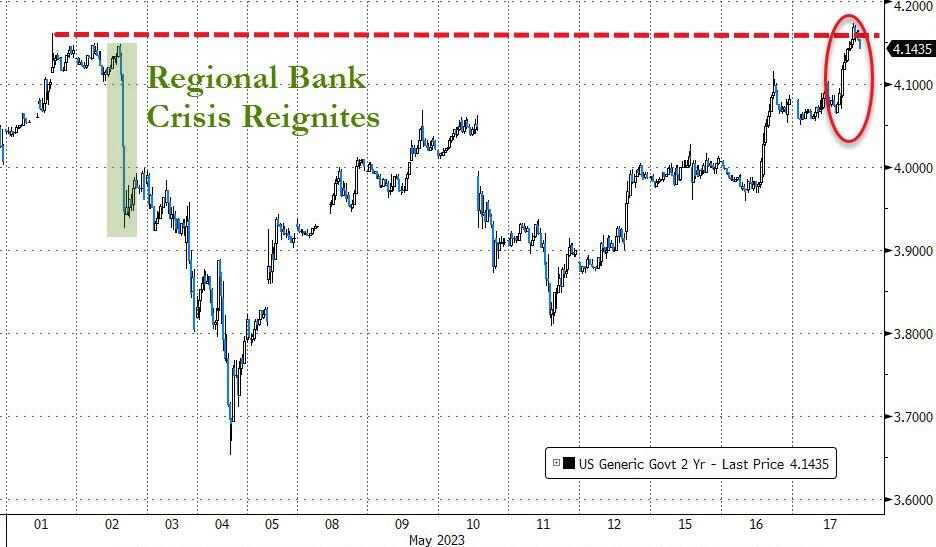
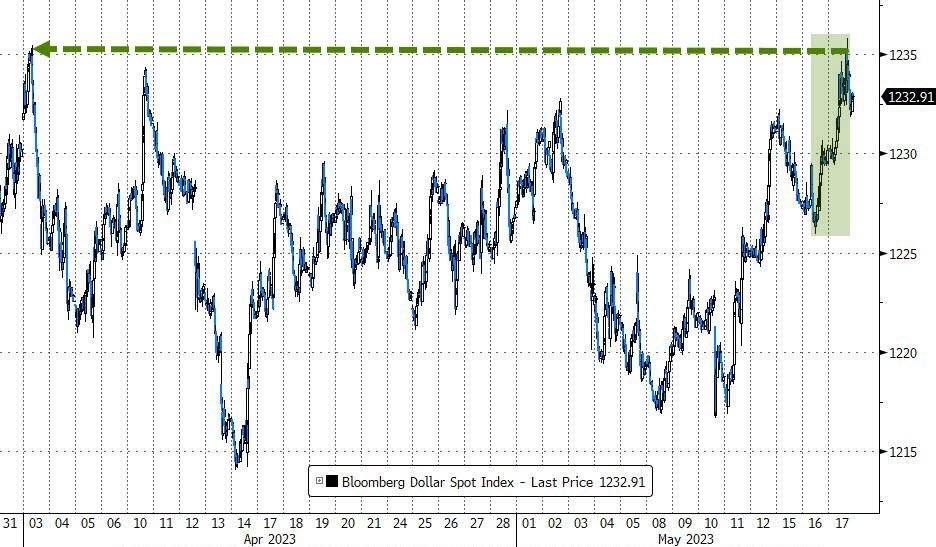
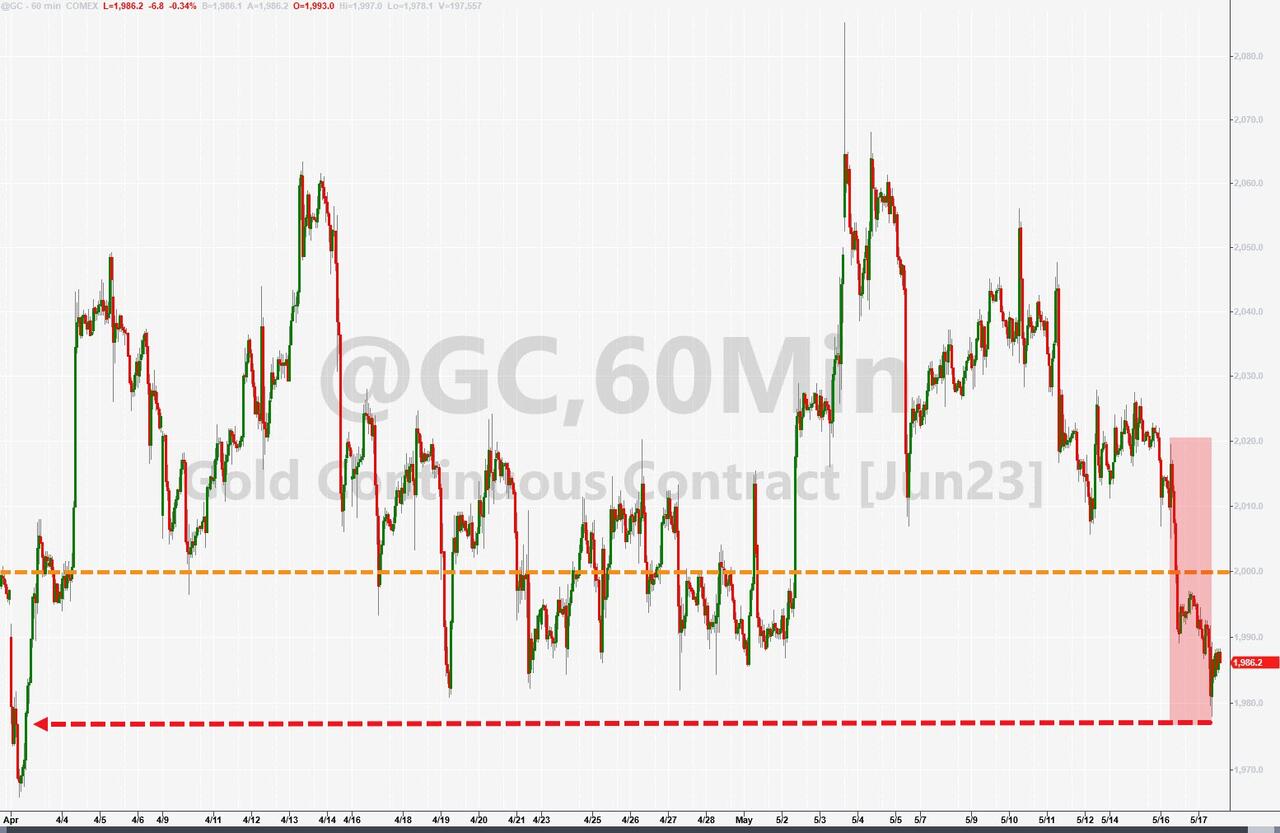
Bond yields rose sharply this week, with the 2-year hitting its highest level since June 2022, as ZH noted. The US Dollar followed suit but retreated today. Gold had a rough week, but recovered today with a nearly 1% gain, as some sanity returned to the markets.
The bottom line: don’t get too excited about stocks. The mood could change in a heartbeat from optimism to pessimism.
1. From the universe of over 1,800 ETFs, I have selected only those with a trading volume of over $5 million per day (HV ETFs), so that liquidity and a small bid/ask spread are assured.
2. Trend Tracking Indexes (TTIs)
Buy or Sell decisions for Domestic and International ETFs (section 1 and 2), are made based on the respective TTI and its position either above or below its long-term M/A (Moving Average). A crossing of the trend line from below accompanied by some staying power above constitutes a “Buy” signal. Conversely, a clear break below the line constitutes a “Sell” signal. Additionally, I use a 12% trailing stop loss on all positions in these categories to control downside risk.
3. All other investment arenas do not have a TTI and should be traded based on the position of the individual ETF relative to its own respective trend line (%M/A). That’s why those signals are referred to as a “Selective Buy.” In other words, if an ETF crosses its own trendline to the upside, a “Buy” signal is generated. Here too, I recommend trailing sell stop of 12%, or less, depending on your risk tolerance.
If you are unfamiliar with some of the terminology, please see Glossary of Termsand new subscriber information in section 9.
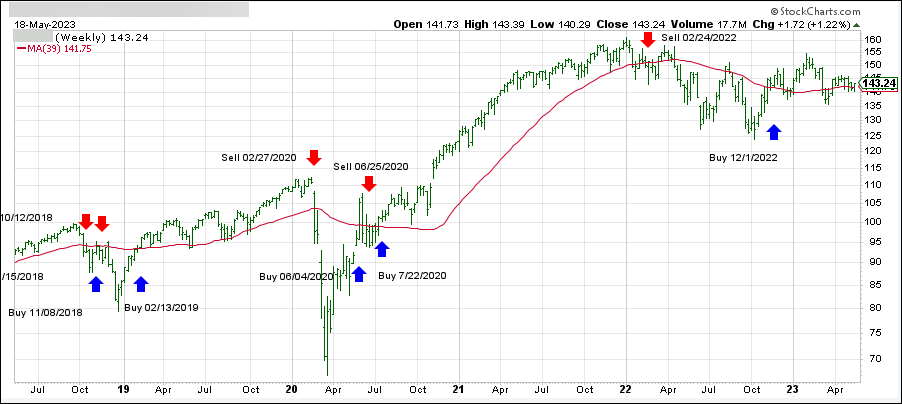
1. DOMESTIC EQUITY ETFs: BUY — since 12/01/2022
Click on chart to enlarge
Our main directional indicator, the Domestic Trend Tracking Index (TTI-green line in the above chart) has just climbed back above its long-term trend line (red) by +0.97% and remains in “Buy” mode for the time being.
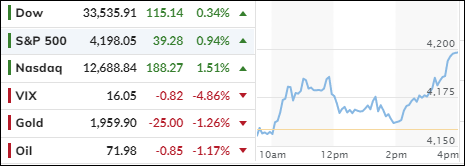
The stock market had a strong finish on Wednesday, overcoming a sluggish start and a midday dip. The S&P 500 turned positive for the month, while the Dow trailed behind the Nasdaq. The rally was fueled by optimism about a debt ceiling deal, as House Speaker McCarthy signaled progress in talks with President Biden.
However, not everything was rosy on Wall Street. The Fed officials sounded hawkish, warning that inflation was too high and that rate hikes were still on the table. The bond market took notice, sending yields higher and hurting gold prices. The economic data was also mixed, with weak indicators for housing and business activity, but strong numbers for jobless claims and Walmart earnings.
The Nasdaq seemed to ignore the rising bond yields, which usually weigh on growth stocks. This divergence could spell trouble down the road, as one of them will have to adjust to reality. Will the tech-heavy index fall or will the 10-year rate rise?
Stay tuned for the next episode of “The Market vs. The Fed”.
The markets were sluggish at first, but then they revved up their engines, as traders felt optimistic about a debt ceiling deal in the making. They were cheered by the words of speaker McCarthy, who said what Wall Street wanted to hear: “better progress”, “it’s possible to get a deal by the end of the week”, and “now we have a structure to find a way to come to a conclusion.”
That boosted the mood of the bulls, who also benefited from a massive short squeeze, and pushed the major indexes to soar higher, especially since Biden did not object and said that it was a “productive” meeting and “I’m confident we will get a budget agreement.”
But the threat of a default still looms over the markets like a sword of Damocles, and until a deal is sealed, nothing is guaranteed. The markets have been stuck in limbo and have been oscillating around our directional indicator, the Domestic Trend Tracking Index (TTI).
It’s possible that a final debt deal clears the way for a breakout to the upside, but we could also witness a classic case of “buy the rumor, sell the fact”, which means that this euphoric move could reverse.
After all, none of the other problems that plague traders around economics, geo-politics, banking crisis and ever widening deficits have gone away and will come back to haunt us once the debt ceiling drama loses its steam.
Regional banks joined in today’s rally with KRE hitting a resistance level. Bond yields dipped at first but then surged higher with the 2-year leaving the 4% level behind. With higher yields, the US Dollar climbed, but Gold retreated and remains stuck below its $2k level.
Adding to the economic slowdown are the banks, which are stingy with consumer loans, which in turn crimps consumer spending.

