Sunday Musings: Revisiting The 1,000 Point Plunge

Ulli Uncategorized Contact

The NYT reports that “Computer Trades Are Focus in Wall Street Plunge:”

Investigators seeking an explanation for the brief stock market panic last week said Sunday that they were focusing increasingly on how a controlled slowdown in trading on the New York Stock Exchange, meant to bring about stability, instead set off uncontrolled selling on electronic exchanges, Graham Bowley and Edward Wyatt write in The New York Times.

It was an unintended consequence of a system built to place a circuit breaker on stocks in sharp decline. In theory, trades slow down so that sellers can find buyers the old-fashioned way, by hand, one by one. The electronic exchanges did not slow down in tandem, causing problems, according to two officials familiar with the investigation. (The Street also named a Chicago company that services hedge funds as being behind some of the unusual trading, a charge that the company denied.)

That could mean that the computers first flooded the market with sell orders that could not be matched with buyers. Then, just as quickly, many of these networks withdrew from trading. The combined effect might have set off a chain reaction that sent shares of many companies spiraling during the 15-minute frenzy.
…

It is not known exactly what caused the initial sell-off in the blue chips, but investigators say the earliest sign of trouble they have found was a sudden drop in the value of a futures contract on the Chicago Mercantile Exchange, based on the Standard & Poor’s 500-stock index. That pushed down a broad array of stocks in that index, all of them traded on the New York Exchange and other major exchanges, and sent many stocks on the New York Exchange into slow mode.

Ever since computerized trading became dominant in the nation’s stock markets in recent years, market experts have been warning that the lack of consistent rules among exchanges and the increasing complexity and speed of computer trading systems could destabilize markets. This appears to have happened last Thursday, when stock prices plunged and the Dow Jones industrial average fell roughly 600 points in a few minutes.
…

Investigators are now focusing on the events of last Thursday, when several hundred stocks on the Big Board, including five major stocks that make up the Dow — Accenture, Procter & Gamble, 3M and two others — went into slow mode.

This decision forced a switch to slow-motion trading as traders on the floor tried to arrest the decline by manually seeking out bidders. But that did not work, because trading shifted immediately to broader markets controlled by computers, where the plunge continued.

Regulators and the exchanges continued over the weekend to review the tapes from the millions of trades made last Thursday. The investigations are looking at what effect the decision to halt trading in these stocks in New York had on broader market confidence — and on algorithms used by computerized traders.

The scale of the shutdown on may have been a new phenomenon for these computer systems. They may also have been programmed to shut down in such a cataclysmic moment of stress, which would have had a further cascading effect in withdrawing bidders from the market and putting further intense downward pressure on prices.
…

The S.E.C. has been warned in recent months by market participants, publicly traded companies and other regulatory agencies that the lack of coordination between trading platforms, as well as the expansion of high-speed trading in alternative markets, has furthered systemic risk, encouraged regulatory arbitrage and increased opportunities for market manipulation.

The staff of the Financial Industry Regulatory Authority wrote to the S.E.C. in April that “no single regulator has a full picture of all trading activities in the U.S. equity markets.”

[Emphasis added]

While this is very interesting, it remains to be seen if the S.E.C. will now actually step forward and address this issue to prevent a recurrence in the future. The people who were most hurt in this one day breakdown were those who had placed their sell stops ahead of time and got filled at far away (undesirable) prices.

Why? Remember, you can place a sell stop at a limit price but, once that price has been reached, your order becomes a market order and who knows what price you will get in a fast moving market. I discussed these issues and others in “Front Runners.”

This is one of the reasons why I have been harping on using day-ending prices only to determine whether your sell stops have been triggered or not. If they have, only then should you place the order to sell the next day after the market has opened.

This eliminates front running and getting caught in a huge market downdraft. There are only a few things you have control over when investing; this is one of them, so use it and increase your chances of not falling prey to vagaries of Wall Street.

Sell Stops: Reader Q + As

Ulli Uncategorized Contact

The recent sharp pullback in the markets caused a few readers to email me with more sell stop questions. Most were discussed in my e-book, but some need clarification. Reader Andy had this to say:

I followed your stop loss strategy and my Trailing Stop Losses were triggered last week while I was out of town (Maui!). This leads me to two questions. I’m sure you have commented on them before, so I’d really appreciate a reference to an archived blog if you have one…

1. I noticed you said,

“Needless to say I held off liquidating some our positions whose sell stops were triggered Friday. The next few trading days should shed some more light on whether this was just a relief rally or if the major up trend will resume its course again.”

My follow up is why? I don’t consider this needless to say. For a system based on averages and trend lines, I’m curious why you don’t follow “the letter of the law” and sell when a trigger says to. Unfortunately, my stop losses were triggered while I was away and I didn’t get the benefit of the slight rebound on Monday.

2. I’ve read over and over again your stop loss strategy, which I followed. However, I don’t recall reading is the justification on waiting until the ETF has reached the high (while one owned it) before you buy back in. How was this strategy established? For example, if I held an ETF that reached 100, then dropped and triggered a sell at 93, why wait until it reaches 100 to buy back in? I’m just curious why this is chosen as the buy-back point.

a. What if a stock never reaches that previous high? Do you establish a new (false) “high” after a certain amount of time? Let’s say I followed this strategy in 1999 and had several sells trigger prior to the drop. If these highs from 1999 have not been reached as of now (2010), would you have reassessed what your buy-back price should be? For example, if the high has not been reached for 5 years, would you take the previous X years as a new baseline and use the high during that time as your buy-back point. Hopefully, this question makes sense.

To your points:

1. The idea behind the use of sell stops is to get out of the market before disaster strikes and wreaks havoc with your portfolio. At the same time, the danger of participating in a whip-saw signal always lurks, meaning that a sell can be followed by a buy quickly as the markets turn around and head higher again.

Whenever possible, we like to avoid that situation as discussed in Subjective Reasoning.

For example, if my sell stop got triggered based on last night’s closing price, I prepare myself to enter the order this morning, unless a huge rebound is in the making. If that happens, I will hold off selling until it becomes clear again that my stop levels have been violated. This may take a day or two, but more often than not, a whip-saw will have been avoided.

2. You want to be sure that you don’t get caught in a downdraft twice. This week was a very good example as Monday’s rebound along with Wednesday’s higher close could have gotten you back in based on thinking that happy days are here again. Thursday, the markets retreated sharply and Friday, as I am writing this, we headed for a much lower close, unless a last hour rebound saves the day.

I have found that the more conservative way is to wait with re-entering until the old highs, which served as a basis for calculating your sell stop, have been taken out. This is a case where you’re better off to be a little late than too early, especially, this far into the buy cycle, where we are very likely closer to a top than to a bottom.

a. You totally missed the point here. Re-entering as discussed above refers only to the current sell stop. Say, the markets head further south, and we break below the long term trend line, all old highs no longer matter, and we start all over. That simply means, we re-enter the market and move back into equities when the Domestic and International TTIs (Trend Tracking Indexes) break back above their long-term trend lines.

Trend Tracking attempts as much as possible to let you make unemotional investment decisions. However, at major inflection points, when market direction reverses, you need to step in and make sure your sell stops are executed wisely.

Not having any human interaction at all, can lead to chaos as we saw last week when the Dow dropped almost 1,000 points intra-day, because a bunch of unsupervised computer programs played ping pong with buy and sell orders.

No Load Fund/ETF Tracker updated through 5/13/2010

Ulli Uncategorized Contact

My latest No Load Fund/ETF Tracker has been posted at:

http://www.successful-investment.com/newsletter-archive.php

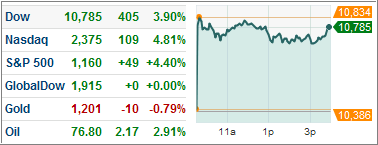
More volatility wiped out a big part of last Monday’s 400 point rally in the Dow. However, the major indexes closed higher on the week.

Our Trend Tracking Index (TTI) for domestic funds/ETFs has now crossed its trend line (red) to the upside by +2.57% (last week +1.52%) keeping the current buy signal intact. The effective date was June 3, 2009.


The international index broke below its long-term trend line by -1.25% (last week -2.69%). A Sell Signal was triggered effective May 7, 2010. We are no longer holding any positions in that arena.


[Click on charts to enlarge]

For more details, and the latest market commentary, as well as the updated No load Fund/ETF StatSheet, please see the above link.

Looking At The Big Picture

Ulli Uncategorized Contact

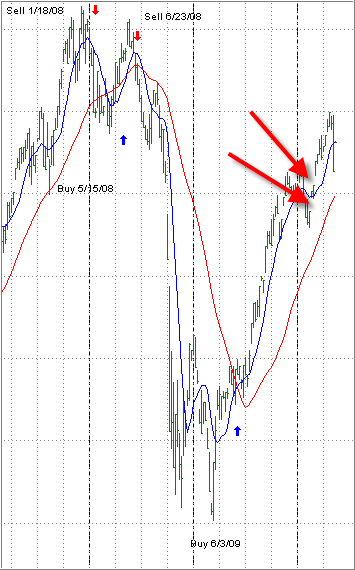
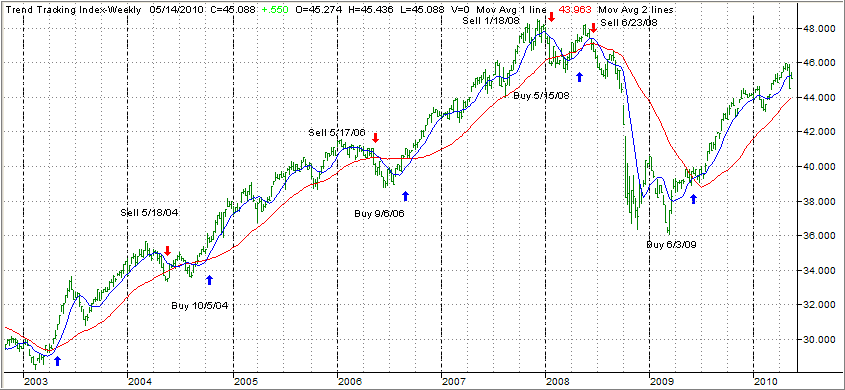
With last week’s market drop and Monday’s rebound still on everyone’s mind, let’s take a look at the big picture via the domestic Trend Tracking Index (TTI), which I have enlarged for better demonstration.

The two big red arrows indicate a gap opening as upside momentum picked up steam after the February pullback.

As I have mentioned in previous posts on this subject, gaps to the upside (called breakaway gaps) on a weekly chart are caused by this week’s high price being lower than next week’s lows price (more buyers than sellers) leaving a gap behind.

Gaps will always be closed meaning that prices eventually will retreat to “cover” them. The big unknown is the timing of it, which could be days, weeks or even years.

For example, take a look at the above chart and notice the large downside gaps (more sellers than buyers) during the meltdown of 2008. They were all closed a year later during the rebound of 2009.

As you can also see, the gap identified by the upper large red arrow was almost reached by last week’s market meltdown.

To me, these gaps are a good sign as to where equities will head sooner or later.

Further weakness could cover these gaps leaving us at an inflection point where the markets could break down further or resume their rally. Given how far we’ve come, the former may be more likely.

Violent market moves in both directions such as we’ve seen over past week are occurring most often during or at the beginning of bear markets. Mish at Global Trends featured some interesting charts on the subject yesterday in “Visualization About Violent Market Drops.” Towards the end he quoted this interesting fact:

The further increase in volatility is bearish. We often see that right at the beginning of major bear markets. You get some single day rallies that really impress everyone. We had one of those after the August 2007 swoon for instance.

Yet, the DJIA has never – not once – rallied 400 points during a bull market. Every single 400 point or more rise was in the context of major bear markets.

Those huge bear market rallies were all taken back and then some.

While we’re not in bear market territory according to my indicators, we did come close last week. Volatility has increased and it behooves you to be on guard and use your sell stops when necessary.

Yes, we may watch the market go higher and realize we’ve been whip-sawed with some of our positions.

Remember, that this is the investment insurance we pay every so often to guard against extreme downside moves. Should the market resume its upward trend, we will then look for a new entry point to re-deploy our idle cash.

Master Limited Partnerships (MLPs)

Ulli Uncategorized Contact

Several readers have emailed wanting to know about investing in MLPs via ETFs/ETNs. While I have not used them in my course of business, ETF Trends had this to say in “MLP ETNs: Another Source of Income?”

Income-focused investors have been looking for new sources of dividends and interest, since yields are low, low, low. There is an alternative exchange traded note (ETN) investment that many investors could be overlooking.

Master Limited Partnerships (MLPs) have nice income streams and can also add growth to a portfolio. Ron Rowland for Money and Markets explains that MLPs concentrate on the storage and transportation of energy products, such as tank farms and pipeline companies.

While you can invest in MLPs directly, ETNs may be a better way to get your exposure. They give your portfolio more diversified exposure and the tax treatment is more favorable. Investing directly in MLPs can generate K-1s, a hassle many investors may not want to deal with.

However, with an MLP ETN, you do not own the companies in the index, you own a bond issued by the bank whose return is tied to the index.

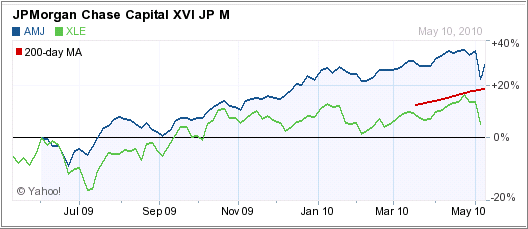
Let’s take a look at AMJ, which is the JP Morgan Alerian MLP Index ETN. Since it covers energy limited partnerships, I have compared it to XLE, the well known energy ETF:

Interestingly enough, AMJ outperformed XLE by a wide margin. Daily volume is decent with an average of $16 million being traded. The current yield is 4.24%, according to Morningstar, while the bid/ask spread is 2 cents.

Over the past year, this ETN would have given you a nice bang for the buck along with a decent dividend. As you can see from the chart above, volatility can be an issue, although AMJ has held up better than XLE.

Nevertheless, if you consider AMJ as an addition to your portfolio, be sure to use my recommended sell stop discipline.

Disclosure: No holdings in the above funds

Shock And Awe In 3-D

Ulli Uncategorized Contact


The European leaders finally showed some unity and decisiveness over the weekend, put on their best Poker face, and “went all in.”

The rescue package of almost $1 trillion is designed to bring stability to some of the troubled economies in the union. The markets took that as a positive and rallied sharply on Monday as the futures already indicated on Sunday night.

Very likely, a big part of that up move was short covering as many players did not believe that a consensus could be found in Europe let alone that an action package would be initiated this quickly. It now remains to be seen if there is more firepower left once all shorts have covered their positions.

Needless to say I held off liquidating some our positions whose sell stops were triggered Friday. The next few trading days should shed some more light on whether this was just a relief rally or if the major up trend will resume its course again.

The headlines are full of views and opinions about the crisis in Europe. For some different thoughts without the hype, please read Mish Shedlock’s “Voices of Reason in Sea Of Insanity.”