Sunday Musings: A 2-Year Anniversary

Ulli Uncategorized Contact

While June 23, 2010 passed quietly last week, it nevertheless marked the 2-year anniversary of our last domestic sell signal on 6/23/2008, which provided a safety net for those who followed its call and moved their portfolios out of the market onto the sidelines.

Here’s a look at the blown-up domestic Trend Tracking Index (TTI) chart covering the past two years:

[Double click on chart to enlarge]

I have on several occasions posted as to how avoiding a big drop relates to performance when compared to the S&P; 500, which stood at 1,318 on 6/23/08 and closed last Friday at 1,077.

Despite the enormous stimulus induced rally of 2009, the S&P; 500 still needs to gain another 22.40% just to reach the point we sold at in 2008. While that is possible, given the current economic backdrop, it’s highly unlikely at this time.

If you follow chart patterns, it becomes obvious that a huge double top was formed in 2008 leading to the subsequent crash. If you look closely, you’ll notice that we’re in the process of forming a double top again, although smaller in size.

Unless we break out to the upside by making a new high for the year, it’s more likely that a pullback will occur, which eventually will break the trend line (red) to the downside and move us back into bear market territory. As close as we’ve come recently, I would assume that this will happen within the next few weeks/months—that’s as close as I can guess.

Looking at this chart confirms again the importance of avoiding bear markets, while it is not necessary to participate in every upturn in order to outperform the S&P; 500. That’s an important point that I want to elaborate on since several readers have commented on it.

One widely held argument is that “if you’re out of the market, you will miss the big rebound rally.” Sure, you may miss some or all of it but the above chart speaks volumes. If you had just sat on the sidelines after 6/23/08, staying in money market, you would have missed 100% of the rebound totally and be still way ahead, as I pointed out above.

This supports my long-held view that it is more important to avoid bear market drops than participate in every rally.

Some readers have a misconception about trend tracking I want to clarify. They erroneously assume that during a bullish period, such as the last 10 months of 2009, trend tracking will outperform or at least match the gain of the S&P; 500. Expecting that is missing the point.

To be clear, during such bullish periods, you will lag performance more often than not. There are several reasons for that:

1. A buy signal may not be generated until a later point in time, thereby shortening the investable time span.

2. Depending on client risk tolerance, we may ease into the market with less than 100% of portfolio value.

3. We may use funds/ETFs with a lower beta than the S&P.;

4. We may experience a whip-saw signal, which will reduce returns.

Having pointed out these limitations, it’s important to look at the overriding benefit, which is not participating in major bearish periods. Since markets go down a lot faster than they go up, this should always be priority one.

Here’s the important point I am trying to make: Only when you combine bull AND bear markets will you have a chance to outperform the S&P.; Again, you very likely will not be able to do so during bullish periods alone, as pointed out above, unless you are extremely aggressive.

That means you have to keep the big picture in mind and not just focus on what happened during the past year, as the market rebounded, but be aware of the fact that only when you combine the good with the bad, you will come out ahead a winning investor.
Against The Wind

Ulli Uncategorized Contact

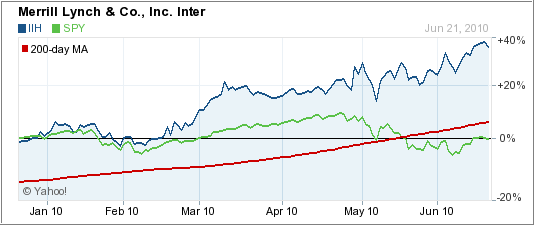
When the markets zig, you hope to have a component in your portfolio that zags to offset or minimize any drawdown. While that is not always easy to do, during May’s market meltdown, I noticed one ETF (IIH) that definitely bucked the trend.

Take a look at the 6-months chart, comparing IIH with the SP 500 (SPY):

Not only has it bucked the trend, but during the most recent correction, it has held up remarkably well and sits in the number 1 spot in the technology sector out of the 48 I track.

So what’s wrong with it? For one, it’s a tiny ETF with net assets of only $22 million. Second, the average daily volume of $284k makes it suitable for only a small investor.

You won’t find any professionals involved with IIH, so if you are in the market to deploy small amounts of money to a technology sector, this one deserves further investigation. Despite its recent fine performance, you need to work with a trailing stop loss to protect yourself from downside risk.

Disclosure: No holdings in IIH

No Load Fund/ETF Tracker updated through 6/24/2010

Ulli Uncategorized Contact

My latest No Load Fund/ETF Tracker has been posted at:

http://www.successful-investment.com/newsletter-archive.php

The bulls gave back last week’s hard fought gains and then some as the bears ruled.

Our Trend Tracking Index (TTI) for domestic funds/ETFs remains above its trend line (red) by +1.19% (last week +2.46%) keeping the current buy signal intact. The effective date was June 3, 2009.

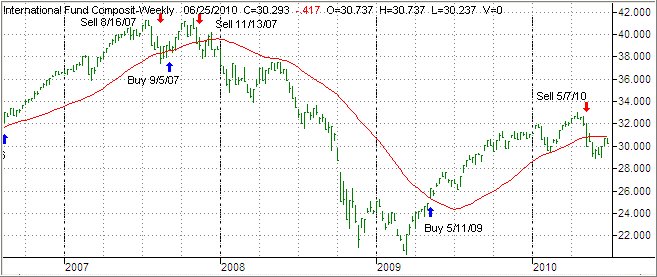
The international index has now broken below its long-term trend line by -1.84% (last week -0.49%). A Sell Signal was triggered effective May 7, 2010. We are no longer holding any positions in that arena.

[Click on charts to enlarge]

For more details, and the latest market commentary, as well as the updated No load Fund/ETF StatSheet, please see the above link.

Fed Keeps Rates Low

Ulli Uncategorized Contact

As expected, the Fed announced yesterday that interest rates would remain at their historic low levels. Normally, this should have cheered investors, but this time it was interpreted (correctly) that it was simply a sign of the economy struggling.

Fears have been increasing lately that we might slip back into a recession, which would postpone any rate increases for at least a year or so. Retail sales have been weakening with sluggish demand and no improvement for increased employment in sight.

Contributing to the initial selloff was the news that new-home sales plunged by more than one third in May to 300,000 units, the lowest since record keeping started in 1963. That should have come as no surprise as the home buyer tax credit expired at the end of April.

The markets more or less meandered aimlessly but managed to keep losses to a minimum as the chart above shows. Our domestic Trend Tracking Index (TTI) edged slightly higher and has now moved +1.87% above its long-term trend line.

The market appears to be stuck in this range with the S&P; 500 hovering around the 1,100 level. A breakout will occur sooner or later, and we will have to wait and see if it will be to the upside or if overwhelmingly negative economic news will pull the domestic TTI finally into bear market territory.

Recovery Doubts

Ulli Uncategorized Contact


Weak housing and worries about Europe proved to be too much for the market yesterday and, after a modest opening rebound to higher levels, the major indexes slid for the remainder of the session as the chart above (courtesy of MarketWatch.com) shows.

The S&P; 500 ended up below the 1,100 level and broke below its key technical indicator, the 200-day moving average. This could increase downward pressure if prices stay below that point, and it will eventually act as overhead resistance.

The market’s weakness arrived just in time for the 2-day Federal Reserve meeting on interest rates. We will find out the results on Wednesday, but expectations are that no changes are imminent with key interest to remain at current low levels.

Our domestic Trend Tracking Index (TTI) moved closer to its long-term trend line, but still hovers +1.80% above it, which means that there are no changes to our current positions.

Against popular opinion, I still believe that low interest rates are here to stay with us for quite a while longer as the expiration of stimulus programs will not bode well for the economy. That’s why reduced equity holdings and increased exposure to bonds (via bond ETFs) may make sense until such time that a change in trends proves otherwise.

The Rally That Wasn’t

Ulli Uncategorized Contact

In a repeat performance similar to what we’ve witnessed so many times over the past few months, the markets turned an early intraday 140 point gain of the Dow into a losing session starting the week on a negative note.

The losses were modest, so not much should be read into them. The driver for the morning rally was the Chinese announcement that it will loosen its currency peg to the dollar; not by a huge change, but at least it was interpreted as a step in the right direction after two years of being locked in a rigid position.

However, global debt problems surfaced later on in the day, the dollar rallied (supporting our long position) and south we went. Our domestic Trend Tracking Index (TTI) moved only slightly and remains +2.19% above its long-term trend line.

Upward momentum from last week’s rally seems to have stayed intact as all major indexes are remaining above their 200-day moving averages.