No Load Fund/ETF Tracker updated through 7/1/2010

Ulli Uncategorized Contact

My latest No Load Fund/ETF Tracker has been posted at:

http://www.successful-investment.com/newsletter-archive.php

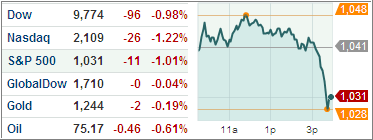
The bears ruled, and the major indexes lost 5-7% for the week .

Our Trend Tracking Index (TTI) for domestic funds/ETFs barely slipped below its trend line (red) by -0.40% (last week +1.19%). For more on how to handle this, please see the above link.

The international index has now broken below its long-term trend line by -4.49% (last week -1.84%). A Sell Signal was triggered effective May 7, 2010. We are no longer holding any positions in that arena.

[Click on charts to enlarge]

For more details, and the latest market commentary, as well as the updated No load Fund/ETF StatSheet, please see the above link.

Peeking Into Bear Market Territory

Ulli Uncategorized Contact

Today’s slightly lower close finally pushed our domestic Trend Tracking Index (TTI) below its long term trend line, although only by a fraction of a percentage. We slipped below the dividing line between bullish and bearish territory by a minuscule -0.06%.

That is not enough to declare a defeat of the bulls by the bears. As I posted this morning, I like to see a clear piercing (around 1%) followed by couple of trading days holding the level below the line. This will enhance our chances of avoiding an immediate whipsaw signal.

Once that has occurred, and tomorrow’s jobs report might get us there in a hurry, I will declare this buy cycle as being over. Stay tuned.

Still Hovering “Above” The Trend Line—By The Slightest Of Margins

Ulli Uncategorized Contact


When I watched the major indexes sink into the close yesterday, I was certain that the Domestic Trend Tracking Index (TTI) had finally crossed into bear market territory.

When the final numbers were computed, we had come close but the TTI did not actually cross below the line. Here are the latest figures:

Domestic TTI value: 44.36
39-week trend line: 44.34
% above/below the line: +0.04%

The 39-week trend line will be recomputed again on Friday, so, if the markets meander around current levels, we might see a break at that time. If more downside action comes into play today, we could see a move into bear market territory later on.

Again, I like to see a clear piercing of the trend line to the downside, followed by a couple of trading days holding the level below, before accepting it as major trend change from bullish to bearish.

A potential downgrade of Spain’s credit by Moody’s sent the markets lower with the S&P; 500 breaking through the critical 1,040 support level as I discussed in yesterday’s post. Besides violating the support, the major indexes are all sporting clear head and shoulders formations, which are one of the most reliable trading patterns when it comes to directional change.

Any more bad news, especially from Friday’s jobs report, will send the indexes to much lower levels. Of course, given the amount of selling lately, there is bound to be a bounce of some sort, which will very likely to turn out to be another head fake.

If it should materialize, I would expect it to happen after the 4th of July holiday, since many traders may not want to be caught with outright long positions during these uncertain economic times over an extended weekend.

Descending Towards Bear Market Territory

Ulli Uncategorized Contact

Right out of the gate, the markets hit the skids yesterday, as the above chart clearly shows.

One supporting actors in this drama causing this sharp selloff was a disappointing report on the Chinese economy as their leading indicators were downwardly revised. Adding fuel to the fire was a drop in the consumer sentiment index to the lowest level since March.

Despite a rise in U.S. home prices and a three-month extension of the home buyer tax credits, the markets were solidly entrenched in a downward move and never looked back.

Technically speaking, the S&P; 500 dropped intra-day below its strong support level of 1,040 (see chart above) but managed to close above it. If this level gets broken, you may see downside activity gain momentum.

The selloff was not enough to push our Domestic Trend Tracking Index (TTI) into bear market territory, but we are within striking distance—again. As of yesterday’s close, the TTI has moved to with +0.35% of breaking its trend line.

Any follow through selling, which is likely to happen, especially if the 1,040 level of the S&P; is violated, will end this domestic buy cycle and change our investment stance from bullish to bearish. Since you may use this break as your final exit point, I will post this event, as soon as it happens, based on the closing prices of the day.

Wall Street traders’ anxiety may very well increase somewhat over the next couple of days not only in view of yesterday’s drubbing but also because of the impending jobs report on Friday.

More uncertainty about the economy will derail this market further and life below the S&P;’s 1,040 level may very well be financially hazardous for those hanging on to outright long equity positions.

Slipping Into The End Of The Quarter

Ulli Uncategorized Contact


Aimless meandering describes best how the markets drifted through the day yesterday and ended up with slight losses.

As this month comes to an end, we may see more of the same with the major indexes completing what looks to be their worst quarter since the beginning of 2009.

Volume was light and may continue along the same path until Friday when the ever important nonfarm payroll employment numbers will be released. While the G-20 nations vowed to cut their deficits substantially over the next two years, the market showed no reaction one way or the other.

It looks that this quarter will end on a negative note with the Dow being down -6.6%, while the Nasdaq and S&P; 500 have given back -7.4% and -8.1% respectively. Most of that damage occurred during May’s correction.

Our domestic Trend Tracking Index (TTI) recovered slightly from last Friday’s close and has now moved to +1.49% above its long-term trend line.

Reader Steve followed up with a comment to last Sunday’s post titled “A 2-year Anniversary:”

It appear this market is declining much like the initial decline in 2008, a little each day until it hits panic levels and selling really takes off. Do you see the same pattern?

Yes, I see the same pattern, although much smaller in size. However, it does not mean that the markets will crash again once we break through the trend line and move into bear market territory. We may very well see a slow but consistent decline in prices, which can become very painful for those who continue to hang on to equities (remember 2001?).

No one knows for sure, but it’s imperative that you make plans to move your portfolio to the safety of the sidelines, whether the eventual outcome will be in form of a crash, a slow decline or even a whip-saw.

In these times of economic uncertainty, being cautious and defensive will very likely prove to be the best course of action.

Your Portfolio: Using Only One Single ETF?

Ulli Uncategorized Contact

I found an interesting article discussing “Can You really Accomplish Everything You Need With One Single ETF?”

The story focuses on a new ETF (ONEF), the purpose of which is explained as follows:

Our firm wants to give small investors (under $100K in investable assets) access to the same professional portfolio management that high net-worth investors receive from their dedicated advisors, but at a fraction of the cost, packaged in a way that is easy to understand and buy and which follows the time tested approach of passive index investing.

ONEF would be suitable for someone looking for an all- in-one buy-and-hold stock fund that handles the asset allocation and securities selection for them. This single fund gives exposure to nearly the entire investable global equity market. It’s geared towards the 30-50 crowd – people that are still far from retirement – and most in need of long-term growth through stocks.

Obviously anyone who buys this fund is still on their own for fixed-income exposure. U.S. One hopes to also launch similar ‘one-and-done’ bond and balanced ETFs to provide a full range of investment solutions to small investors.

The idea here is to come up with an ETF for all seasons to find a solution for the buy-and-investor so he no longer has to worry about diversification. For the most part, diversification for the purpose of better weathering out bear markets is a useless endeavor.

Sure, having a bond portion in such a portfolio can protect some of the downside. Doug Short of http://www.dshort.com said it best: Diversification works, until it doesn’t…
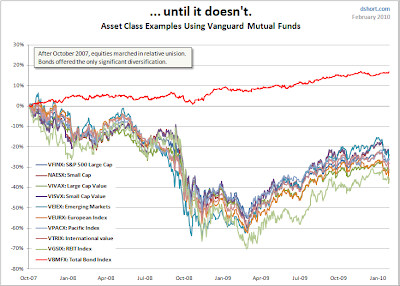
Doug’s chart makes it very clear that diversification in a typical Vanguard portfolio during a down market does not make much sense since all equity/international/emerging funds took at hit during the 2008 market massacre. While the bond portion saved the day, significant losses were still incurred.

As I posted yesterday, the far better solution is to not participate in the downdraft to begin with. For those following the trends, the sell date was 6/23/08, which you can easily identify in the above chart.

Back to the discussion. Can an investor with under $100k in assets use just one ETF? I believe so, but I don’t think ONEF is the one. It’s tiny with low volume and has no long term track record yet.

I don’t think there is any fund that can simply be held; any holding needs to be tracked and sold prior to bear markets developing. The last decade should have made that abundantly clear. Those investors looking for that one ETF that fits all circumstances will have a rude awakening at some time in the future.

I have found one no load fund, which I have featured before, that comes close to being held most of the time. However, in 2008 it also took a licking, but held up far better than the S&P; 500. Nevertheless, stepping aside would have been the right course of action.

It’s PRPFX, and in my advisor practice we use it all the time. It has been very steady, and, during the last year, never once came close to be stopped out via our trailing 7% sell stop discipline. While it will never be a top performer, the lack of volatility makes it an ideal candidate for the conservative investor. Since June 2008, it’s up over 16%, and it’s well suited as the only fund in a small portfolio—of course, subject to trend tracking and sell-stop rules.

While ONEF has to prove itself in the future, PRPFX is here now and has a long track record to boot.

Disclosure: Holdings in PRPFX