
ETF Tracker StatSheet
You can view the latest version here.
STRONG JOBS, WEAK MARKETS: WHEN GOOD NEWS TURNS BAD
- Moving the market
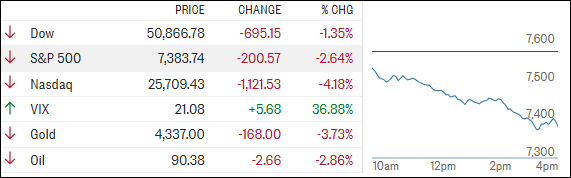
Stocks got off to a rough start, with the S&P 500 and Nasdaq sliding early as chip stocks came under pressure and Treasury yields moved higher.
The big reason? A much stronger-than-expected jobs report that rattled the market.
Semiconductor names led the decline. Broadcom dropped about 3% after already tumbling more than 12% the day before. Marvell sank over 8%, and Micron wasn’t far behind, down around 6%.
The catalyst was May’s jobs report, which showed payrolls jumping by 172,000—more than double what economists were expecting. Meanwhile, the unemployment rate held steady at 4.3%, right in line with forecasts.
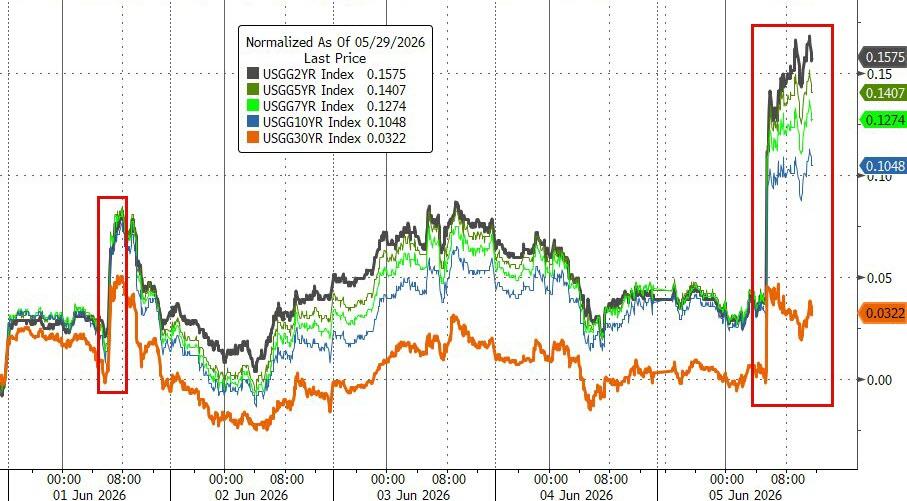
That kind of strength in the labor market pushed Treasury yields higher, as traders started to rethink the Fed’s next move. The 10-year yield climbed above 4.5%, and the 30-year moved past 5%.
At this point, the narrative is clearly shifting. The conversation is no longer “when will the Fed cut rates?” but rather “why haven’t they hiked again yet?” If the Fed does pivot from a more dovish stance to a hawkish one, that’s a big adjustment—and markets typically don’t handle those transitions smoothly.
In classic fashion, good news turned into bad news. Strong jobs data sent rate hike expectations soaring, and nearly every asset class moved lower. Even falling oil prices couldn’t stop the broad-based sell-off.
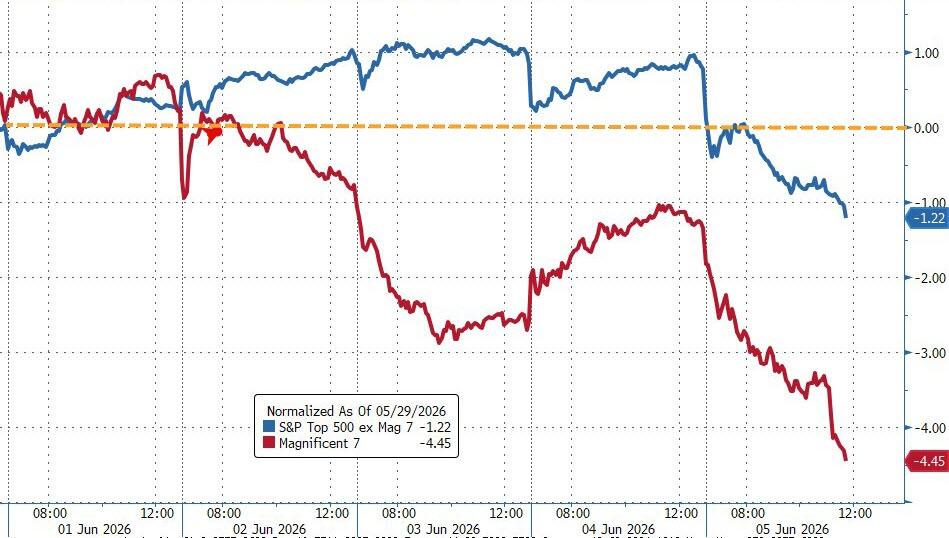
It turned into a tough stretch overall. The Nasdaq just logged its worst day and week since April 2025, while the S&P 500 saw its historic winning streak come to an end. Even the “Mag 7” lagged the broader market.
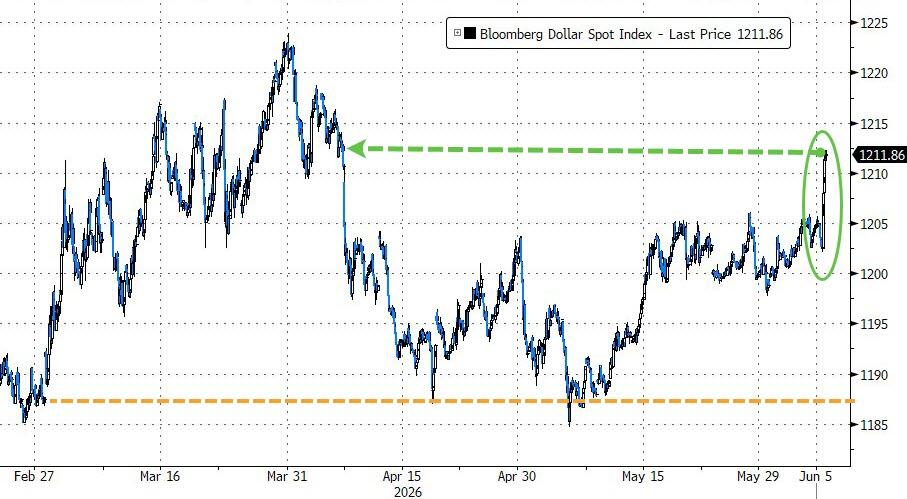
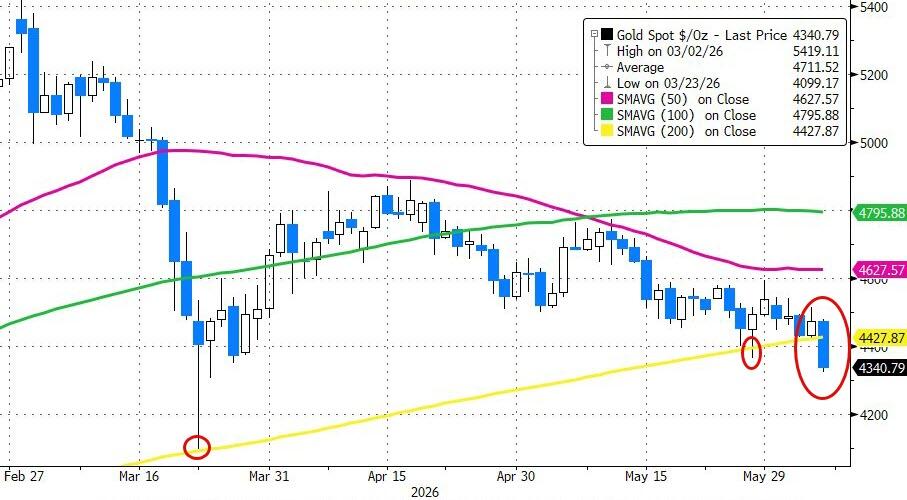
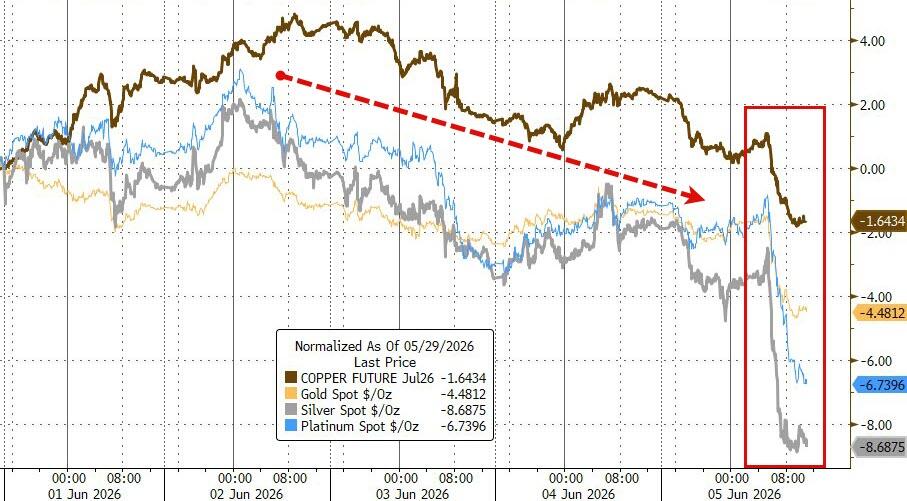
Elsewhere, bond yields surged, the dollar ripped higher, and gold broke below its 200-day moving average, wiping out its gains for the year. The rest of the metals complex followed suit, with silver taking the hardest hit.
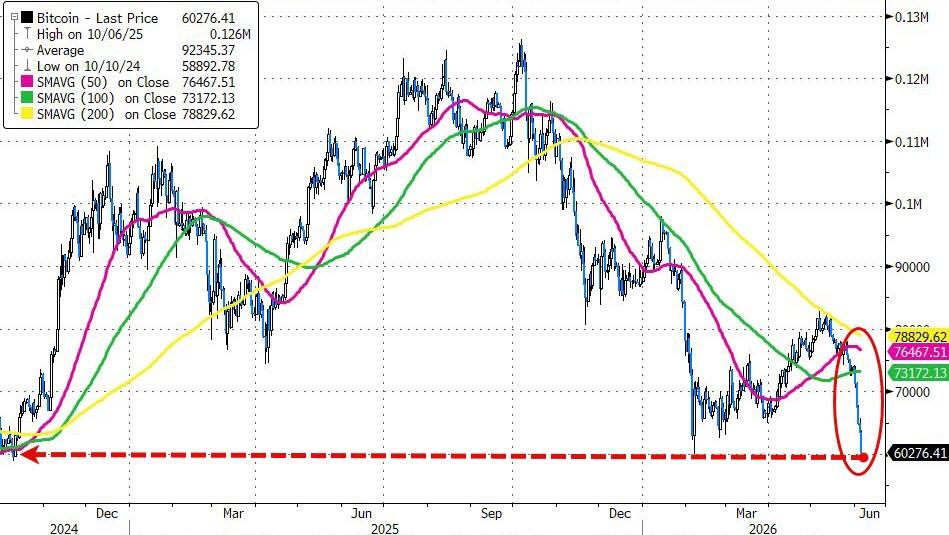
Crypto didn’t escape either—Bitcoin slid along with everything else, barely holding support around the $60K level.
While the AI-driven rally has been a major force behind this bull market, it cuts both ways.
When momentum shifts and leverage unwinds, pullbacks can get sharp in a hurry—and that’s exactly the kind of environment we could be heading into.
So, the big question now is: are markets just taking a breather, or is this the start of a deeper reset as rates push higher?
2. Current domestic “Buy” Cycle (effective 5/20/2025); International “Buy” Cycle (effective 5/8/25)
Our domestic bullish cycle that began on November 21, 2023, concluded on April 3, 2025, following a market downturn triggered by President Trump’s tariff policy announcement.
This development caused significant declines across major indexes and broader market indices. However, markets subsequently rebounded, culminating in a new domestic “Buy” signal taking effect May 20, 2025.
Concurrently, our International Trend Tracking Index (TTI) experienced parallel volatility. On April 4, 2025, it breached critical thresholds, prompting a “Sell” recommendation. This position reversed as global markets recovered, with the International TTI regaining sufficient momentum to issue a new “Buy” signal effective May 8, 2025.
3. Trend Tracking Indexes (TTIs)
The bears took control right from the opening bell, as what initially looked like a very positive jobs report quickly turned into a negative for the market.
Concerns about potentially higher interest rates kept many traders on the sidelines, adding to the downward pressure.
The sell-off was broad-based, with no corner of the market spared—metals and Bitcoin were hit hard alongside equities.
Our TTIs weren’t immune to the pullback, but they did hold up better than the major indexes.
Importantly, they’re still staying on the bullish side of their respective trend lines, which is an encouraging sign.
This is how we closed 06/05/2026:
Domestic TTI: +6.70% above its M/A (prior close +8.55%)—Buy signal effective 5/20/25.
International TTI: +8.00% above its M/A (prior close +10.22%)—Buy signal effective 5/8/25.
All linked charts above are courtesy of Bloomberg via ZeroHedge.
———————————————————-
WOULD YOU LIKE TO HAVE YOUR INVESTMENTS PROFESSIONALLY MANAGED?
Do you have the time to follow our investment plans yourself? If you are a busy professional who would like to have his portfolio managed using our methodology, please contact me directly to get more details.
Contact Ulli