Technical Analysis: The Golden Cross vs. The Death Cross

Ulli Uncategorized Contact

One of the oldest systems to generate buy and sell signals for equity indexes is the crossover of the S&P; 500’s 50-day and 200-day simple moving averages (M/As).

When the 50-day crosses the 200-day M/A from a level below, a buy signal is generated, which is also referred to as the Golden Cross. When it crosses from a level above, a sell signal is generated, which is also known as the Death Cross.

To demonstrate the effectiveness, I have marked the crossovers in the 7-year chart below. The buys are identified by a blue arrow, while the sells are marked with a red arrow:


[Double click chart to enlarge]

As you can see, using this approach, you would have participated in all of the “major” up moves of the past few years.

More importantly, you would have avoided the major downturns. It’s especially noteworthy that a sell was signaled late in 2007 with a new buy not being generated till the second quarter of 2009, causing an investor following this approach sitting on the sidelines throughout 2008.

While I don’t use this method in my advisor practice, I do observe its major turning points. What most investors will not like about this approach is that its buy signals are generated late within an up cycle. Case in point is the most recent Golden Cross, which just occurred during the middle of October.

However, if you are concerned with controlling downside risk, and are able to truly look at the big picture, without being distracted by quarter to quarter market idiosyncrasies, you should definitely be on the lookout for the Death Cross as your last line of defense.

No Load Fund/ETF Tracker updated through 11/04/2010

Ulli Uncategorized Contact

My latest No Load Fund/ETF Tracker has been posted at:

http://www.successful-investment.com/newsletter-archive.php

The big three events of this week were all interpreted as positive, and the major indexes closed at new highs of the year.

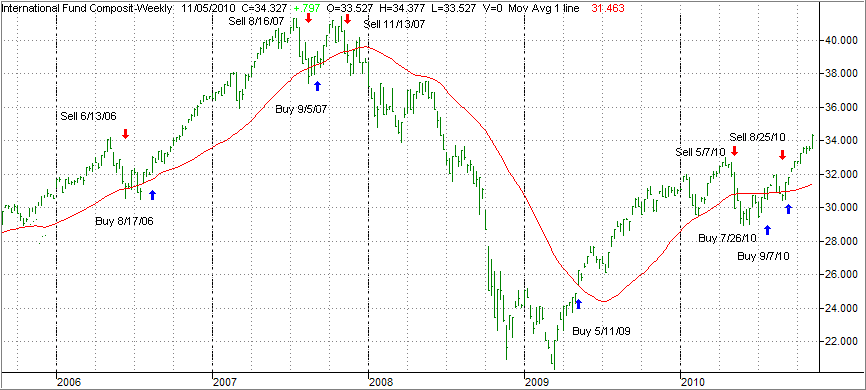
Our Trend Tracking Index (TTI) for domestic funds/ETFs moved above its trend line (red) by +7.99% (last week +6.13%) and remains in bullish mode.


The international index has broken above its long-term trend line by +9.11% (last week +6.99%). A new Buy signal was triggered effective 9/7/10. If you decided to participate, be sure to use my recommended sell stop discipline.


[Click on charts to enlarge]

For more details, and the latest market commentary, as well as the updated No Load Fund/ETF Tracker StatSheet, please see the above link.

Two Out Of Three

Ulli Uncategorized Contact


With yesterday’s elections, and the Fed’s announcement about QE-2, we made it through two big events with only Friday’s unemployment numbers waiting on deck.

The elections turned out pretty much as expected, so there was no noticeable effect on market behavior or the general trend. I was watching the intra-day charts when QE-2 was announced, as confusion reigned at the very beginning. Take a look at the S&P; chart above.

The markets rallied briefly, spiked down sharply and head back up. The volatility, and the speed with which prices changed, was truly remarkable. In the end, however, it was just another modestly higher close as we were honing in on the 1,200 milestone level.

As an aside, please note that the gold and oil figures in the above chart reflect Wednesday’s afternoon trading and not the morning session.

The Fed’s move to buy $600 billion worth of longer-term treasury securities over the next eight months was pretty much in line with expectations. For the rest of us, it simply means that interest rates will remain low for the foreseeable future and might even drop further.

I am certain that Wall Street will me monitoring any progress in the economic arena closely, because of all the hype leading up to this announcement. High expectations about the outcome have already been priced into the current lofty market levels.

As I have noted before, personally, I don’t see any merit in these efforts, but time will tell if the Fed can pull this economic cart out of the mud. My concern is if QE-2 fails, as I believe it will, are there any more bullets in the Fed’s gun that can be used?

If not, and Wall Street as much as gets a whiff that things are not turning out as anticipated, this rally will over in a hurry.

That’s why I keep pounding on the same theme that you always have to be prepared to exit. Remember, it’s not what you buy that matters; it’s when you sell that is important, because that precise action will prevent your portfolio from receiving a serious haircut.

Hopes Prevail

Ulli Uncategorized Contact


The major indexes rallied right out of the gate yesterday and never looked back. Hopes prevailed that the Fed will implement its program today to boost the economy as Wall Street in general bet on a Republican win.

By the time you read this, the votes will all have been counted and the results and potential impact will be analyzed. The Fed is certain to act in some form, even if the action is less than anticipated, there should be some type of economic benefit—at least that is the hope right now.

In view of the above, the dollar dropped as long term interest rates are expected to fall. This pushed up prices of metals, along with oil and energy. Despite this broad rally, volume was extremely light, but that should change once the Fed has taken the mystery out of its intentions.

Hanging On

Ulli Uncategorized Contact


The month of November started out with a bang yesterday, but the rally was short lived with the major indexes slipping towards the unchanged line at the close.

Strong industrial output from China along with a decent report on U.S. manufacturing combined to lend an assist early on, but with the elections, the Fed announcement and the unemployment numbers lurking overhead, the starch was quickly taken out of this rally.

The dollar headed higher with the guessing game continuing as to how much or how little of an impact the Fed will be making on Wednesday morning. The current bet is that a $500 billion stimulus package is in the works, but great controversy over this upcoming move prevails.

It’s a very delicate situation for the Fed. If the package to be announced is too small, it may not have much of an impact. If it’s too large, that would suggest the economy is actually weaker than had been assumed.

Talk about being between a rock and hard place.

Rare Earth Metals ETF

Ulli Uncategorized Contact


This past week, Van Eck Funds introduced the Rare Earth/Strategic Metals ETF with the ticker REMX (see 5-day chart courtesy of YahooFinance).

Much has been written about rare earth metals lately as China, which produces 95% of the world’s elements, has threatened to limit exports of these crucial metals.

REMX invests in the stock of companies that mine minerals such as dysprosium (used for lasers, hard drives) and europium (TV screens and fluorescent lamps) among others.

These are crucial elements which are not only used for day-to-day products but some also have military applications, such as in guidance systems.

As is the case with all new promising ETFs, I want to see some 9 months of price action to be able to determine trends and average volume. I will then add and track it via my data base along with its various momentum figures.

Disclosure: No holdings