
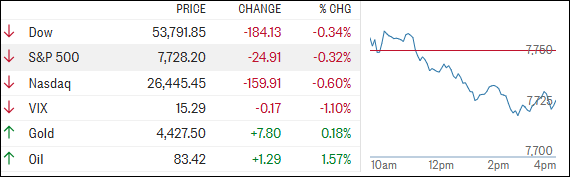
[Chart courtesy of MarketWatch.com]
- Moving the market
Today’s market action was a reminder that headlines still matter. The S&P 500 lost ground as optimism about a reopening of the Strait of Hormuz faded, pushing oil prices higher and putting pressure on stocks, especially some of the market’s biggest technology names.
Communication services and technology led the retreat, with Alphabet, AppLovin, Apple, and even Nvidia struggling to find traction.
Interestingly, Nvidia couldn’t hold onto its gains despite announcing a massive AI infrastructure initiative, suggesting investors may be more focused on near-term risks than long-term opportunities.
Meanwhile, bonds seemed less concerned, with yields slipping, while the dollar was little changed. Gold and Bitcoin both eased back as traders took a cautious stance ahead of this week’s inflation reports.
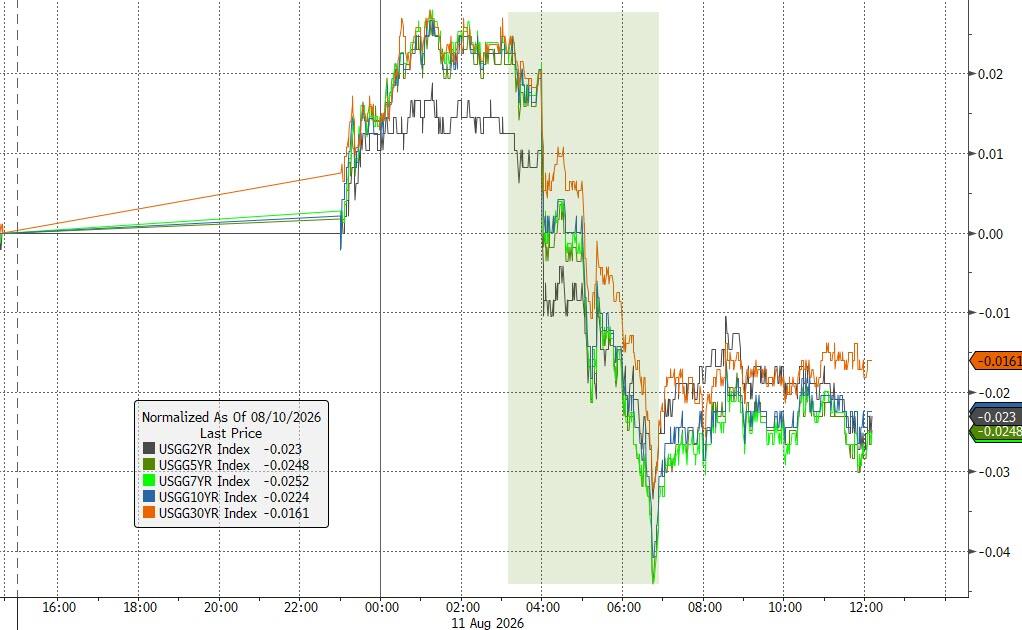
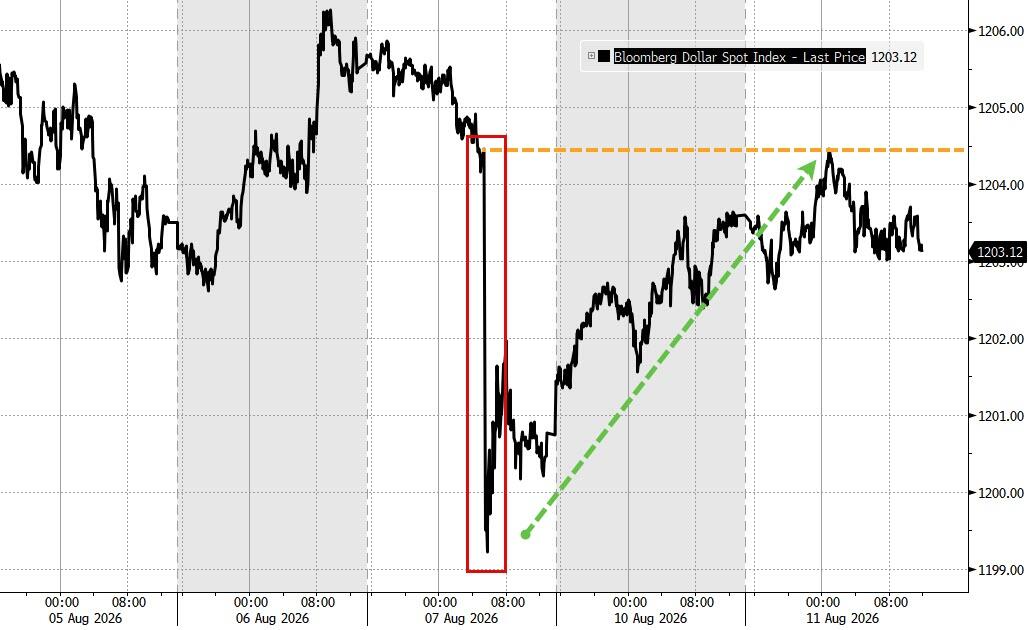
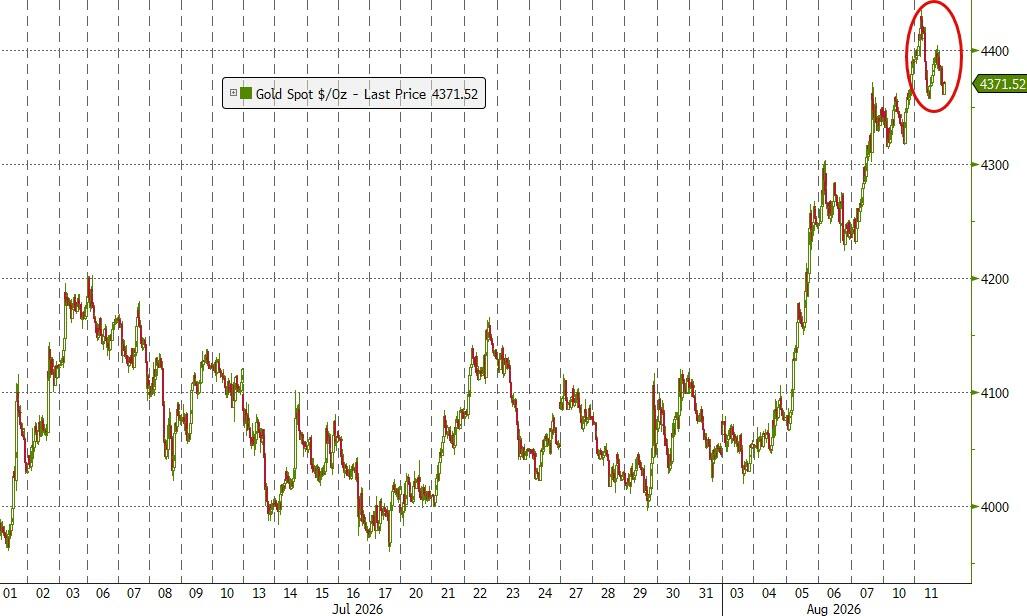
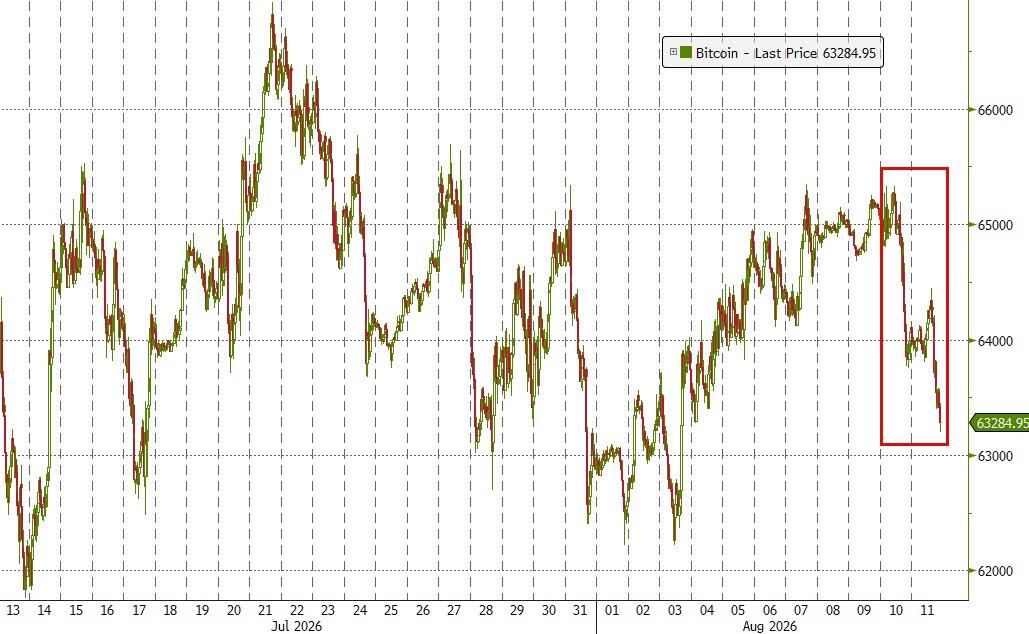
At this point, the market feels like it’s caught between two worries: higher oil prices on one side and a slowing economy on the other.
With CPI tomorrow and PPI on Thursday, traders are about to find out whether inflation is cooling enough to comfort the Fed, or whether the latest energy spike throws another wrench into the outlook.
So, the question is: will the inflation data give stocks a reason to rally, or simply provide the market with a fresh set of worries?
2. Current domestic “Buy” Cycle (effective 5/20/2025); International “Buy” Cycle (effective 5/8/25)
Our domestic bullish cycle that began on November 21, 2023, concluded on April 3, 2025, following a market downturn triggered by President Trump’s tariff policy announcement.
This development caused significant declines across major indexes and broader market indices. However, markets subsequently rebounded, culminating in a new domestic “Buy” signal taking effect May 20, 2025.
Concurrently, our International Trend Tracking Index (TTI) experienced parallel volatility. On April 4, 2025, it breached critical thresholds, prompting a “Sell” recommendation. This position reversed as global markets recovered, with the International TTI regaining sufficient momentum to issue a new “Buy” signal effective May 8, 2025.
3. Trend Tracking Indexes (TTIs)
The market came out of the gate with some enthusiasm, but by the closing bell that early energy had pretty much run out of gas. The major indexes drifted lower throughout the day and finished in the red, though the selling remained fairly orderly.
Metals followed a similar script, giving back their opening gains as the session wore on.
Our TTIs told a slightly different story. The domestic model showed a bit of independent thinking and managed to move higher, while the international model eased back modestly.
Not exactly a dramatic split, but enough to remind us that markets, much like teenagers, don’t always move in the same direction.
Sometimes the market’s biggest accomplishment is finding new ways to go nowhere.
This is how we closed 08/11/2026:
Domestic TTI: +10.16% above its M/A (prior close +9.93%)—Buy signal effective 5/20/25.
International TTI: +8.52% above its M/A (prior close +8.59%)—Buy signal effective 5/8/25.
All linked charts above are courtesy of Bloomberg via ZeroHedge.
———————————————————-
WOULD YOU LIKE TO HAVE YOUR INVESTMENTS PROFESSIONALLY MANAGED?
Do you have the time to follow our investment plans yourself? If you are a busy professional who would like to have his portfolio managed using our methodology, please contact me directly to get more details.
Contact Ulli