
[Chart courtesy of MarketWatch.com]
- Moving the market
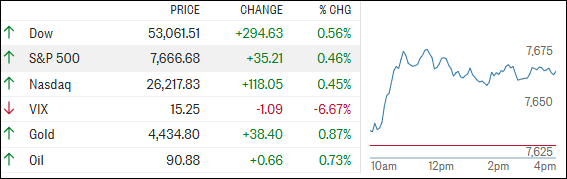
Treasury yields finally took a breather after their recent sprint to multiyear highs, and stocks were happy to take the invitation, with the S&P 500, Nasdaq, and Dow all snapping their three-day losing streaks.
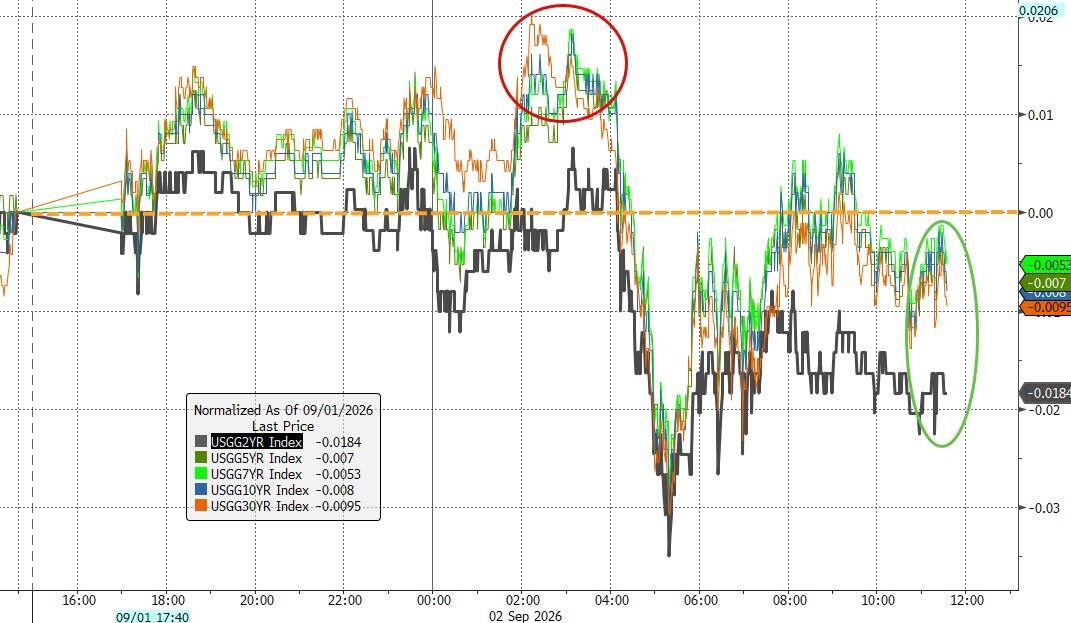
The bigger story hasn’t changed, though. Oil remains parked around the $90-mark, geopolitical tensions are keeping energy traders on edge, and the Fed looks less inclined to shrug off higher energy costs than it did a few months ago. That’s keeping valuation pressure firmly in place.
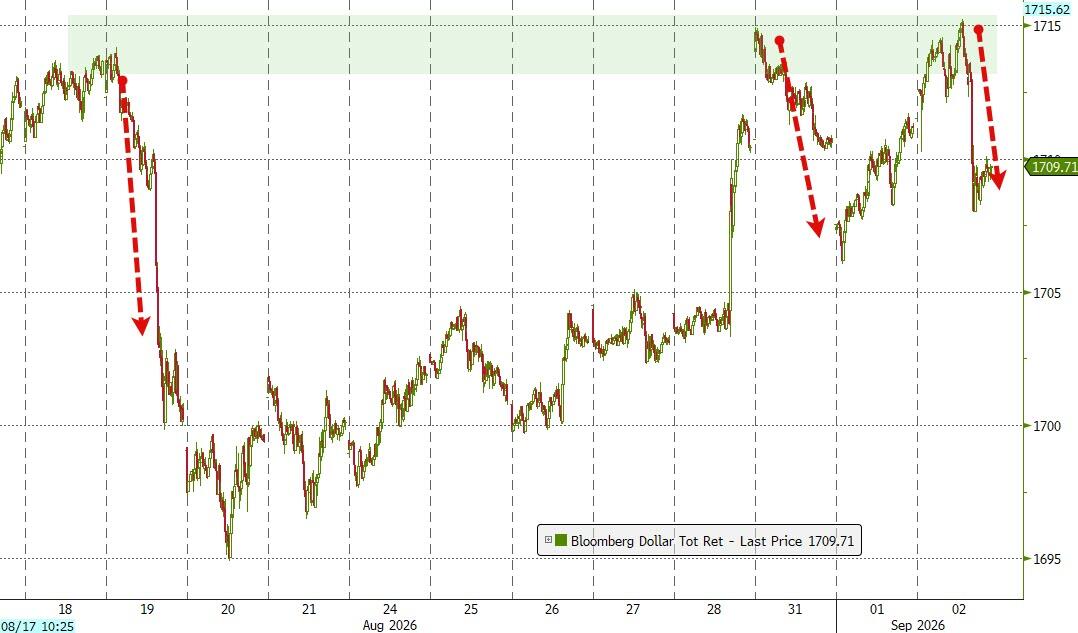
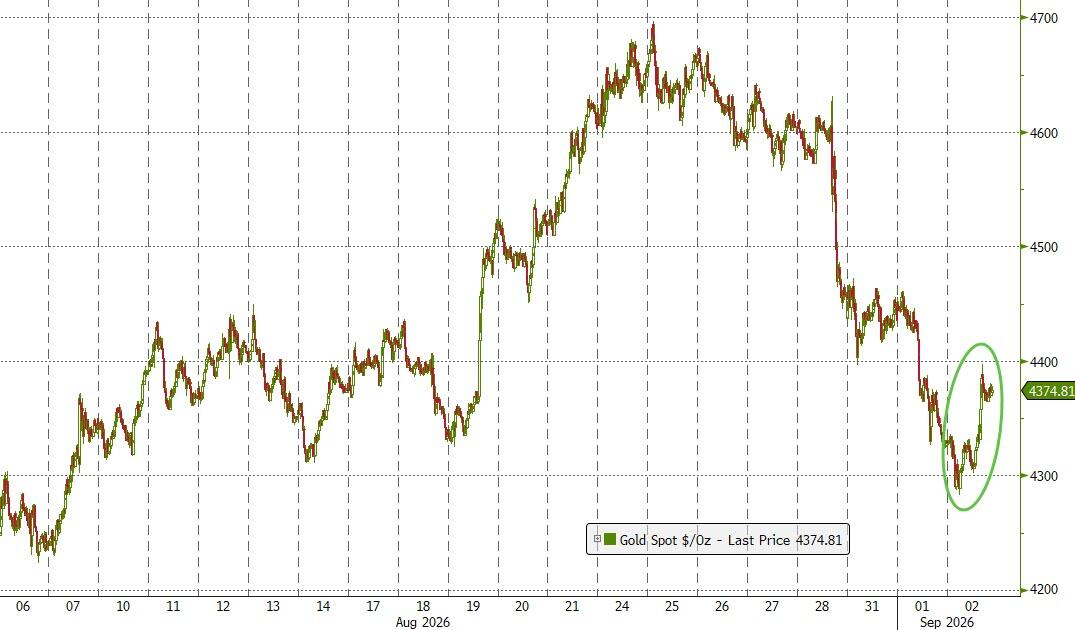
One bright spot today was the weaker dollar, which gave precious metals a tailwind. Gold resumed its march toward new highs, while silver and copper joined the celebration. Bitcoin, meanwhile, seemed perfectly content to watch from the bleachers and do absolutely nothing.
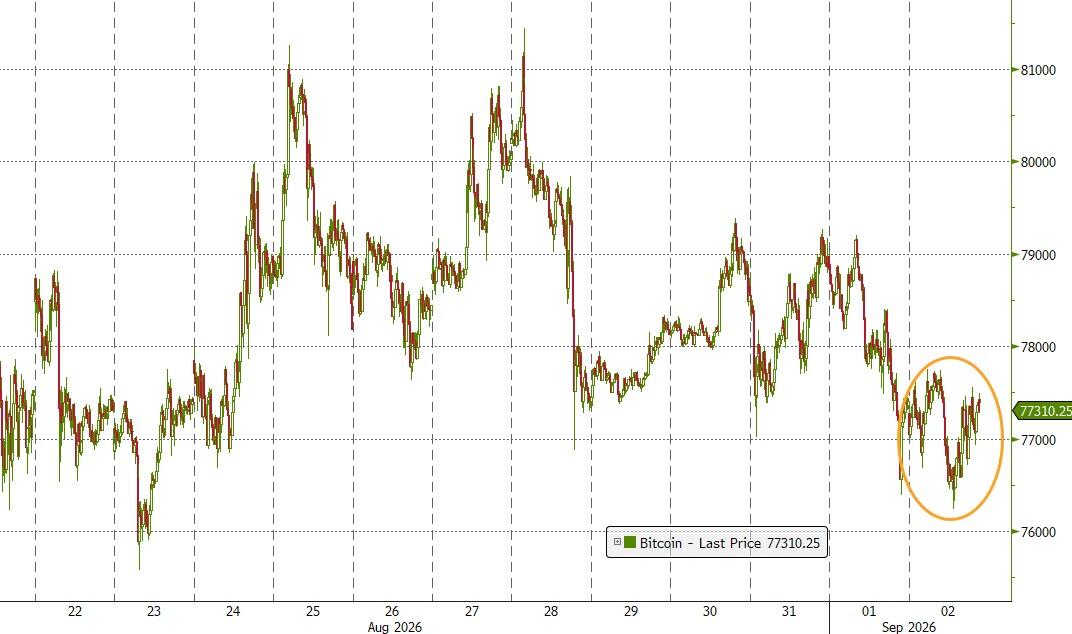
For now, the market’s message is pretty straightforward: lower yields helped stocks catch their breath, but higher energy prices are still the elephant in the room. The question is, which gives way first… oil or investor optimism?
2. Current domestic “Buy” Cycle (effective 5/20/2025); International “Buy” Cycle (effective 5/8/25)
Our domestic bullish cycle that began on November 21, 2023, concluded on April 3, 2025, following a market downturn triggered by President Trump’s tariff policy announcement.
This development caused significant declines across major indexes and broader market indices. However, markets subsequently rebounded, culminating in a new domestic “Buy” signal taking effect May 20, 2025.
Concurrently, our International Trend Tracking Index (TTI) experienced parallel volatility. On April 4, 2025, it breached critical thresholds, prompting a “Sell” recommendation. This position reversed as global markets recovered, with the International TTI regaining sufficient momentum to issue a new “Buy” signal effective May 8, 2025.
3. Trend Tracking Indexes (TTIs)
Bond yields finally took their foot off the gas today, and that was enough to snap the market’s three-day losing streak.
The major indexes all finished in the green, while the metals complex joined the party, led by silver, which climbed nearly 2%.
Our domestic TTI kept pace with the broader market’s rebound, though the international version was content to stay on the sidelines and ended the day essentially flat.
Not every participant was running a victory lap, but after the last few sessions, traders were happy to see green show up to work again.
This is how we closed 09/02/2026:
Domestic TTI: +7.64% above its M/A (prior close +7.14%)—Buy signal effective 5/20/25.
International TTI: +6.91% above its M/A (prior close +6.84%)—Buy signal effective 5/8/25.
All linked charts above are courtesy of Bloomberg via ZeroHedge.
———————————————————-
WOULD YOU LIKE TO HAVE YOUR INVESTMENTS PROFESSIONALLY MANAGED?
Do you have the time to follow our investment plans yourself? If you are a busy professional who would like to have his portfolio managed using our methodology, please contact me directly to get more details.
Contact Ulli