
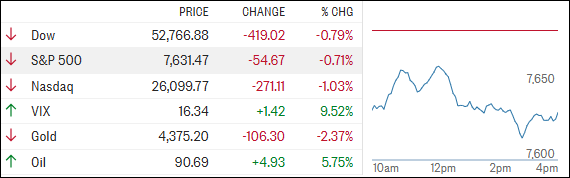
[Chart courtesy of MarketWatch.com]
- Moving the market
September got off to a rough start, with inflation concerns and a 6% jump in oil prices pushing bond yields higher around the world and putting pressure on nearly every asset class.
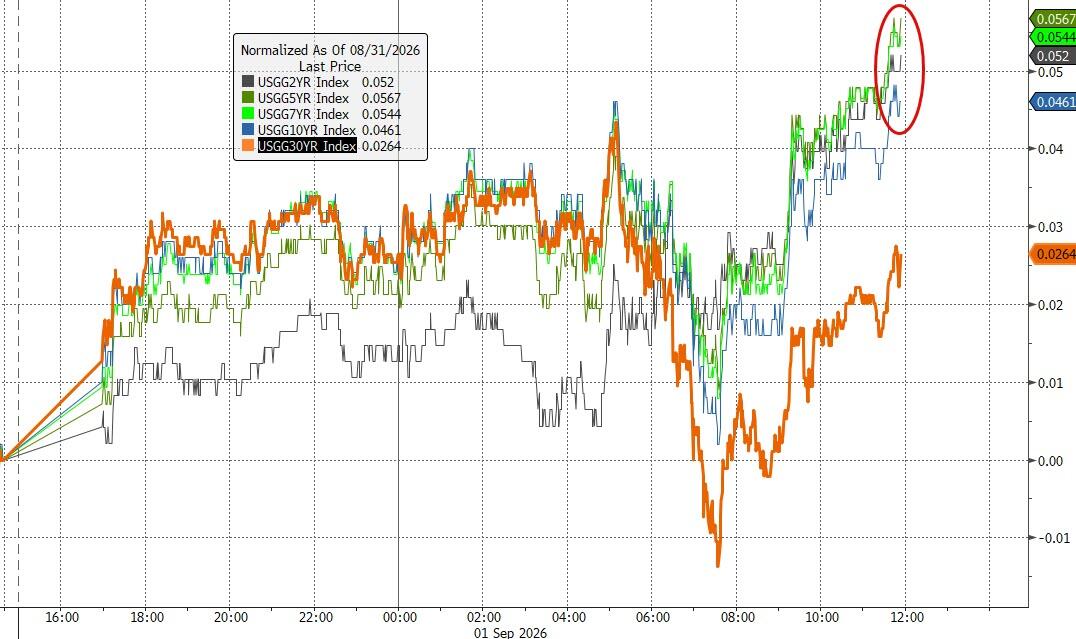
The rising rate backdrop weighed heavily on tech, with names like Nvidia, AMD, Microsoft, and Alphabet leading the retreat.
What really mattered today was the continued surge in global yields. The U.S. 10-year Treasury climbed to its highest level since early 2025, while yields in Japan and Germany hit multi-year highs.
Traders are clearly wondering whether sticky inflation and higher energy costs could keep the Fed in a more hawkish mood when it meets later this month.
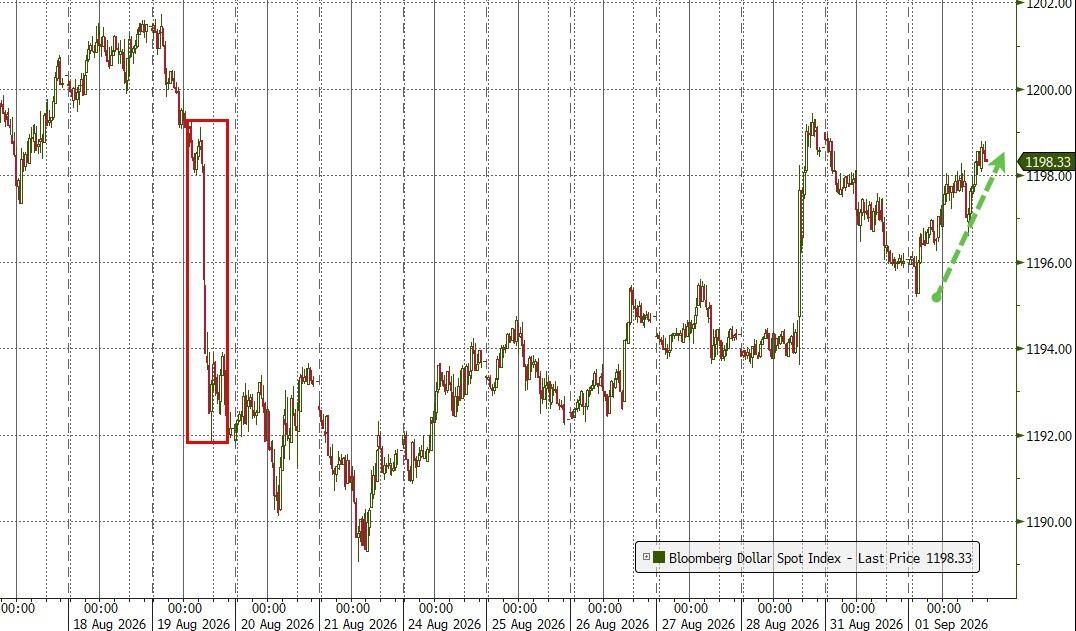
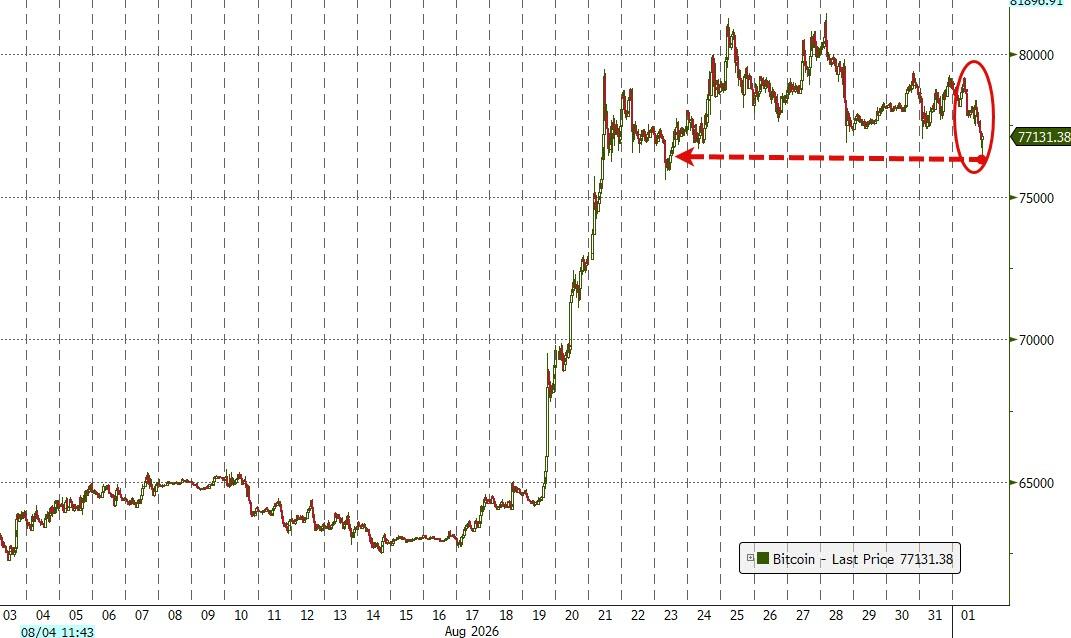
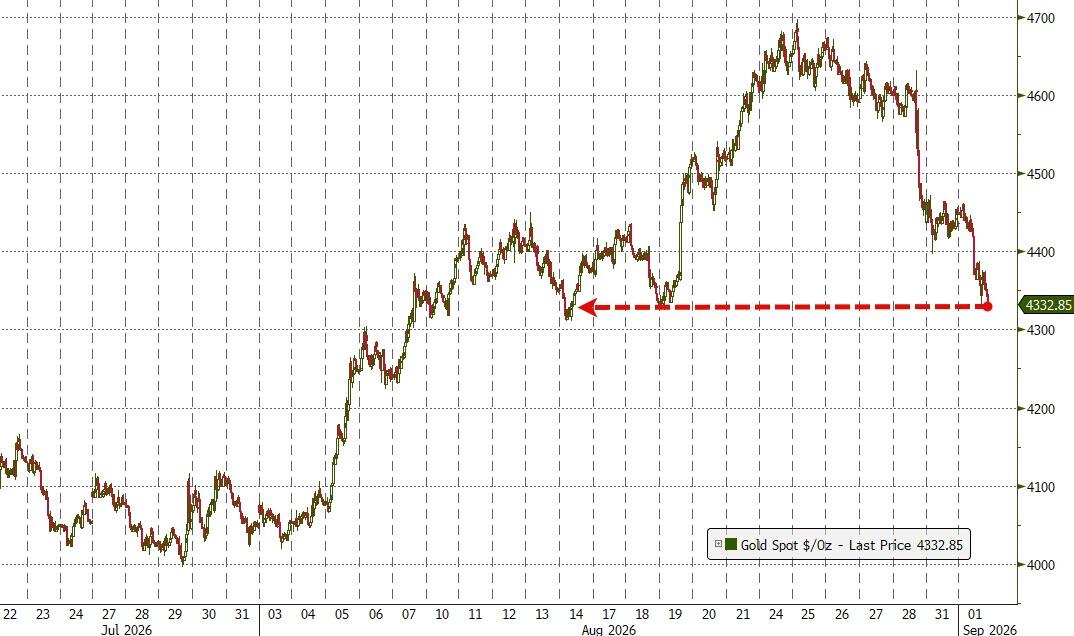
The stronger dollar was another key story, knocking bitcoin back toward the $77,000 area and sending gold below $4,400.
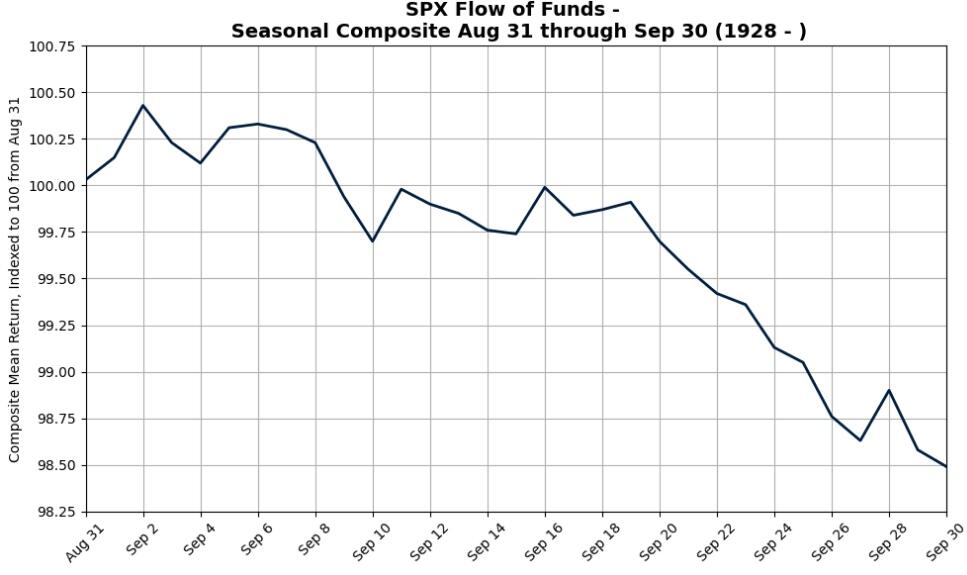
Add in renewed Middle East tensions and September’s less-than-stellar reputation for stocks, and it felt like the market showed up after a long weekend in a particularly grumpy mood.
The question now is whether today’s selling was just an uneasy start to September, or the beginning of a more persistent seasonal headwind.
2. Current domestic “Buy” Cycle (effective 5/20/2025); International “Buy” Cycle (effective 5/8/25)
Our domestic bullish cycle that began on November 21, 2023, concluded on April 3, 2025, following a market downturn triggered by President Trump’s tariff policy announcement.
This development caused significant declines across major indexes and broader market indices. However, markets subsequently rebounded, culminating in a new domestic “Buy” signal taking effect May 20, 2025.
Concurrently, our International Trend Tracking Index (TTI) experienced parallel volatility. On April 4, 2025, it breached critical thresholds, prompting a “Sell” recommendation. This position reversed as global markets recovered, with the International TTI regaining sufficient momentum to issue a new “Buy” signal effective May 8, 2025.
3. Trend Tracking Indexes (TTIs)
Higher yields and inflation jitters called the shots today, and pretty much everything felt the pressure.
Stocks, bonds, and even the metals crowd couldn’t catch a bid. Our TTIs weren’t spared either, with the domestic model taking the bigger hit while the international side showed a bit more resilience.
Not exactly a day for chest-thumping, but on the bright side, the bears got their cardio in.
This is how we closed 09/01/2026:
Domestic TTI: +7.14% above its M/A (prior close +8.00%)—Buy signal effective 5/20/25.
International TTI: +6.84% above its M/A (prior close +6.97%)—Buy signal effective 5/8/25.
All linked charts above are courtesy of Bloomberg via ZeroHedge.
———————————————————-
WOULD YOU LIKE TO HAVE YOUR INVESTMENTS PROFESSIONALLY MANAGED?
Do you have the time to follow our investment plans yourself? If you are a busy professional who would like to have his portfolio managed using our methodology, please contact me directly to get more details.
Contact Ulli