
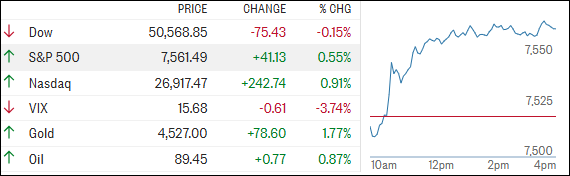
[Chart courtesy of MarketWatch.com]
- Moving the market
The S&P 500 and Nasdaq got off to a strong start after reports that negotiators had reached a deal to extend the Iran ceasefire—but traders never fully let their guard down.
Stocks pushed to session highs once news broke that the U.S. and Iran had agreed to a 60-day memorandum to keep the ceasefire in place and continue talks around Iran’s nuclear program.
That said, there’s still some uncertainty hanging over things, as President Trump hasn’t officially signed off on the deal yet.
On the macro side, the Fed’s preferred inflation gauge—PCE—came in a bit cooler than expected. Prices rose 0.4% in April (below the 0.5% forecast), while the annual rate held steady at 3.8%.
That softer monthly number gave markets a little hope that inflation pressures might finally be easing, even if we’re still well above the Fed’s 2% target.
By the close, the S&P 500 and Nasdaq managed to hang on to their gains, even with the constant “peace-on, peace-off” headlines, weakening macro data, and fading rate-cut expectations.
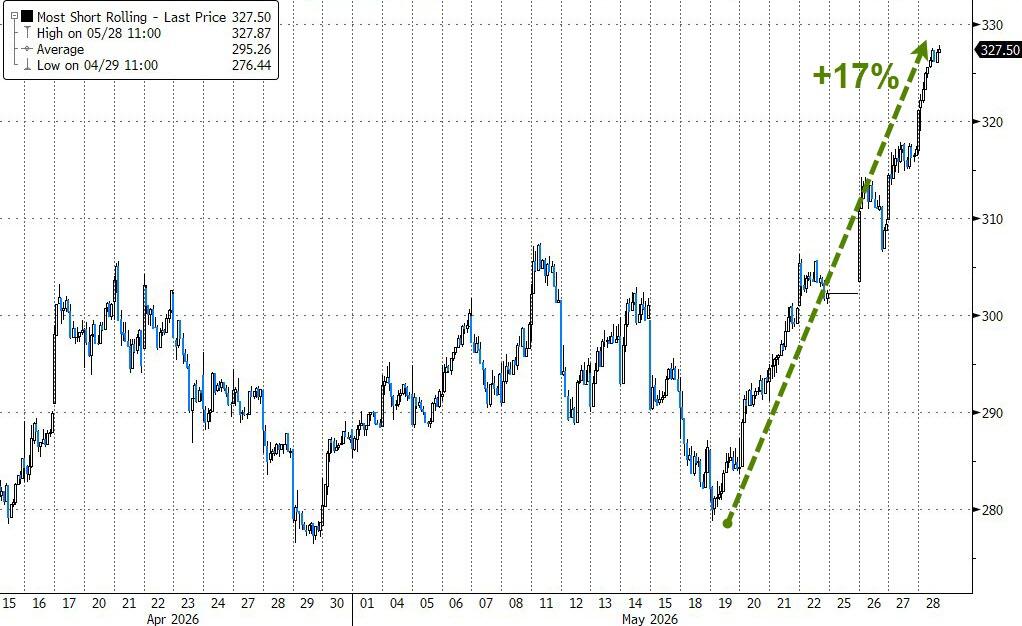
Under the surface, small caps and the Nasdaq led the way. Small caps, in particular, got a boost from heavily shorted names, which have now ripped about 17% over the past seven sessions.
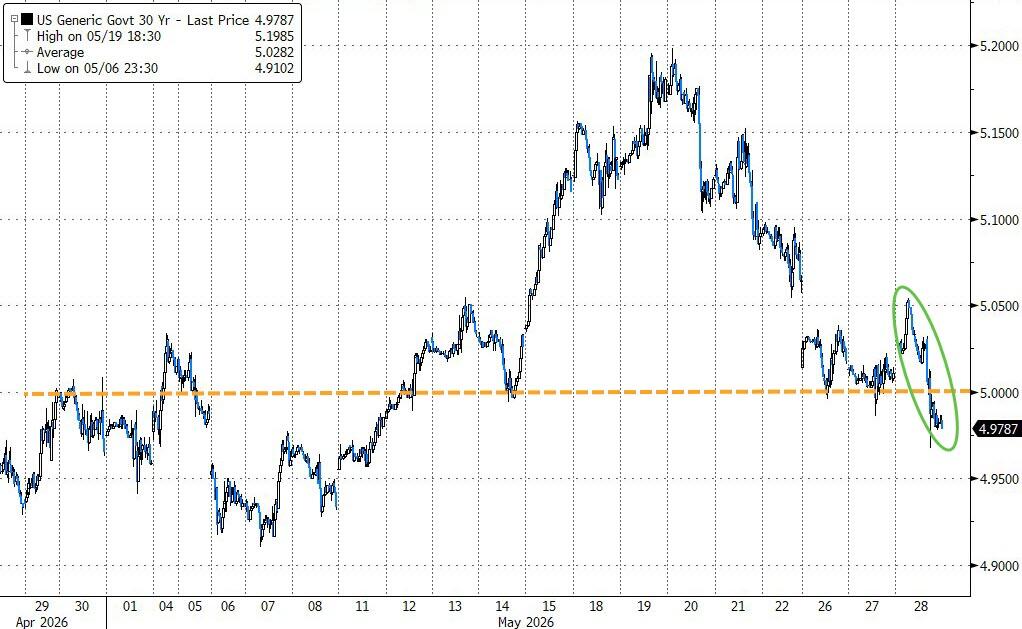
Falling bond yields also helped, with the 30-year slipping back below 5%.
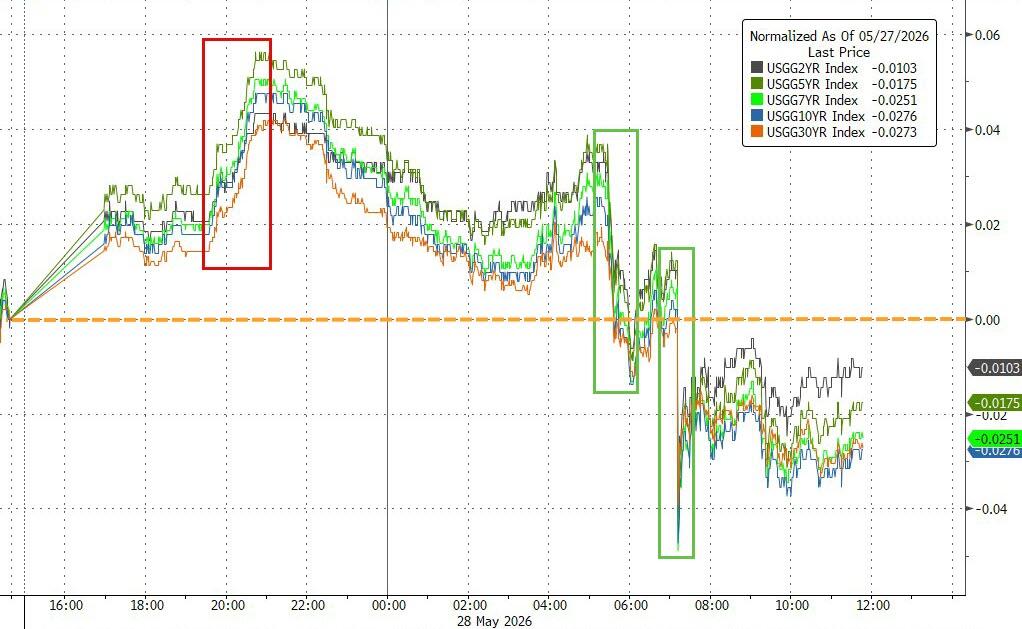
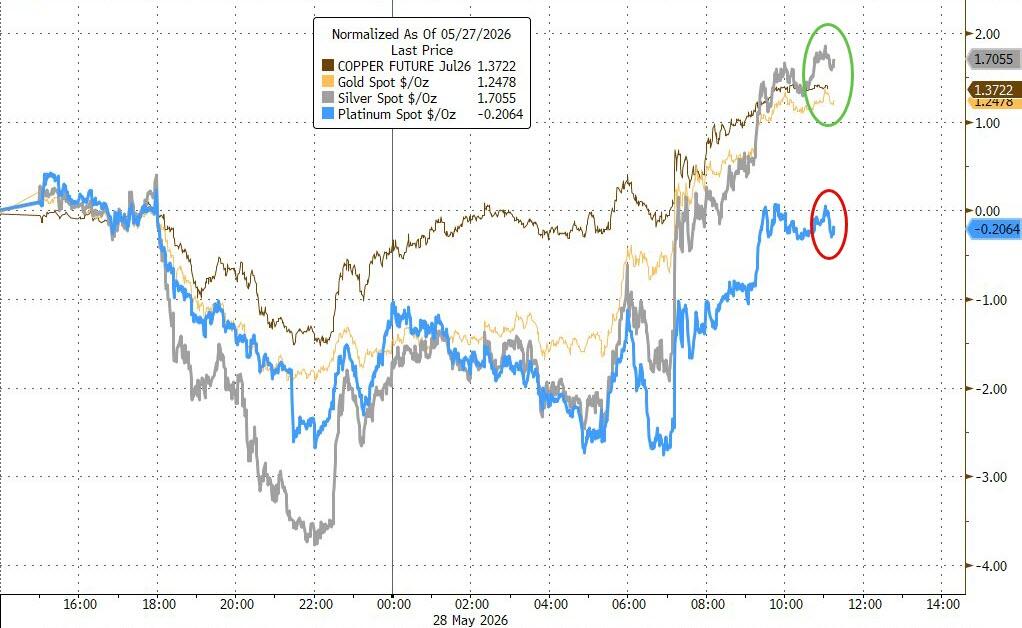
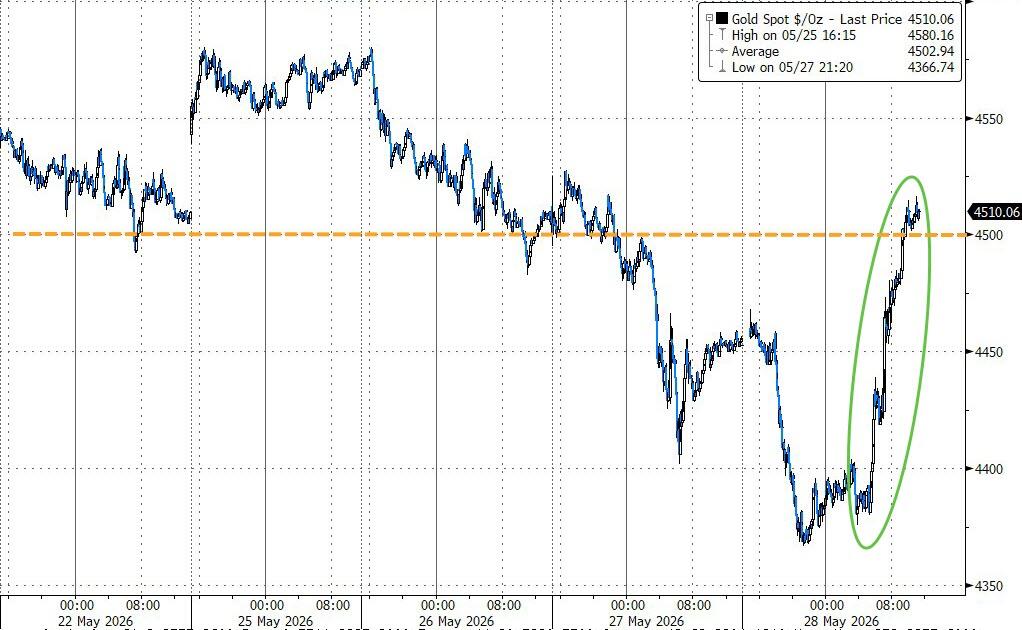
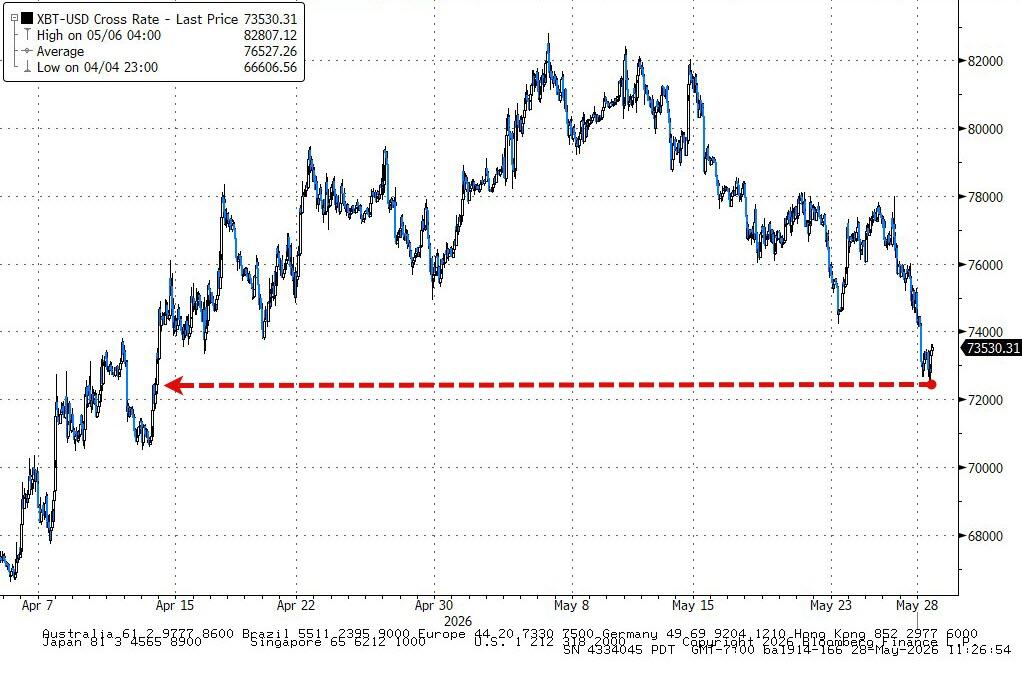
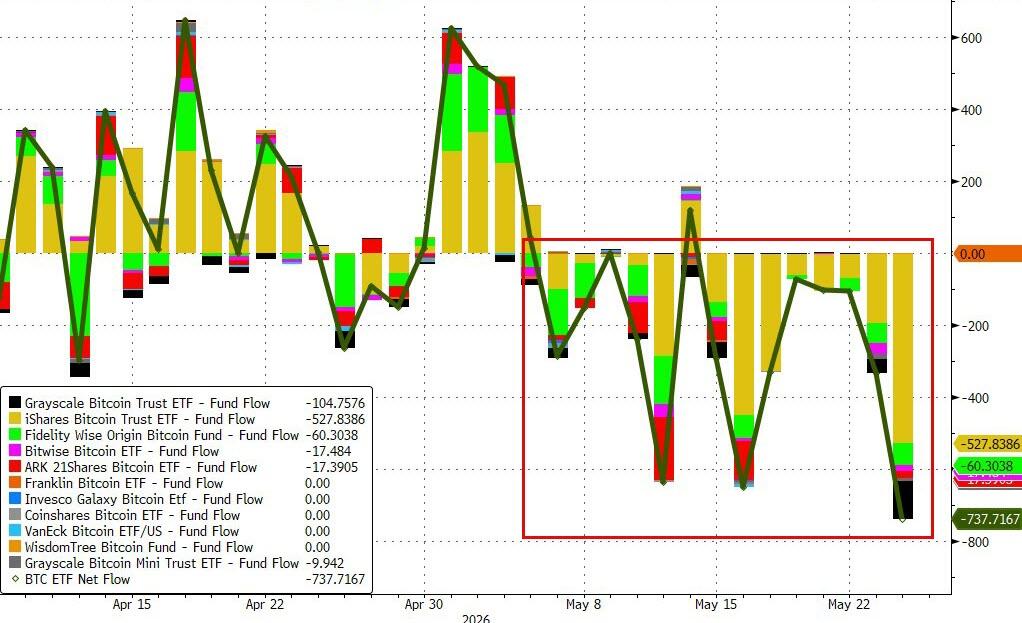
That drop in yields weighed on the dollar and gave a lift to precious metals, with gold climbing back above $4,500. Bitcoin, however, went the other way—dropping to around $72K as ETF outflows pressured prices.
What’s interesting is that markets held up surprisingly well despite a string of weak economic data, including soft PCE, disappointing GDP, falling capital goods orders, and a drop in home sales.
So, my question is: how long can stocks keep shrugging off bad news before it finally starts to matter?
2. Current domestic “Buy” Cycle (effective 5/20/2025); International “Buy” Cycle (effective 5/8/25)
Our domestic bullish cycle that began on November 21, 2023, concluded on April 3, 2025, following a market downturn triggered by President Trump’s tariff policy announcement.
This development caused significant declines across major indexes and broader market indices. However, markets subsequently rebounded, culminating in a new domestic “Buy” signal taking effect May 20, 2025.
Concurrently, our International Trend Tracking Index (TTI) experienced parallel volatility. On April 4, 2025, it breached critical thresholds, prompting a “Sell” recommendation. This position reversed as global markets recovered, with the International TTI regaining sufficient momentum to issue a new “Buy” signal effective May 8, 2025.
3. Trend Tracking Indexes (TTIs)
The S&P 500 and Nasdaq kept their upward momentum going all session, while the Dow trailed as the clear laggard.
Lower bond yields helped give equities a boost and also supported the metals complex, which finally showed some signs of life after being quiet.
Our TTIs told a mixed story—domestic continued to move higher, while international performance stayed basically flat.
This is how we closed 05/28/2026:
Domestic TTI: +7.54% above its M/A (prior close +7.15%)—Buy signal effective 5/20/25.
International TTI: +9.69% above its M/A (prior close +9.77%)—Buy signal effective 5/8/25.
All linked charts above are courtesy of Bloomberg via ZeroHedge.
———————————————————-
WOULD YOU LIKE TO HAVE YOUR INVESTMENTS PROFESSIONALLY MANAGED?
Do you have the time to follow our investment plans yourself? If you are a busy professional who would like to have his portfolio managed using our methodology, please contact me directly to get more details.
Contact Ulli