
ETF Tracker StatSheet
You can view the latest version here.
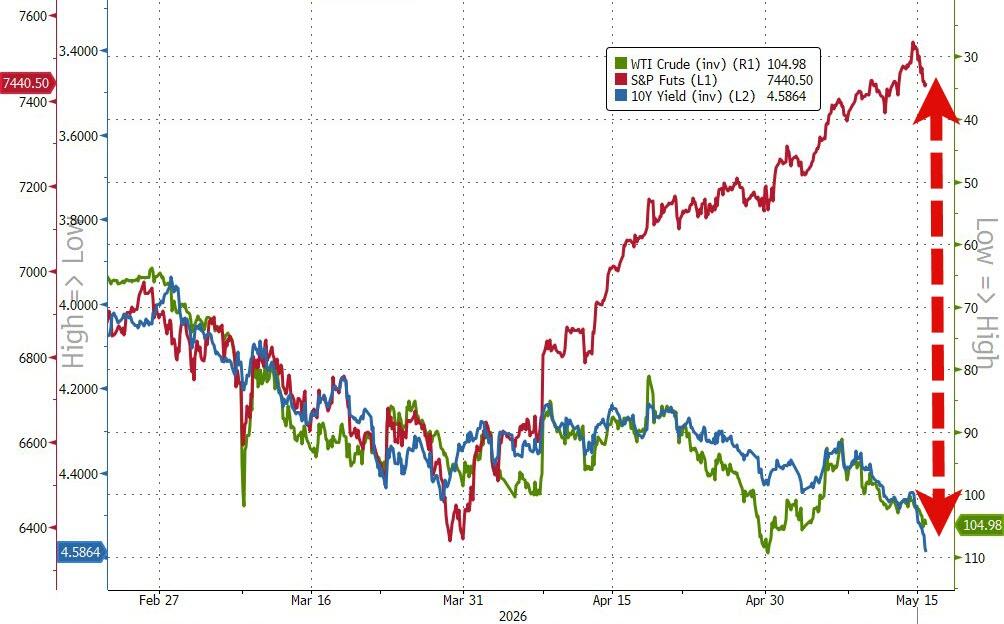
RISING YIELDS AND CHINA DISAPPOINTMENT KNOCK STOCKS LOWER
- Moving the market
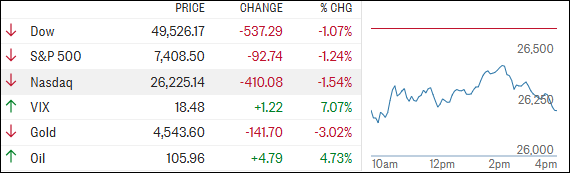
Stocks took a step back as a tech sell‑off and a sharp jump in bond yields knocked the wind out of the market’s recent rally.
Adding to the sour mood, the much‑anticipated summit between Presidents Trump and Xi wrapped up without any major policy breakthroughs or meaningful business deals—leaving traders underwhelmed.
While both sides agreed the Strait of Hormuz needs to stay open, the handful of headlines that did come out of Beijing—like the Boeing order news—failed to impress.
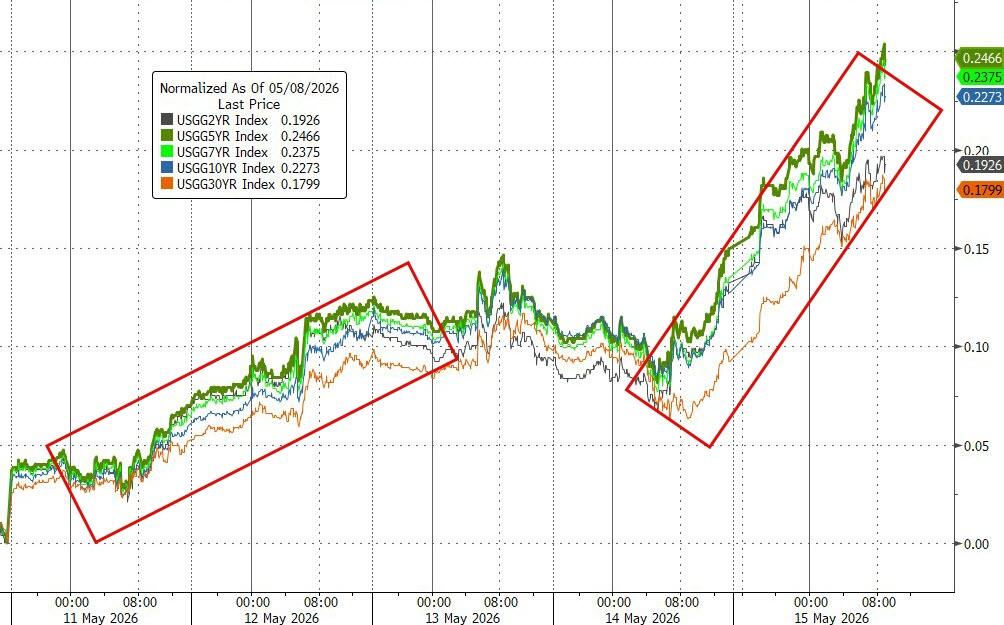
At the same time, bond yields surged, with the 30‑year topping 5.1%, its highest level since 2025. That move followed a week of inflation data showing price pressures heating back up, especially with oil prices staying elevated. Rising rates tend to hit high‑growth stocks first, and tech felt it.
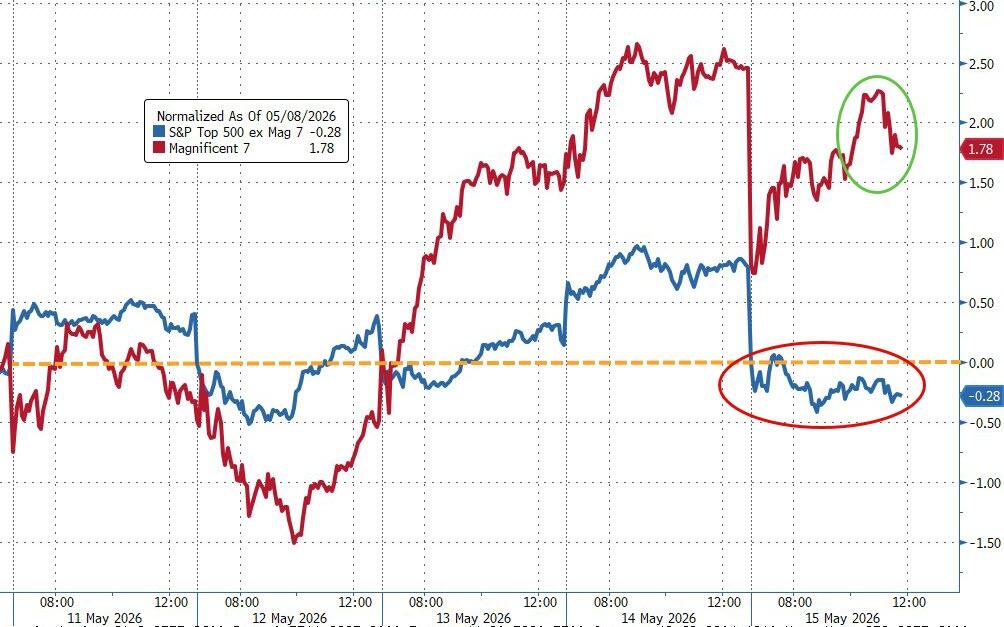
The broader concern lurking beneath the surface is market breadth. Stocks have been riding a record‑breaking run fueled by AI excitement, but peel back the layers and it’s clear the gains are being carried by just a handful of mega‑cap tech names.
The widening gap between the Magnificent 7 and the rest of the market has more traders questioning how sturdy this rally really is.
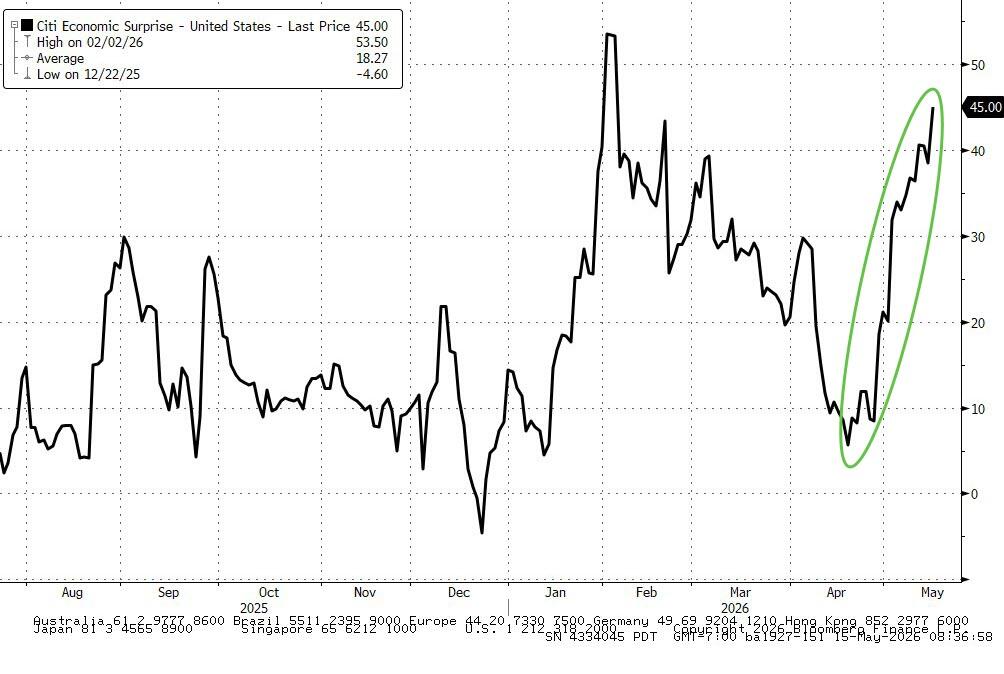
Even with U.S. macro data coming in stronger than expected, stubborn inflation, surging yields, and the “nothing burger” from Beijing were enough to send the bulls packing—at least for the day. Equities finished deep in the red across the board.
Oil prices moved higher after Trump left the China meeting without any meaningful discussion around boosting energy flows through the Strait of Hormuz, reigniting worries about potential supply disruptions. Traders also stayed on edge as the ceasefire between the U.S. and Iran continues to look fragile.
By week’s end, the S&P 500 managed to close in the green—but only because the Mag 7 did all the heavy lifting. Strip those out, and the S&P 493 actually finished the week in the red.
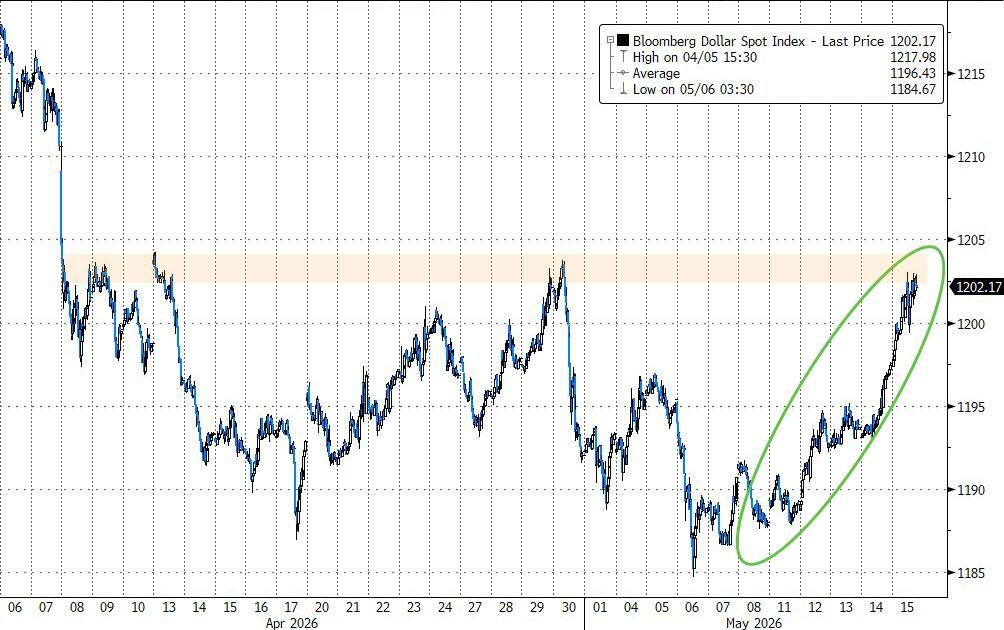
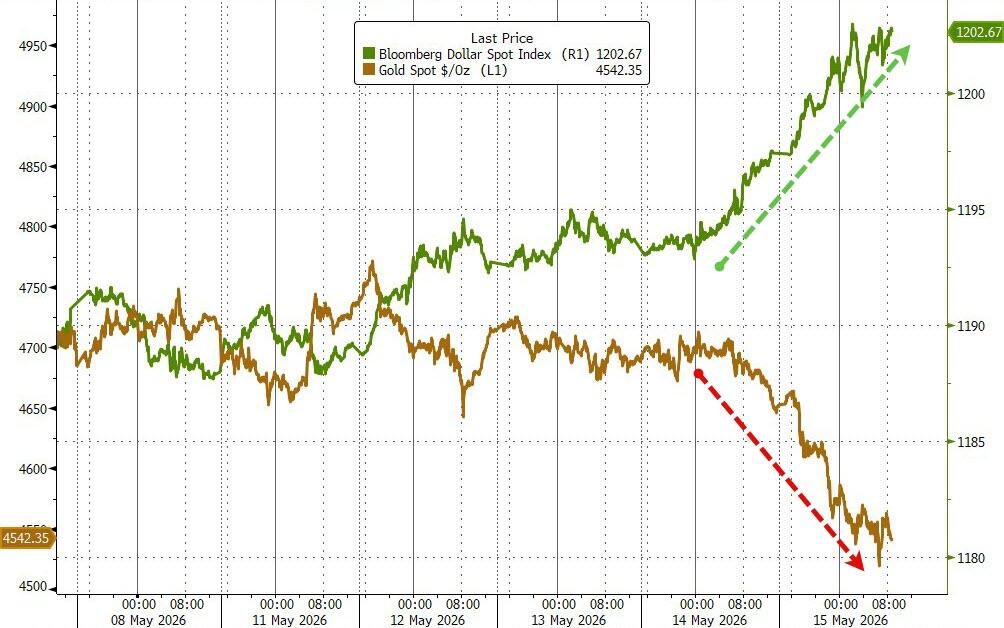
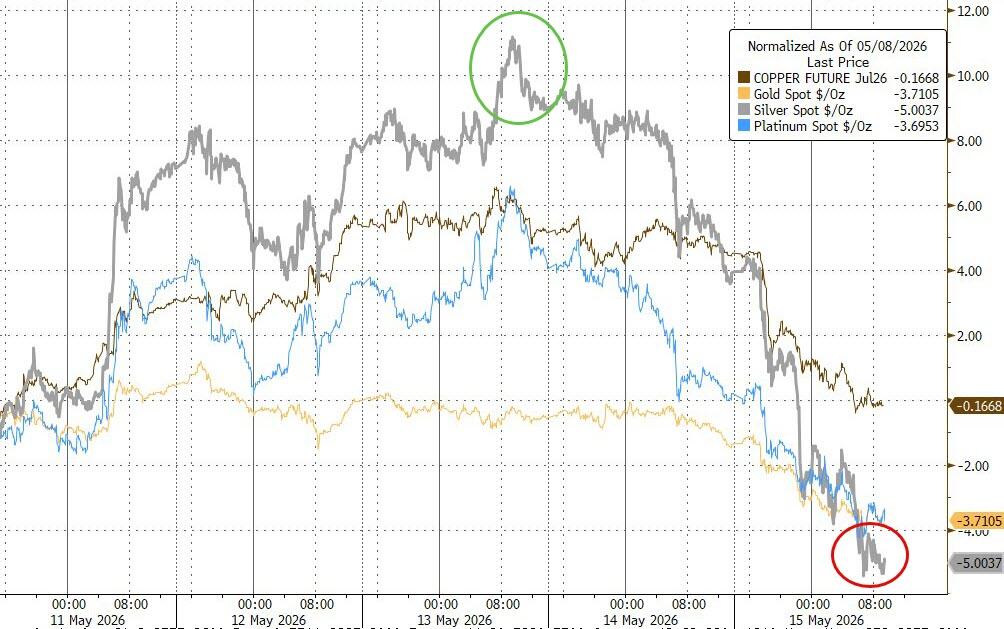
The dollar logged its second‑best week since November 2024, which weighed on precious metals. Gold found support near $4,500, while silver’s wild swings stole the spotlight—giving back an 11% midweek gain to finish down about 5%.
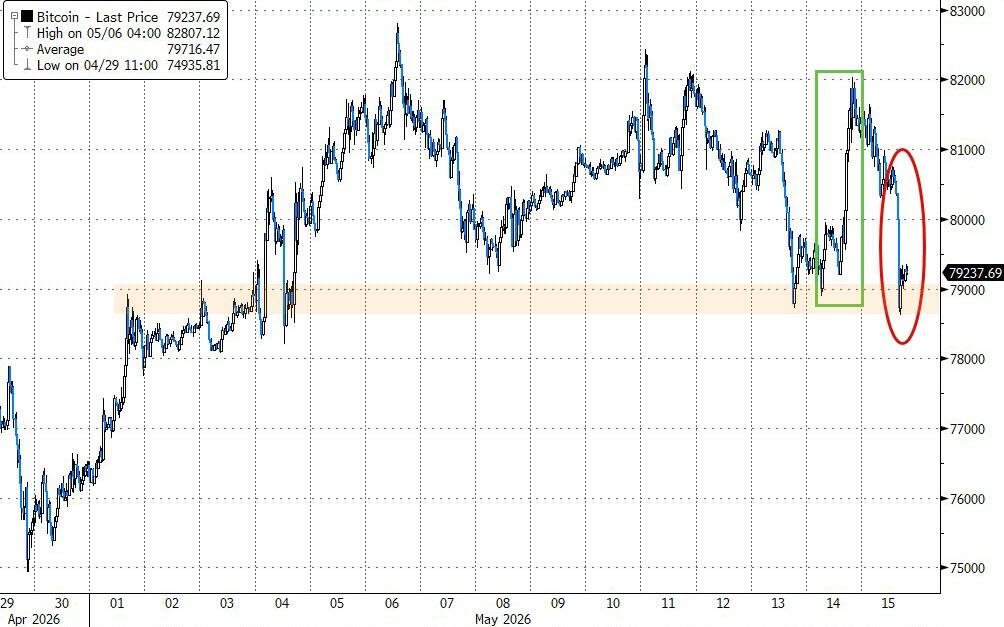
Bitcoin followed a similar path, briefly testing $82K earlier in the week before sliding back toward $78K.
In the end, all roads still lead back to interest rates—and with this growing gap between yields and equities, something eventually has to give. So, which one moves first?
2. Current domestic “Buy” Cycle (effective 5/20/2025); International “Buy” Cycle (effective 5/8/25)
Our domestic bullish cycle that began on November 21, 2023, concluded on April 3, 2025, following a market downturn triggered by President Trump’s tariff policy announcement.
This development caused significant declines across major indexes and broader market indices. However, markets subsequently rebounded, culminating in a new domestic “Buy” signal taking effect May 20, 2025.
Concurrently, our International Trend Tracking Index (TTI) experienced parallel volatility. On April 4, 2025, it breached critical thresholds, prompting a “Sell” recommendation. This position reversed as global markets recovered, with the International TTI regaining sufficient momentum to issue a new “Buy” signal effective May 8, 2025.
3. Trend Tracking Indexes (TTIs)
From the opening bell, the bulls were nowhere to be found, leaving the bears firmly in control from start to finish. Sellers never really let up, and the market slid steadily throughout the session.
The selling was broad‑based, hitting nearly every sector. Even traditionally defensive value names couldn’t escape the pressure and took their lumps alongside the rest of the market.
Our TTIs weren’t immune to the pullback and moved lower as well, but the bigger picture remains intact—they’re still holding above their respective trend lines and staying on the bullish side for now.
This is how we closed 05/15/2026:
Domestic TTI: +4.35% above its M/A (prior close +5.69%)—Buy signal effective 5/20/25.
International TTI: +8.17% above its M/A (prior close +10.23%)—Buy signal effective 5/8/25.
All linked charts above are courtesy of Bloomberg via ZeroHedge.
———————————————————-
WOULD YOU LIKE TO HAVE YOUR INVESTMENTS PROFESSIONALLY MANAGED? Do you have the time to follow our investment plans yourself? If you are a busy professional who would like to have his portfolio managed using our methodology, please contact me directly to get more details.
Contact Ulli