
- Moving the markets
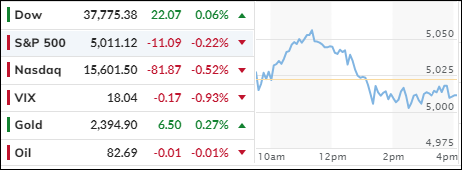
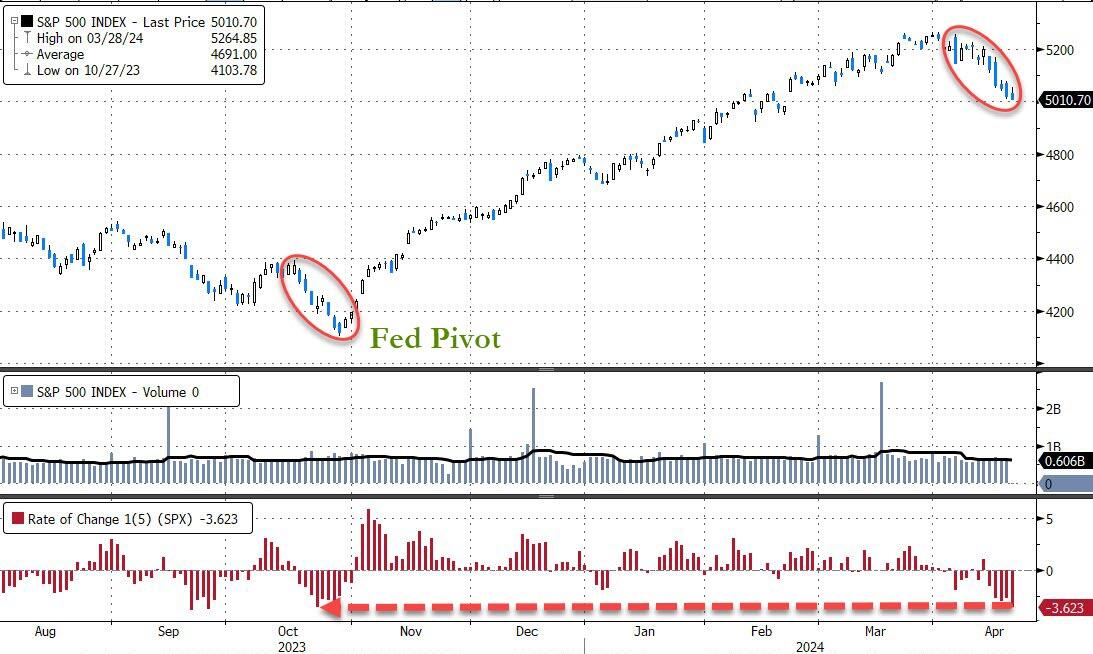
The S&P 500 index continued its downward trajectory, extending its losing streak to five consecutive days. Wall Street witnessed a seesaw battle between optimism and caution, resulting in a lackluster recovery attempt. Meanwhile, the Nasdaq faced headwinds, struggling with a 3% decline this week, marking its longest negative streak since December 2022.
Amidst this volatility, more than 12% of S&P 500-listed companies have reported earnings, showing promise for a positive season. Notably, 73% of these companies have exceeded Wall Street expectations. However, the second quarter has proven challenging due to mounting concerns about inflation and the Federal Reserve’s monetary policy.
As April unfolds, all three major indexes remain in the red, a stark contrast to the robust performance seen in the first quarter.
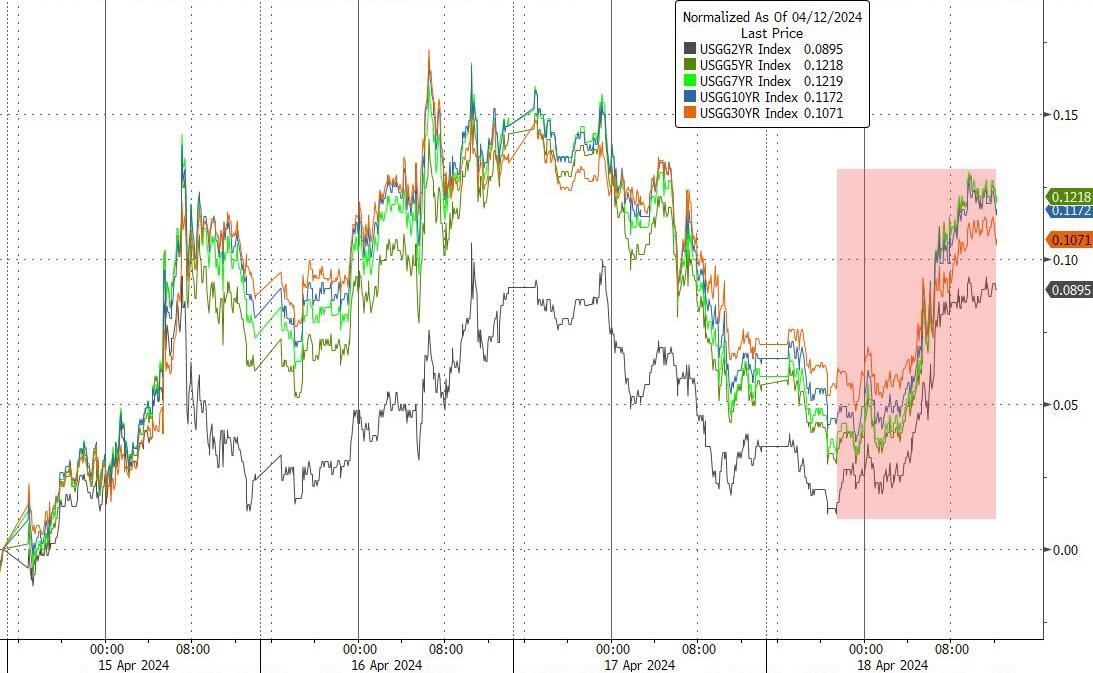
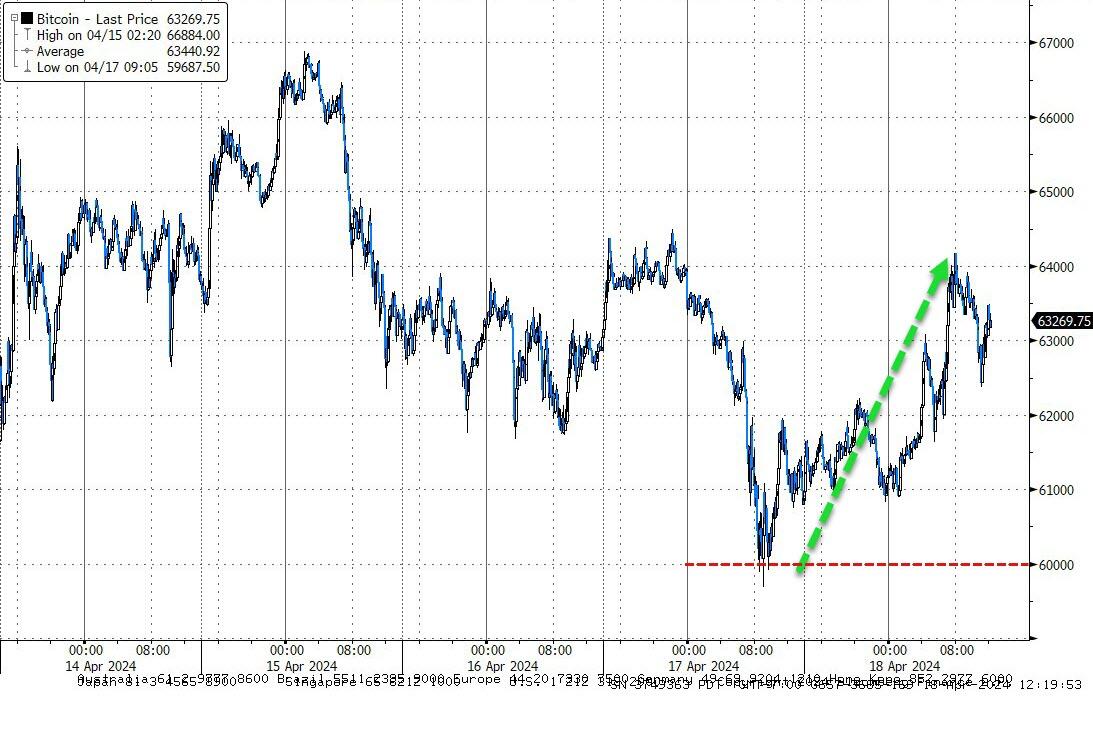
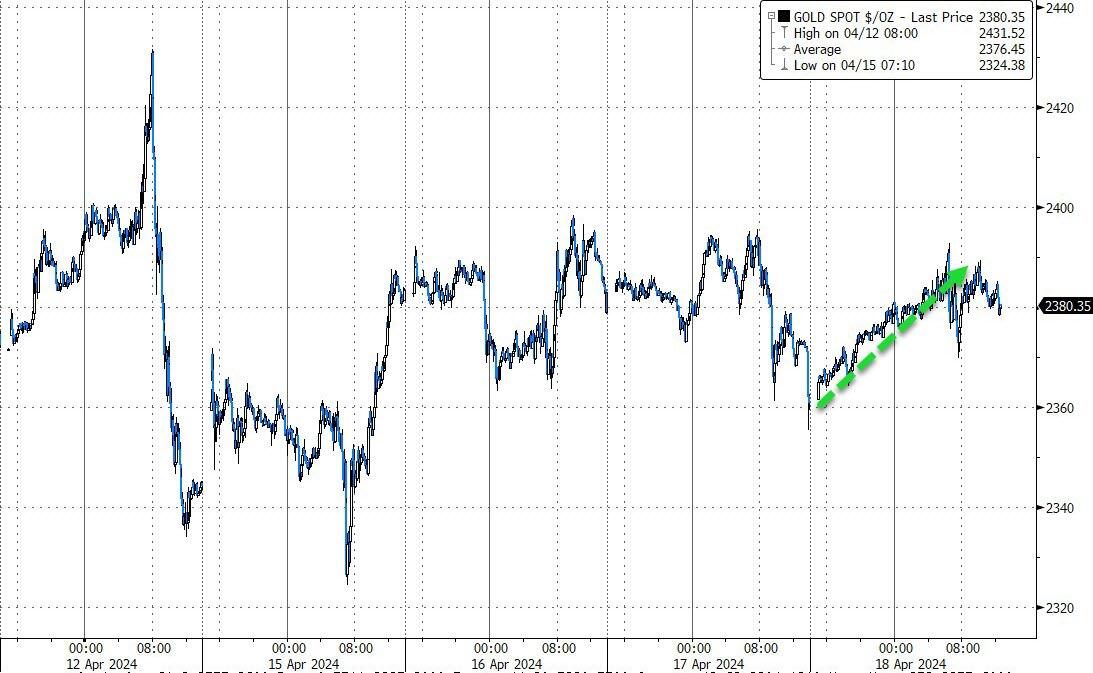
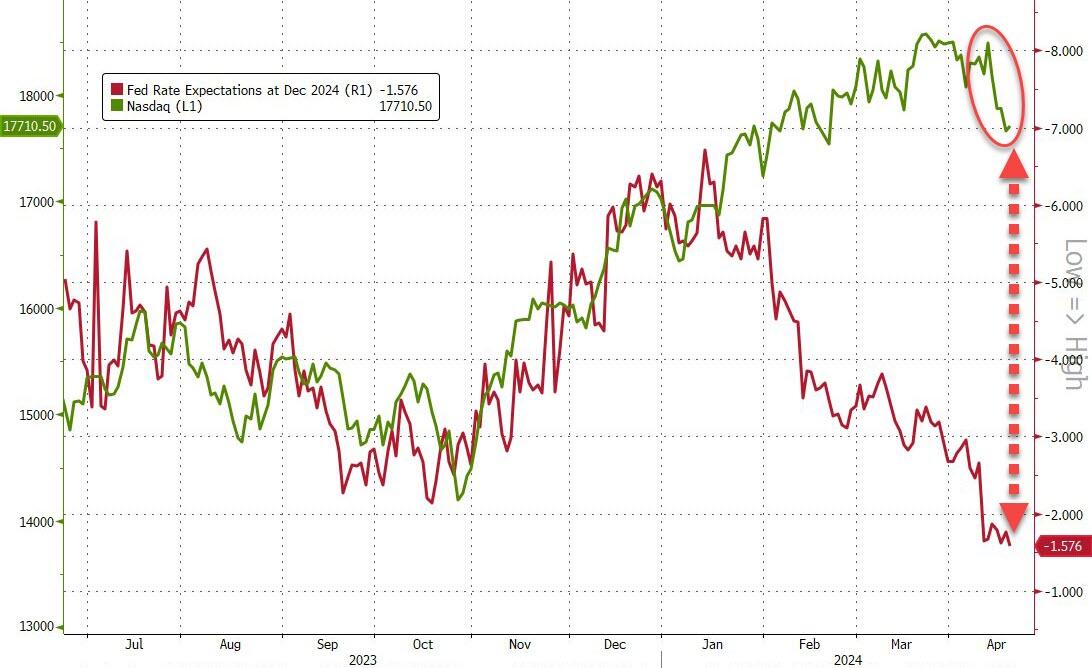
Bond yields surged, impacting equities, while Bitcoin and gold exhibit contrasting trends. The critical question remains:
Who will emerge victorious in this battle between rate hike expectations and the Nasdaq?
2. Current “Buy” Cycles (effective 11/21/2023)
Our Trend Tracking Indexes (TTIs) have both crossed their trend lines with enough strength to trigger new “Buy” signals. That means, Tuesday, 11/21/2023, was the official date for these signals.
If you want to follow our strategy, you should first decide how much you want to invest based on your risk tolerance (percentage of allocation). Then, you should check my Thursday StatSheet and Saturday’s “ETFs on the Cutline” report for suitable ETFs to buy.
3. Trend Tracking Indexes (TTIs)
The stock market experienced another volatile day, characterized by a back-and-forth struggle between buyers (bulls) and sellers (bears). Ultimately, the sellers prevailed for the fifth consecutive session, although the decline in market value was relatively small.
Our TTIs showed divergent movements; the domestic index decreased slightly, while the international index recorded a gain.
This is how we closed 4/18/2024:
Domestic TTI: +4.96% above its M/A (prior close +5.06%)—Buy signal effective 11/21/2023.
International TTI: +5.80% above its M/A (prior close +5.48%)—Buy signal effective 11/21/2023.
All linked charts above are courtesy of Bloomberg via ZeroHedge.
———————————————————-
WOULD YOU LIKE TO HAVE YOUR INVESTMENTS PROFESSIONALLY MANAGED?
Do you have the time to follow our investment plans yourself? If you are a busy professional who would like to have his portfolio managed using our methodology, please contact me directly to get more details.
—————————————————————-
Contact Ulli